Munich Personal RePEc Archive
Trends in High Technology Trade
Pohit, Sanjib
NISTADS
2009
Online at
https://mpra.ub.uni-muenchen.de/25179/
Trends in High Technology Trade
1
Sanjib Pohit
National Institute of Science
Technology and Development Studies
Pusa Gate
K.S. Krishnan Marg
New Delhi 110 012 INDIA
Email: [email protected]
; [email protected]
1
1.
Introduction
The process of major economic reforms undertaken in the Indian economy has now completed
seventeen years of implementation. The economy has entered into a new phase of development directed
towards becoming globally competitive through opening up to trade, foreign investment, and technology
inflows. The unilateral reforms of the trade and domestic policies of India, along with reforms of the tax
regime since 1991, represent a significant departure from the policy framework of the previous four
decades and are important to the future course of the Indian economy
2.
The economy reforms seem to have paid off handsomely. The economy is now on a high
growth trajectory, registering growth of around 8 per cent in the present decade. In fact, the Indian
economy is now among the fastest growing economies of the world. The Indian economy is now more
integrated with the world. India’s trade to GDP ratio has increased from 15 percent to 45 percent of
GDP between 1990 and 2007
3.
One of the objective of the launching of the economic reforms was it would facilitate access to
new technology. As a result, India would be able to move up the technology ladder in all spheres of
activities. It should be manifested in the growth of high-technology manufacturing industries and
knowledge-intensive service industries. It should be accompanied with the growth of India’s trade in the
above two segments in the global marketplace. This paper attempts to analyse India’s performance of
same over time and vis-à-vis other major economies.
2.
High Technology Merchandise Trade
This section presents a detailed analysis of the trade in high technology manufacturing products. Our
focus is on trends over time and the relative position vis-à-vis other economies.
In order to analyse the competitive and trade performance of high technology products, one
need to define what constitute high technology segments. The standard approach that is commonly used
to identify technology-intensive industries and products is the product approach. The product list is
based on the calculations of R&D intensity by groups of products (R&D expenditure/total sales).
Exports and imports of these products comprise high technology trade. According to European Union’s
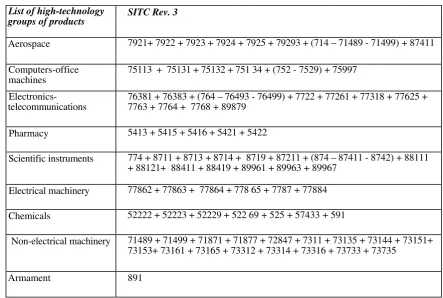
definition of high technology trade, the following commodities comprise the same:
42
Table A. High-Technology groups of Products
List of high-technology
groups of products
SITC Rev. 3
Aerospace
7921+ 7922 + 7923 + 7924 + 7925 + 79293 + (714 – 71489 - 71499) + 87411
Computers-office
machines
75113 + 75131 + 75132 + 751 34 + (752 - 7529) + 75997
Electronics-telecommunications
76381 + 76383 + (764 – 76493 - 76499) + 7722 + 77261 + 77318 + 77625 +
7763 + 7764 + 7768 + 89879
Pharmacy
5413 + 5415 + 5416 + 5421 + 5422
Scientific instruments
774 + 8711 + 8713 + 8714 + 8719 + 87211 + (874 – 87411 - 8742) + 88111
+ 88121+ 88411 + 88419 + 89961 + 89963 + 89967
Electrical machinery
77862 + 77863 + 77864 + 778 65 + 7787 + 77884
Chemicals
52222 + 52223 + 52229 + 522 69 + 525 + 57433 + 591
Non-electrical machinery
71489 + 71499 + 71871 + 71877 + 72847 + 7311 + 73135 + 73144 + 73151+
73153+ 73161 + 73165 + 73312 + 73314 + 73316 + 73733 + 73735
Armament
891
All high technology trade data are extracted from the World Bank’s WITS database. In what
follows, we analyse the performance of India’s trade in respect of the above commodity groups in recent
years. To judge India’s presence in the global market, a comparison is made with respect to selected
countries. The selected countries are basically the so-called developed (OECD) countries, and some
newly industrialised countries as well as the other members of the BRICs group of countries.
52.1
Aggregate Trade
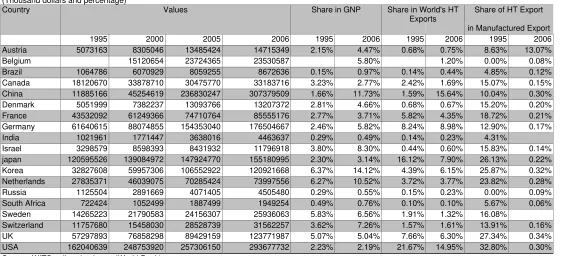
Table 2-1 shows the trends of high technology exports in aggregate for selected countries between 1995
and 2006. As Table 2-1 shows, India’s high technology trade has increased from US $ 1021 millions in
1995 to US $ 4463 millions in 2006. During the same period, the export of high technology trade of
Brazil has increased by 8 times, while that of China has risen by 25 times! The share of high technology
trade in India’s GNP at 0.49 percent in 2006 is the lowest among the group of selected countries. If India
has to emerge as the economic powerhouse in the 21
stcentury, India needs to improve its position
significantly in the arena of high technology trade. Between the years 1995 and 2006, India’s share in
global high technology trade has increased marginally from 0.14 percentage points to 0.23 percentage
points. India lacks far behind China in capturing global market place. This is not surprising giving the
fact the India’s share of high technology export in total manufactured exports has hardly changed
between the years 1995 and 2004.
5
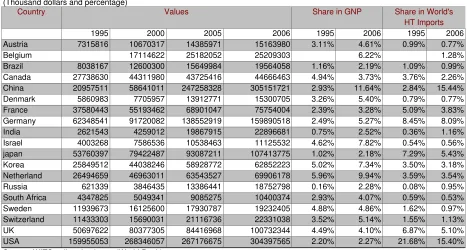
The statistics on high technology imports are shown in Table 2-2. With the opening up of the
economy and easing of the embargo on high technology imports, India seems to have improved its
position between the years 1995 and 2006. India’s import of high technology trade has jumped from US
$ 2621 millions in 1995 to US $ 23 billions in 2006. This corresponds to a share of 1.16 percent in
world’s high technology imports in 2006 as compared to a paltry share of 0.36 percent in 1995.
However, its share in GNP is still small compared to other emerging / developed economies or BRIC
member countries.
2.2
Product Trade
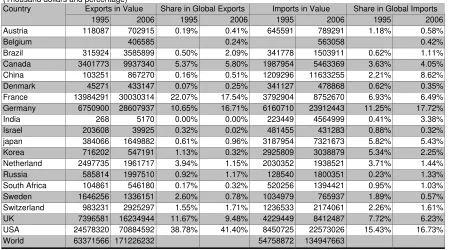
We have seen above that India occupies an insignificant position in the global space of high
technology export. A principal reason for the same is that in some of the product segment of high
technology trade, India is virtually absent (Table 2-3). For instance, take the case of aerospace
instruments. India exported only US $ 5 millions in 2006, whereas a country like Israel exported US $
39 millions, Korea US $ 547 millions, Brazil US $3585 millions. Only in this product segment, China’s
performance is relatively poor- it exported only US $ 867 millions, capturing less than 1-percentage
points of the global export basket. The four countries –USA, UK, France and Germany- control about
80 percent of the world exports in aerospace equipments.
The growth of domestic airline in India has expectedly pushed up the demand of aerospace
equipments. Between 1995 and 2006, India’s imports of the same increased from US $223 millions to
US $ 4.5 billions (Table 2-3). As a result, the share in global imports rose to 3.4 percent in 2006. Except
China, its share in global imports is the highest among the developing countries.
On the other hand, India exhibits a better presence in the global market of trade in computer
office equipments (Table 2-4). India exported US $ 275 millions and imported US 3760 millions of
computer office equipments in 2006. Except China, India compares favourably with respect to other
BRIC countries. Among the selected developing countries, India ranks high in respect of global import
in this product category signifying the deepening of the IT spreads in the Indian economy.
higher than some of the OECD countries like Japan, Canada. In fact, the divide between India and China
is not too wide only in this
product category. By contrast, India’s share of global import in this
category stands at less than 1 percent in 2006. To some extent, the low figure could be ascribed to the
restriction of imports to India by developed countries due to IPR issues.
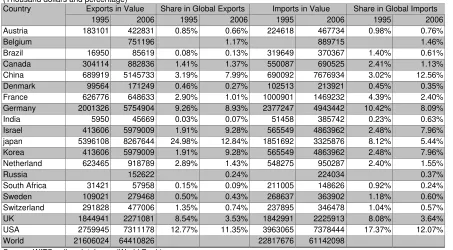
The low level of trade (imports and exports) in scientific instruments by India is a cause for
concern. This probably portrays the state of scientific research in India. While the share of China in
global imports of scientific instruments stood at 24 percent in 2006 after rising from 3.5 percent in 1995,
the share of the same for India has risen merely from 0.83 percent in 1995 to 1.05 percent in 2006 (Table
2-7). India exported only US $ 563 millions of instrument in 2006, whereas a country like Israel
exported nearly US $ 2 billions in 2006.
India’s performance is dismal in the product category
Electrical Machinery.
As Table 2-8
indicates, India exported and imported good amounting to US $ 45 million and US $ 385 millions
respectively in 2006. Among the BRIC countries, India’s position is the lowest in this category.
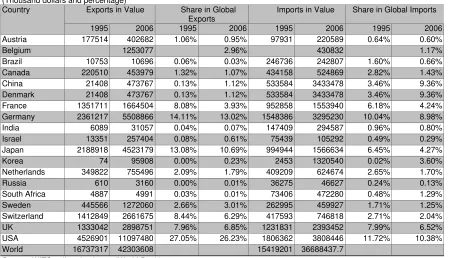
The similar trend is also observed in the product category
Non-electrical Machinery
(Table
2-9). In 2006, India exported US $ 310 million and imported US $ 294 millions. There has not been any
significant change in the shares of imports/export in the global trade over the 10 years period
1995-2006.
With regard to high technology trade in chemicals product category, India’s position is
relatively better and has significantly improved between the years 1995 and 2006 (Table 2-10). India has
a share of 2.41 percent in global high technology exports in this category, which is higher than many of
the selected countries. India exported about US $ 1032 millions in 2006 and its imports amounted to
only US $ 376 million. There has been a significant increase in export between the years under
observations. In recent years, the stricter environmental regulations in the developed countries have led
to a shift in the production base of the chemical industries to a developing country like India. To some
extent, this has contributed to this trend.
3.
Knowledge Intensive Service Trade
The last section has revealed that India plays a minor role in the global market of high technology
manufacturing trade. In the last two decades, the service sector has been growing faster than the
manufacturing sector and is driving economic activity around the world. So, it is more important that
India should stand on a strong footing in the knowledge intensive service category. The general
impression is that India has performed relatively well in this category among the emerging countries.
This section makes an attempt to analyse the same with a view to identify the components where India
has improved her performance and where India needs to tighten her belt.
3.1
Aggregate Picture
Table 3-1 and Table 3-2 portray the salient features of India’s commercial trade (exports and imports) in
recent years. As Table 3-1 shows, India’s commercial exports has more than doubled between the years
1995 and 2006. The share of India in world exports of commercial services stands at 0.64 percent in
2006, which is even higher than that of China, Korea, Israel, South Africa. The category commercial
services include transportation as well as travel, which is not strictly a knowledge intensive service
industry. As this table shows, the share of computer, communication and other services in commercial
service exports of India, which basically represent knowledge intensive service industry, stands at 74
percent in 2006. Thus, it indicates that India has been fairly successful in the global market of
knowledge intensive service industries. India’s position is the highest among the BRIC countries in this
category.
With regard to commercial service imports, India’s share in the global market is to the tune of
0.59 percent 2006, up by 0.19 percentage points from 1995 (Table 3-2) The share of import in GNP is
about 1.26 percent in 2006, which is significantly higher than that of China.
3.2
Product Approach
The knowledge intensive service sector (commercial service except transportation and travel services)
has several components. The principal among them are communication services, insurance services,
financial services, computer and information services, royalties and licenses fees, construction services,
personal cultural and recreational services, and other business services. Below, we have made an attempt
to analyse India’s performance in the various components wherever available data are available.
association between royalties payments/receipts and high technology exports.
6Thus, unless India scores
well in this category, it is unlikely that India can improve her position in respect of high technology
trade.
The relationship between royalties and trade is explored further in Table 3-4. As this table
indicates, the share of royalties’ receipts or payments in total trade is significantly lower compared to the
share of same vis-à-vis total high technology trade for the selected countries. This further confirms that
India needs to improve her position vis-à-vis royalties’ receipts/payments to establish herself as a major
player in the area of high technology trade.
Table 3-5 provides status on communication services. Note that India’s rank is four in respect
of exports and seven in respect of imports in the year 2005, the latest year for which data is available.
With respect to insurance services, India’s rank with respect to exports and imports are
respectively 7 and 6 out of 15 major economies in the year 2006 (Table 3-6).
Like in the case of insurance services, India is late entrant in the global market of financial
services. Only recently, India has opened up somewhat its financial services. India exported US $ 1468
millions worth of financial services in 2006 (Table 3-7). Its imports of the same amounted to US $ 1027
millions in 2006.
Among the commercial services, India is a predominant player in the area of computer and
information services. This is the segment where out IT industry is concentrated. It is not surprising that
India exported US $ 16 billion in 2006 capturing 16 percent of the trade share of the 15 large economies
(Table 3-8). Its position is way above China and is next only to EU. Its imports in this category are only
US $ 1.4 billions.
4.
Concluding Remarks
By and large, India’s performance on the high technology manufacturing trade front is not too
impressive. Unlike China or Brazil, India is a small player in most of the product categories barring
pharmacy sector. In the last ten years period of observation, India has not able increase her presence
significantly in most of the segment. By contrast, China, starting from the similar base like India in
some of the segments, has exhibited marked improvement. Since pharmacy is one sector where India is
doing well, it would make sense to nurture this sector. It is also surprising that India, with a large
scientific base, occupies such a small share in respect of trade in scientific instruments. As out analysis
indicates that there is a direct link between royalties and high technology trade, it is important to
encourage this segment.
Our analysis indicates that India has performed relatively well in the knowledge intensive
service industries. However, this has happened primarily due to the significant growth of the area of
computer and information services. However in the coming years, the other segments like financial
6
services, insurance services, health services, entertainment services are more likely to grow at a rapid
pace. If India is to emerge as an important player in the knowledge intensive service industries, we need
to improve our presence in these segments. At present, we are small players in these categories.
References
Chadha, Pohit, Deardorff and Stern (1998)
The Impact of Trade and Domestic Policy Reforms in India:
A CGE Modelling Approach
, published by Michigan University Press, USA.
Government of India (2009) “Economic Survey,” Delhi, India.
Table 2-1 High Technology Exports
(Thousand dollars and percentage)
Country Values Share in GNP Share in World's HT
Exports
Share of HT Export
in Manufactured Export
1995 2000 2005 2006 1995 2006 1995 2006 1995 2006
Austria 5073163 8305046 13485424 14715349 2.15% 4.47% 0.68% 0.75% 8.63% 13.07%
Belgium 15120654 23724365 23530587 5.80% 1.20% 0.00% 0.08%
Brazil 1064786 6070929 8059255 8672636 0.15% 0.97% 0.14% 0.44% 4.85% 0.12%
Canada 18120670 33878710 30475770 33183716 3.23% 2.77% 2.42% 1.69% 15.07% 0.15%
China 11885166 45254619 236830247 307379509 1.66% 11.73% 1.59% 15.64% 10.04% 0.30%
Denmark 5051999 7382237 13093766 13207372 2.81% 4.66% 0.68% 0.67% 15.20% 0.20%
France 43532092 61249366 74710764 85555176 2.77% 3.71% 5.82% 4.35% 18.72% 0.21%
Germany 61640615 88074855 154353040 176504667 2.46% 5.82% 8.24% 8.98% 12.90% 0.17%
India 1021961 1771447 3638016 4463637 0.29% 0.49% 0.14% 0.23% 4.31%
Israel 3298579 8598393 8431932 11796918 3.80% 8.30% 0.44% 0.60% 15.83% 0.14%
japan 120595526 139084972 147924770 155180995 2.30% 3.14% 16.12% 7.90% 26.13% 0.22%
Korea 32827608 59957306 106552922 120921668 6.37% 14.12% 4.39% 6.15% 25.87% 0.32%
Netherlands 27835371 46039075 70285424 73997556 6.27% 10.52% 3.72% 3.77% 23.82% 0.28%
Russia 1125504 2891669 4071405 4505480 0.29% 0.55% 0.15% 0.23% 0.00% 0.09%
South Africa 722424 1052499 1887499 1949254 0.49% 0.76% 0.10% 0.10% 5.67% 0.06%
Sweden 14265223 21790583 24156307 25936063 5.83% 6.56% 1.91% 1.32% 16.08%
Switzerland 11757680 15458030 28528739 31562257 3.62% 7.26% 1.57% 1.61% 13.91% 0.16%
UK 57297893 76858298 89429159 123771987 5.07% 5.04% 7.66% 6.30% 27.34% 0.34%
USA 162040639 248753920 257306150 293677732 2.23% 2.19% 21.67% 14.95% 32.80% 0.30%
Table 2-2 High Technology Imports
(Thousand dollars and percentage)
Country Values Share in GNP Share in World's
HT Imports
1995 2000 2005 2006 1995 2006 1995 2006
Austria 7315816 10670317 14385971 15163980 3.11% 4.61% 0.99% 0.77%
Belgium 17114622 25182052 25209303 6.22% 1.28%
Brazil 8038167 12600300 15649984 19564058 1.16% 2.19% 1.09% 0.99%
Canada 27738630 44311980 43725416 44666463 4.94% 3.73% 3.76% 2.26%
China 20957511 58641011 247258328 305151721 2.93% 11.64% 2.84% 15.44%
Denmark 5860983 7705957 13912771 15300705 3.26% 5.40% 0.79% 0.77%
France 37580443 55193462 68901047 75754004 2.39% 3.28% 5.09% 3.83%
Germany 62348541 91720082 138552919 159890518 2.49% 5.27% 8.45% 8.09%
India 2621543 4259012 19867915 22896681 0.75% 2.52% 0.36% 1.16%
Israel 4003268 7586536 10538463 11125532 4.62% 7.82% 0.54% 0.56%
japan 53760397 79422487 93087211 107413775 1.02% 2.18% 7.29% 5.43%
Korea 25849512 44038246 58928772 62852223 5.02% 7.34% 3.50% 3.18%
Netherland 26494659 46963011 63543527 69906178 5.96% 9.94% 3.59% 3.54%
Russia 621339 3846435 13386441 18752798 0.16% 2.28% 0.08% 0.95%
South Africa 4347825 5049341 9085275 10400374 2.93% 4.07% 0.59% 0.53%
Sweden 11939673 16125600 17930787 19232405 4.88% 4.86% 1.62% 0.97%
Switzerland 11433303 15690031 21116736 22331038 3.52% 5.14% 1.55% 1.13%
UK 50697622 80377305 84416968 100732344 4.49% 4.10% 6.87% 5.10%
USA 159955053 268346057 267176675 304397565 2.20% 2.27% 21.68% 15.40%
Table 2-3 Trade in Aerospace Equipment: Stylized Facts
(Thousand dollars and percentage)
Country Exports in Value Share in Global Exports Imports in Value Share in Global Imports
1995 2006 1995 2006 1995 2006 1995 2006
Austria 118087 702915 0.19% 0.41% 645591 789291 1.18% 0.58%
Belgium 406585 0.24% 563058 0.42%
Brazil 315924 3585899 0.50% 2.09% 341778 1503911 0.62% 1.11%
Canada 3401773 9937340 5.37% 5.80% 1987954 5463369 3.63% 4.05%
China 103251 867270 0.16% 0.51% 1209296 11633255 2.21% 8.62%
Denmark 45271 433147 0.07% 0.25% 341127 478868 0.62% 0.35%
France 13984291 30030314 22.07% 17.54% 3792904 8752670 6.93% 6.49%
Germany 6750900 28607937 10.65% 16.71% 6160710 23912443 11.25% 17.72%
India 268 5170 0.00% 0.00% 223449 4564999 0.41% 3.38%
Israel 203608 39925 0.32% 0.02% 481455 431283 0.88% 0.32%
japan 384066 1649882 0.61% 0.96% 3187954 7321673 5.82% 5.43%
Korea 716202 547191 1.13% 0.32% 2925809 3038879 5.34% 2.25%
Netherland 2497735 1961717 3.94% 1.15% 2030352 1938521 3.71% 1.44%
Russia 585814 1997510 0.92% 1.17% 128540 1800351 0.23% 1.33%
South Africa 104861 546180 0.17% 0.32% 520256 1394421 0.95% 1.03%
Sweden 1646256 1336151 2.60% 0.78% 1034979 765937 1.89% 0.57%
Switzerland 983231 2925297 1.55% 1.71% 1236533 2174061 2.26% 1.61%
UK 7396581 16234944 11.67% 9.48% 4229449 8412487 7.72% 6.23%
USA 24578320 70884592 38.78% 41.40% 8450725 22573026 15.43% 16.73%
World 63371566 171226232 54758872 134947663
Table 2-4 Trade in Computer Office Machines: Stylized Facts
(Thousand dollars and percentage)
Country Exports in Value Share in Global Exports Imports in Value Share in Global Imports
1995 2006 1995 2006 1995 2006 1995 2006
Austria 684362 1297284 0.32% 0.28% 1848003 2952748 0.85% 0.63%
Belgium 4468038 0.95% 5234844 1.11%
Brazil 177396 344431 0.08% 0.07% 1344256 2333641 0.61% 0.49%
Canada 5338519 3049406 2.46% 0.65% 7892812 10668300 3.61% 2.26%
China -116228 102492625 -0.05% 21.78% 2023475 36696766 0.93% 7.77%
Denmark 753822 1168237 0.35% 0.25% 1956387 3317488 0.89% 0.70%
France 7512337 6835280 3.46% 1.45% 10841612 15850010 4.96% 3.36%
Germany 11311722 27469541 5.21% 5.84% 19478666 37536070 8.91% 7.95%
India 183641 275831 0.08% 0.06% 308515 3760289 0.14% 0.80%
Israel 115132 362957 0.05% 0.08% 489452 1352063 0.22% 0.29%
japan 31581613 21881486 14.56% 4.65% 14924193 22964624 6.83% 4.86%
Korea 4683879 17277196 2.16% 3.67% 3032086 4481394 1.39% 0.95%
Netherland 11486925 33048791 5.30% 7.02% 12052750 33282149 5.51% 7.05%
Russia 90998 0.02% 2523488 0.53%
South Africa 70621 221003 0.03% 0.05% 1128102 2331862 0.52% 0.49%
Sweden 706655 1533016 0.33% 0.33% 3141112 4570746 1.44% 0.97%
Switzerland 765633 471268 0.35% 0.10% 3509455 3528644 1.61% 0.75%
UK 16331587 17165196 7.53% 3.65% 16455483 24213662 7.53% 5.13%
USA 36718777 40369569 16.93% 8.58% 56895839 95038518 26.02% 20.13%
World 216907512 470641085 218643302 472219506
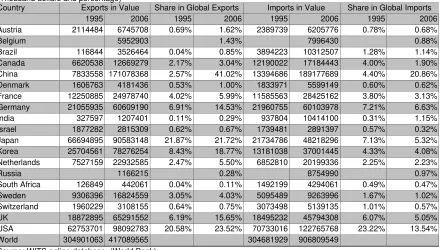
Table 2-5 Trade in Electronic Telecommunications Equipment: Stylized Facts
(Thousand dollars and percentage)
Country
Exports in Value Share in Global Exports Imports in Value Share in Global Imports
1995 2006 1995 2006 1995 2006 1995 2006
Austria 2114484 6745708 0.69% 1.62% 2389739 6205776 0.78% 0.68%
Belgium 5952903 1.43% 7996430 0.88%
Brazil 116844 3526464 0.04% 0.85% 3894223 10312507 1.28% 1.14%
Canada 6620538 12669279 2.17% 3.04% 12190022 17184443 4.00% 1.90%
China 7833558 171078368 2.57% 41.02% 13394686 189177689 4.40% 20.86%
Denmark 1606763 4181436 0.53% 1.00% 1833971 5599149 0.60% 0.62%
France 12250885 24978740 4.02% 5.99% 11585563 28425162 3.80% 3.13%
Germany 21055935 60609190 6.91% 14.53% 21960755 60103978 7.21% 6.63%
India 327597 1207401 0.11% 0.29% 937804 10414100 0.31% 1.15%
Israel 1877282 2815309 0.62% 0.67% 1739481 2891397 0.57% 0.32%
Japan 66694895 90583148 21.87% 21.72% 21734786 48218296 7.13% 5.32%
Korea 25704561 78276254 8.43% 18.77% 13181038 37001445 4.33% 4.08%
Netherlands 7527159 22932585 2.47% 5.50% 6852810 20199336 2.25% 2.23%
Russia 1166215 0.28% 8754990 0.97%
South Africa 126849 442061 0.04% 0.11% 1492199 4294061 0.49% 0.47%
Sweden 9306396 16824559 3.05% 4.03% 5095489 9263996 1.67% 1.02%
Switzerland 1960229 3108155 0.64% 0.75% 3073498 5139135 1.01% 0.57%
UK 18872895 65291552 6.19% 15.65% 18495232 45794308 6.07% 5.05%
USA 62753701 98092783 20.58% 23.52% 70733016 122765768 23.22% 13.54%
World 304901063 417089565 304681929 906809549
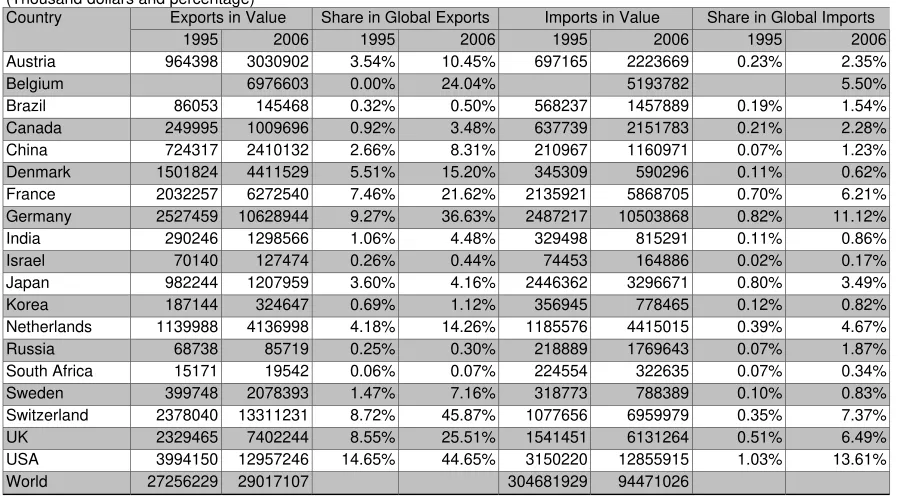
Table 2-6 Trade in Pharmacy: Stylized Facts
(Thousand dollars and percentage)
Country Exports in Value Share in Global Exports Imports in Value Share in Global Imports
1995 2006 1995 2006 1995 2006 1995 2006
Austria 964398 3030902 3.54% 10.45% 697165 2223669 0.23% 2.35%
Belgium 6976603 0.00% 24.04% 5193782 5.50%
Brazil 86053 145468 0.32% 0.50% 568237 1457889 0.19% 1.54%
Canada 249995 1009696 0.92% 3.48% 637739 2151783 0.21% 2.28%
China 724317 2410132 2.66% 8.31% 210967 1160971 0.07% 1.23%
Denmark 1501824 4411529 5.51% 15.20% 345309 590296 0.11% 0.62%
France 2032257 6272540 7.46% 21.62% 2135921 5868705 0.70% 6.21%
Germany 2527459 10628944 9.27% 36.63% 2487217 10503868 0.82% 11.12%
India 290246 1298566 1.06% 4.48% 329498 815291 0.11% 0.86%
Israel 70140 127474 0.26% 0.44% 74453 164886 0.02% 0.17%
Japan 982244 1207959 3.60% 4.16% 2446362 3296671 0.80% 3.49%
Korea 187144 324647 0.69% 1.12% 356945 778465 0.12% 0.82%
Netherlands 1139988 4136998 4.18% 14.26% 1185576 4415015 0.39% 4.67%
Russia 68738 85719 0.25% 0.30% 218889 1769643 0.07% 1.87%
South Africa 15171 19542 0.06% 0.07% 224554 322635 0.07% 0.34%
Sweden 399748 2078393 1.47% 7.16% 318773 788389 0.10% 0.83%
Switzerland 2378040 13311231 8.72% 45.87% 1077656 6959979 0.35% 7.37%
UK 2329465 7402244 8.55% 25.51% 1541451 6131264 0.51% 6.49%
USA 3994150 12957246 14.65% 44.65% 3150220 12855915 1.03% 13.61%
World 27256229 29017107 304681929 94471026
Table 2-7 Trade in Scientific Instruments: Stylized Facts
(Thousand dollars and percentage)
Country Exports in Value Share in Global Exports Imports in Value Share in Global Imports
1995 2006 1995 2006 1995 2006 1995 2006
Austria 766080 1899630 1.12% 0.88% 1085643 1946297 1.64% 0.90%
Belgium 1988513 0.92% 2922986 1.35%
Brazil 96980 335343 0.14% 0.16% 992851 2746276 1.50% 1.27%
Canada 1286323 4051816 1.87% 1.88% 3383680 6557434 5.11% 3.02%
China 1320713 20508092 1.92% 9.52% 2327955 53593011 3.51% 24.71%
Denmark 989500 2182269 1.44% 1.01% 554351 1306754 0.84% 0.60%
France 4269057 10499341 6.22% 4.87% 4589730 9779866 6.93% 4.51%
Germany 12861005 33159994 18.74% 15.39% 6685922 15872843 10.09% 7.32%
India 47619 563407 0.07% 0.26% 546746 2282542 0.83% 1.05%
Israel 492679 1707195 0.72% 0.79% 472290 1165202 0.71% 0.54%
Japan 12480609 25475418 18.18% 11.82% 5733091 16489749 8.65% 7.60%
Korea 948096 17112604 1.38% 7.94% 4414255 9973989 6.66% 4.60%
Netherlands 3037103 7784830 4.42% 3.61% 2608719 6678419 3.94% 3.08%
Russia 667380 0.31% 2622074 0.00% 1.21%
South Africa 72266 197697 0.11% 0.09% 568805 1207848 0.86% 0.56%
Sweden 1562673 2472957 2.28% 1.15% 1404434 2382120 2.12% 1.10%
Switzerland 3157445 7581627 4.60% 3.52% 1485842 2811843 2.24% 1.30%
UK 6010485 10932673 8.76% 5.07% 5083435 9249487 7.67% 4.27%
USA 19188169 42879818 27.95% 19.90% 12071941 30958873 18.22% 14.28%
World 68642358 215463469 66252766 216850415
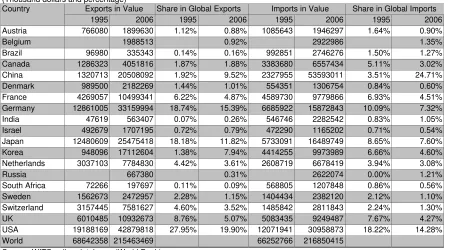
Table 2-8 Trade in Electrical Machinery: Stylized Facts
(Thousand dollars and percentage)
Country Exports in Value Share in Global Exports Imports in Value Share in Global Imports
1995 2006 1995 2006 1995 2006 1995 2006
Austria 183101 422831 0.85% 0.66% 224618 467734 0.98% 0.76%
Belgium 751196 1.17% 889715 1.46%
Brazil 16950 85619 0.08% 0.13% 319649 370367 1.40% 0.61%
Canada 304114 882836 1.41% 1.37% 550087 690525 2.41% 1.13%
China 689919 5145733 3.19% 7.99% 690092 7676934 3.02% 12.56%
Denmark 99564 171249 0.46% 0.27% 102513 213921 0.45% 0.35%
France 626776 648633 2.90% 1.01% 1000901 1469232 4.39% 2.40%
Germany 2001326 5754904 9.26% 8.93% 2377247 4943442 10.42% 8.09%
India 5950 45669 0.03% 0.07% 51458 385742 0.23% 0.63%
Israel 413606 5979009 1.91% 9.28% 565549 4863962 2.48% 7.96%
japan 5396108 8267644 24.98% 12.84% 1851692 3325876 8.12% 5.44%
Korea 413606 5979009 1.91% 9.28% 565549 4863962 2.48% 7.96%
Netherland 623465 918789 2.89% 1.43% 548275 950287 2.40% 1.55%
Russia 152622 0.24% 224034 0.37%
South Africa 31421 57958 0.15% 0.09% 211005 148626 0.92% 0.24%
Sweden 109021 279468 0.50% 0.43% 268637 363902 1.18% 0.60%
Switzerland 291828 477006 1.35% 0.74% 237895 346478 1.04% 0.57%
UK 1844941 2271081 8.54% 3.53% 1842991 2225913 8.08% 3.64%
USA 2759945 7311178 12.77% 11.35% 3963065 7378444 17.37% 12.07%
World 21606024 64410826 22817676 61142098
Table 2-9 Trade in Non-electrical Machinery: Stylized Facts
(Thousand dollars and percentage)
Country Exports in Value Share in Global
Exports
Imports in Value Share in Global Imports
1995 2006 1995 2006 1995 2006 1995 2006
Austria 177514 402682 1.06% 0.95% 97931 220589 0.64% 0.60%
Belgium 1253077 2.96% 430832 1.17%
Brazil 10753 10696 0.06% 0.03% 246736 242807 1.60% 0.66%
Canada 220510 453979 1.32% 1.07% 434158 524869 2.82% 1.43%
China 21408 473767 0.13% 1.12% 533584 3433478 3.46% 9.36%
Denmark 21408 473767 0.13% 1.12% 533584 3433478 3.46% 9.36%
France 1351711 1664504 8.08% 3.93% 952858 1553940 6.18% 4.24%
Germany 2361217 5508866 14.11% 13.02% 1548386 3295230 10.04% 8.98%
India 6089 31057 0.04% 0.07% 147409 294587 0.96% 0.80%
Israel 13351 257404 0.08% 0.61% 75439 105292 0.49% 0.29%
Japan 2188918 4523179 13.08% 10.69% 994944 1566634 6.45% 4.27%
Korea 74 95908 0.00% 0.23% 2453 1320540 0.02% 3.60%
Netherlands 349822 755496 2.09% 1.79% 409209 624674 2.65% 1.70%
Russia 610 3160 0.00% 0.01% 36275 46627 0.24% 0.13%
South Africa 4887 4991 0.03% 0.01% 73406 472280 0.48% 1.29%
Sweden 445566 1272060 2.66% 3.01% 262995 459927 1.71% 1.25%
Switzerland 1412849 2661675 8.44% 6.29% 417593 746818 2.71% 2.04%
UK 1333042 2898751 7.96% 6.85% 1231831 2393452 7.99% 6.52%
USA 4526901 11097480 27.05% 26.23% 1806362 3808446 11.72% 10.38%
World 16737317 42303608 15419201 36688437.7
Table 2-10 Trade in Chemistry: Stylized Facts
(Thousand dollars and percentage)
Country Exports in Value Share in Global Exports Imports in Value Share in Global Imports
1995 2006 1995 2006 1995 2006 1995 2006
Austria 32608 174872 0.16% 0.41% 298100 324118 1.37% 0.69%
Belgium 1667673 3.89% 1934960 4.13%
Brazil 167466 506171 0.81% 1.18% 326500 582260 1.50% 1.24%
Canada 326500 582260 1.57% 1.36% 312442 921135 1.44% 1.97%
China 1281946 4364805 6.18% 10.18% 566280 1777543 2.61% 3.80%
Denmark 24693 151187 0.12% 0.35% 176340 229880 0.81% 0.49%
France 1356769 4229369 6.54% 9.87% 2570426 3909798 11.84% 8.35%
Germany 2498919 4387025 12.05% 10.23% 1482105 3598257 6.83% 7.68%
India 160225 1032173 0.77% 2.41% 76165 375916 0.35% 0.80%
Israel 110429 505904 0.53% 1.18% 105149 151447 0.48% 0.32%
Japan
Korea 125546 1183552 0.61% 2.76% 411682 1083862 1.90% 2.31%
Netherlands 996574 2431826 4.80% 5.67% 679126 1639079 3.13% 3.50%
Russia 470342 309712 2.27% 0.72% 237636 999893 1.09% 2.14%
South Africa 291524 459821 1.41% 1.07% 129499 228641 0.60% 0.49%
Sweden 63624 82419 0.31% 0.19% 375432 603773 1.73% 1.29%
Switzerland 740750 780384 3.57% 1.82% 241090 365193 1.11% 0.78%
UK 1996915 1422291 9.63% 3.32% 1281597 2147771 5.90% 4.59%
USA 3212498 6294093 15.49% 14.68% 2161109 6727798 9.95% 14.37%
World 20743063 42863482 21715194 46823614
Table 2-11 Trade in Armaments: Stylized Facts
(Thousand dollars and percentage)
Country Exports in Value Share in Global
Exports
Imports in Value Share in Global Imports
1995 2006 1995 2006 1995 2006 1995 2006
Austria 32530 38525 0.42% 0.47% 29025 33757 0.62% 0.49%
Belgium 65999 0.80% 42696 0.62%
Brazil 76421 132544 0.99% 1.61% 3937 14400 0.08% 0.21%
Canada 372397 547106 4.81% 6.64% 349735 504605 7.53% 7.28%
China 26282 38718 0.34% 0.47% 1176 2073 0.03% 0.03%
Denmark 9154 34551 0.12% 0.42% 17400 130871 0.37% 1.89%
France 148007 396455 1.91% 4.81% 110529 144620 2.38% 2.09%
Germany 272133 378266 3.51% 4.59% 167534 124387 3.61% 1.79%
India 325 4363 0.00% 0.05% 498 3214 0.01% 0.05%
Israel 2352 1741 0.03% 0.02% 0.00% 0.00%
Japan 90296 83596 1.17% 1.01% 346807 167803 7.46% 2.42%
Korea 48499 125307 0.63% 1.52% 959695 309688 20.65% 4.47%
Netherlands 176601 26524 2.28% 0.32% 127841 178697 2.75% 2.58%
Russia 32164 0.39% 11699 0.17%
South Africa 4822 0.06% 0.00% 0.00%
Sweden 25283 57040 0.33% 0.69% 37821 33615 0.81% 0.48%
Switzerland 67676 245614 0.87% 2.98% 153741 258886 3.31% 3.73%
UK 1181982 153256 15.26% 1.86% 536152 164000 11.54% 2.36%
USA 4308178 3790974 55.61% 45.99% 722776 2290776 15.55% 33.03%
World 7746485.9 8242739.2 4646977.9 6935586.39
Table 3-1 Export of Commercial Services: Stylized Facts
(Thousand dollars and percentage)
Country Exports in Value Share in Global exports Share of computer,
communication & other services In commercial
services export
Share of export in GNP
1995 2000 2005 2006 1995 2006 1995 2006 1995 2006
Austria 16075862 19412582 30378278 32439095 1.74% 1.58% 41.89% 6.83% 9.85%
Belgium 31691546 31060081 53104305 45201794 3.43% 2.20% 38.43% 46.86% 10.96% 11.15%
Brazil 33619402 48556217 54091706 57285410 3.64% 2.79% 23.65% 50.87% 4.85% 6.42%
Canada 6005000 8960929 14855652 17945691 0.65% 0.87% 36.81% 46.77% 1.07% 1.50%
China 3248900 3994516 6925654 7406132 0.35% 0.36% 24.39% 39.12% 0.45% 0.28%
Denmark 6637583 6751098 11713775 13296397 0.72% 0.65% 31.03% 3.69% 4.69%
France 8262000 9687000 14448700 15833700 0.90% 0.77% 36.90% 36.27% 0.53% 0.69%
Germany 83108129 79901145 117904018 117585668 9.01% 5.72% 43.50% 48.34% 3.32% 3.88%
India 5085883 5835813 12652407 13191218 0.55% 0.64% 31.36% 73.69% 1.45% 1.45%
Israel 5342000 5060709 12571367 11091109 0.58% 0.54% 35.09% 66.12% 6.16% 7.80%
Japan 7741200 14999200 17405500 19228700 0.84% 0.94% 58.84% 53.24% 0.15% 0.39%
Korea 1689308 1601693 2239069 2431594 0.18% 0.12% 34.45% 32.32% 0.33% 0.28%
Netherlands 2020436 2853561 7569562 9317934 0.22% 0.45% 43.73% 58.22% 0.45% 1.32%
Russia 8160690 8895533 15028391 17623800 0.88% 0.86% 22.78% 39.15% 2.08% 2.14%
South Africa 4414445 4888097 10898392 11712123 0.48% 0.57% 17.66% 12.73% 2.98% 4.59%
Sweden 40018791 52112190 93853021 105482884 4.34% 5.13% 42.73% 55.13% 16.35% 26.68%
Switzerland 149598 270559 274385 273717 0.02% 0.01% 19.53% 57.50% 0.05% 0.06%
UK 77549120 118567383 205824814 225867913 8.40% 10.99% 35.36% 45.35% 6.87% 9.20%
USA 198501000 278086289 361600000 397832692 21.51% 19.35% 35.48% 44.30% 2.73% 2.97%
World 922762282 1169183750 1866875500 2055523332
Table 3-2 Import of Commercial Services: Stylized Facts
(Thousand dollars and percentage)
Country Imports in Value Share in Global
imports
Share of import in GNP
1995 2000 2005 2006 1995 2006 1995 2006
Austria 16979448 43618131 29909157 31631251 1.80% 1.64% 7.21% 9.61%
Belgium 27551776 2430730 49001520 32398293 2.93% 1.68% 9.52% 7.99%
Brazil 32510816 1781365 50408326 52285184 3.46% 2.71% 4.69% 5.86%
Canada 13161000 6906000 22408857 27149220 1.40% 1.41% 2.34% 2.27%
China 3524000 6339117 7521848 8289194 0.37% 0.43% 0.49% 0.32%
Denmark 4859907 22353750 10109761 11726144 0.52% 0.61% 2.70% 4.14%
France 4511000 17111895 9507400 10288200 0.48% 0.53% 0.29% 0.45%
Germany 64522653 18628634 104600383 106949462 6.86% 5.54% 2.58% 3.53%
India 3765479 129227000 11292501 11485473 0.40% 0.59% 1.07% 1.26%
Israel 13230000 16075862 21836469 21406108 1.41% 1.11% 15.26% 15.05%
Japan 8133800 31691546 13492900 14703500 0.86% 0.76% 0.15% 0.30%
Korea 1384615 6005000 2464880 2595628 0.15% 0.13% 0.27% 0.30%
Netherlands 1349846 1640987 3103033 3568427 0.14% 0.18% 0.30% 0.51%
Russia 6339117 9528000 10298570 11313582 0.67% 0.59% 1.62% 1.38%
South Africa 5756013 6763272 11862972 13948881 0.61% 0.72% 3.88% 5.46%
Sweden 22353750 5342000 66738885 77901734 2.38% 4.03% 9.14% 19.70%
Switzerland 206046 7741200 400638 359942 0.02% 0.02% 0.06% 0.08%
UK 62523950 11438250 160096055 170961744 6.64% 8.85% 5.54% 6.96%
USA 129227000 9584800 282211900 308348714 13.73% 15.97% 1.78% 2.30%
World 940944900 1158177516 1773438615 1930703481
Table 3-3 Royalties receipts and Payment
(Thousand dollars and percentage)
Country Receipts in Value Payments in Value Share in Global
receipts
Share in Global payments
1995 2006 1995 2006 1995 2006 1995 2006
Austria 234342 621196 947022 2221038 0.44% 0.49% 2.08% 2.02%
Belgium 133373 0 532774 0 0.25% 0.00% 1.17% 0.00%
Brazil 581769 1543583 1157879 1075460 1.10% 1.21% 2.55% 0.98%
Canada 32000 150307 529000 1663677 0.06% 0.12% 1.16% 1.51%
China 1900 55203 50000 381329 0.00% 0.04% 0.11% 0.35%
Denmark 13182 30912 53328 525978 0.02% 0.02% 0.12% 0.48%
France 47000 138000 97000 159200 0.09% 0.11% 0.21% 0.14%
Germany 1850021 6230102 2320298 3298020 3.50% 4.89% 5.10% 2.99%
India 31698 626904 69995 1056350 0.06% 0.49% 0.15% 0.96%
Israel 0 13503 0 869697 0.00% 0.01% 0.00% 0.79%
Japan 134500 596300 155600 678700 0.25% 0.47% 0.34% 0.62%
Korea 0 0 0 0 0.00% 0.00% 0.00% 0.00%
Netherlands 2927 4779 125055 47906 0.01% 0.00% 0.28% 0.04%
Russia 19243 81648 236796 348824 0.04% 0.06% 0.52% 0.32%
South Africa 44672 45784 293135 1282025 0.08% 0.04% 0.64% 1.16%
Sweden 196073 921983 1266226 2503615 0.37% 0.72% 2.79% 2.27%
Switzerland 888603 3 1004151 105824 1.68% 0.00% 2.21% 0.10%
UK 6080094 13588024 5198358 9962437 11.49% 10.66% 11.43% 9.04%
USA 30289000 62378000 6919000 26433000 57.25% 48.94% 15.22% 24.00%
World 52908282 127462717 45465570 110157569
Table 3-4 Stylized Facts on Royalties, Trade, year 2006
Country
Royalties receipts as percent of
Royalties payments as percent of
Total HT Trade
Total Trade
Total HT Trade
Total Trade
Austria
2.08
0.22
7.43
0.79
Brazil
5.47
0.66
3.81
0.46
Canada
0.19
0.02
2.14
0.22
China
0.01
0.00
0.06
0.02
Denmark
0.11
0.02
1.85
0.29
France
0.09
0.01
0.10
0.02
Germany
1.85
0.31
0.98
0.16
India
2.29
0.21
3.86
0.36
Israel
0.06
0.01
3.79
0.90
Japan 0.23
0.05
0.26
0.06
Netherlands
0.00
0.00
0.03
0.01
Russia
0.35
0.02
1.50
0.07
South Africa
0.37
0.03
10.38
0.94
Sweden
2.04
0.34
5.54
0.91
Switzerland
0.00
0.00
0.20
0.04
UK
6.05
1.27
4.44
0.93
USA
10.43
2.11
4.42
0.90
Table 3-5 Major exporters and importers of communications services, 2005
(Million dollars and percentage)
Rank Exporters Value Share in 15
economies
Rank Importers Value Share in 15
economies
1 European Union (25) 29697 63.2 1 European Union (25) 29405 64.8
Extra-EU (25) exports 8592 18.3 Extra-EU (25) imports 9611 21.2
2 United States 5033 10.7 2 United States 5292 11.7
3 Canada 2171 4.6 3 Canada 2010 4.4
4 India a 1999 4.3 5 Switzerland 954 2.1
6 Switzerland 1156 2.5 7 Korea, Republic of 773 1.7
9 Russian Federation 658 1.4 8 Russian Federation 746 1.6
10 Australia 625 1.3 9 India a 715 1.6
11 Malaysia b 615 1.3 10 Malaysia b 680 1.5
13 Mexico b 548 1.2 11 Australia 625 1.4
14 Philippines 520 1.1 12 Japan 616 1.4
15 China 485 1 13 China 603 1.3
15 Indonesia 495 1.1
Source: WTO, International Trade Statistics, pp 133
Table 3-6 Major exporters and importers of insurance services, 2005
(Million dollars and percentage)
Rank Exporters Value Share in 15
economies
Rank Importers Value Share in 15
economies
1 European Union (25) 24349 52.70 1 United States 28482 32.10
Extra-EU (25) exports 7982 17.30 2 European Union (25) 26754 30.20
2 United States 6831 14.80 Extra-EU (25) imports 10208 11.50
3 Switzerland 4503 9.70 3 Mexico 8714 9.80
4 Canada 3211 6.90 4 China 7200 8.10
5 Mexico 1550 3.40 5 Canada 4591 5.20
7 India a 919 2.00 6 India a 2391 2.70
8 Japan 873 1.90 8 Japan 1894 2.10
9 China 549 1.20 9 Thailand 1656 1.90
10 Australia 530 1.10 11 Turkey 891 1.00
14 Russian Federation 323 0.70 12 Egypt 781 0.90
15 Turkey 323 0.70 13 Korea, Republic of 733 0.80
14 Brazil 702 0.80
[image:25.842.69.570.309.500.2]Table 3-7 Major exporters and importers of financial services, 2005
(Million dollars and percentage)
Rank Exporters Value Share in 15
economies
Rank Importers Value Share in 15
economies
1 European Union (25) 96001 58.3 1 European Union (25) 46721 62.9
Extra-EU (25) exports 44070 26.8 Extra-EU (25) imports 17709 23.8
2 United States 34081 20.7 2 United States 12349 16.6
3 Switzerland 10402 6.3 3 Japan 2687 3.6
5 Japan 5044 3.1 4 Canada 2356 3.2
7 Korea, Republic of 1651 1 8 India a 1227 1.7
8 Canada 1590 1 9 Switzerland 1023 1.4
10 India a 1468 0.9 10 Russian Federation 892 1.2
11 Australia 764 0.5 12 Brazil 737 1
13 South Africa 534 0.3 13 Mexico 550 0.7
14 Brazil 507 0.3 14 Indonesia 539 0.7
15 Russian Federation 390 0.2 15 Australia 408 0.5
Source: WTO, International Trade Statistics, pp 139
Table 3-8 Major exporters and importers of computer and information services, 2005
(Million dollars and percentage)
Rank Exporters Value Share in 15
economies
Rank Importers Value Share in 15
economies
1 European Union (25) 60233 60.30 1 European Union (25) 31580 58.40
Extra-EU (25) exports 21285 21.30 Extra-EU (25) imports 10745 19.90
2 India a 16091 16.10 2 United States 8969 16.60
3 United States 8239 8.20 3 Japan 2432 4.50
4 Israel b 4529 4.50 4 Canada 1792 3.30
5 Canada 3925 3.90 5 Brazil 1713 3.20
6 China 1840 1.80 6 China 1623 3.00
7 Japan 1126 1.10 7 India a 1498 2.80
9 Australia 886 0.90 9 Australia 802 1.50
11 Malaysia b 435 0.40 10 Indonesia 561 1.00
12 Russian Federation 422 0.40 11 Russian Federation 482 0.90
13 Malaysia b 379 0.70
[image:26.842.68.569.346.503.2]