Abstract
In the present work, a two-dimensional numerical model of heat and mass transfer for the convective drying process of multilayer ceramic mould system was developed. The governing system of fully coupled non-linear partial differential equations describing the process was derived from a mechanistic approach. A formulation including hygrothermal and moisture transport in soil was adopted as the basis for further development in this work. For validation, the calculation results for drying of a ceramic material (brick) showed that the model presented is in a good agreement with other studies that have been reported previously in the drying porous material. Further application is illustrated through the drying of a ceramic shell layer under conditions that are relevant to shell manufacture in the investment casting process.
Keywords: convective drying, multilayer ceramic mould system, heat and mass
transfer, hygrothermal, moisture transport, mechanistic approach.
1 Introduction
Production of investment casting shell moulds require more than one ceramic layer to be applied onto the wax pattern to form the shell mould body. The drying process which is need as each ceramic layer is built up, is one of the critical and important stages in producing a good quality ceramic shell mould[1]. In fact, layer drying has a direct impact on processing time and a number of layers are added in order to get sufficient strength[2, 3]. If the shell is re-dipped before being sufficiently dry, its strength is reduced and there is the possibility of cracking in multilayer assemblies[4]. Therefore, the duration of layer drying and the final drying rate (when a seal coat has been applied) play an important role in ensuring the optimum shell strength [2].
Paper
16
Drying of a Multilayer
Ceramic Shell Body
Z. Harun
1, D.T. Gethin
1, R.W. Lewis
1and W.J. Ferguson
21
Civil and Computational Engineering Centre
University of Wales, Swansea, United Kingdom
2
School of the Built Environment
Heriot-Watt University, Edinburgh, United Kingdom
©Civil-Comp Press, 2007.
Proceedings of the 15th UK Conference of the
Association of Computational Mechanics in Engineering, B.H.V. Topping (Editor),
In drying a multilayer shell body, theoretically the thermal, moisture and pressure gradient are dynamically created within the multilayer envelopes[5, 6]. Thus, the correct evaluation of these thermophysical variables is essential for accurately predicting the heat and moisture transport in order to establish the optimum drying conditions. Recently, computer aided numerical method such as the finite element method (FEM), the finite difference method (FDM) and the boundary element method (BEM) lead to solutions in predicting the porous material response. Most of the research on shell making that has been carried out previously has used an experimental approach. This includes the complication of measuring moisture content, temperature and drying rate that generally respond in a nonlinear manner. Furthermore most ceramic porous materials are very sensitive to any thermophysical change which leads to sudden changes[7] that are difficult to capture accurately in an experimental setting.
Multilayer shell systems are built with similar materials. Thus it may be assumed that there is no discontinuity between each layer and there is no interface to generate a contact resistance. This is due to the high absorption of water at the dipping part of the layering cycle leading to good wetting as layers are built up. This has been demonstrated by extensive works [3, 8] on assessing fluid uptake as the dry shell is immersed in slurry within the fabrication cycle. Eliminating consideration of this interface resistance simplifies the mathematical formulation and simulation of this layering influence [9].
With the above assumption and consideration, the most widely used coupled heat and mass transfer formulation in a porous material under a temperature gradient including gas transport was solved numerically in an iterative way, using the FEM. By using a mechanistic concept along with Darcy’s law in expressing the moisture flux and the Fick’s diffusion law, this enables simulation to capture variables such as saturation (moisture content), temperature and water pressure.
2 Theoretical Formulation
The theoretical formulation of the heat and mass balance equations used here is based on the work by Ben Nasrallah[10], Whitaker[11] and others[12-14]. Based on the above analysis, the governing equations of the model are expressed in terms of the chosen state variables; pore water pressure, Pl, gas pressure,Pg, and temperature,
T. The time derivative of moisture (liquid and vapour) transport as given below shows the gradient in liquid flux, the influence of a vapour pressure gradient and vapour bulk flow.
For the liquid: − •
∂ ∂ − =
∂ x m
v
vl l l
l ρ
φρ
t (1)
For the vapour: •
•
+ ∂ ∂ − = ∂
∂
m x
v
S g v
v v
t
ρ
The mass balance of the liquid water and of the vapour, summed together to eliminate the source term related to the phase changes (evaporation and condensation), form the mass balance equation of the liquid phase
(
)
⎟⎠ ⎞ ⎜
⎝ ⎛ ∇ − −∇
= ∂ ∂ + ∂
∂ •
v v l
l g
v l
lS φρ S ρ v ρ v
φρ
t ) ( t
)
( (3)
where;
ρvvv =ρvvg −ρvvv
•
Water and gas velocity can be easily derived from Darcy’s law
Z P
k
l l
l ∇ + ∇
= μ
K
-vl (4)
g g
g P k
∇ =
μ
K
-vg (5)
where ρv,ρg,ρl,φ,Sl,Sg, m• , Z are vapour density, gas density, liquid density, porosity, liquid saturation, gas saturation, evaporation and condensation term and the vertical elevation from a datum. Transport in the vapour state by diffusion is given by;
(6) where Datm is the molecular diffusivity of water vapour through dry air and is given
in reference[15],α is a tortuosity factor, ν is a mass flow factor, given as in reference[16]. The contribution of vapour transport by diffusive flow as dealt with in this study, was derived by Philip and de Vries[12] which included the microscopic pore temperature gradient ([∇T]a/∇T) by introducing the flow area factor (fc). This
derivation has been re-evaluated and explained fully by Ewen and Thomas[17]. However, Kanno et al[18] could not obtain a good agreement between predicted and experimental result from tests on clay samples using the above[17] derivation. In the latter work, they proved that the vapour flow area factor for clay material depends linearly on volumetric air content, where it gave the best result and therefore it was also implemented in this work. Simplification of the influence vapour flux (refer to the Eqution (6)) into the diffusivity term having regarding to the measured parameters as derived in [12, 17, 19]gives;
(
)
[ ]
c(
g)
a l
v P f ⎟⎟+∇ ∇P
⎠ ⎞ ⎜⎜
⎝ ⎛
⎟ ⎠ ⎞ ⎜
⎝ ⎛
∇ ∇ ∇ ∇ + ∇ ∇
= l T ,f Dvg
T T T Dv Dv
v (7)
whereDvT,Dv and g Dvl are the diffusive term that included the vapour dispersive terms. The energy equation for the whole medium is given below;
v v
atm g v
v
D S
v ρ
ρ να φ
( )
(
)
⎟⎟ ⎠ ⎞ ⎜⎜
⎝ ⎛
− ∇
− +
∇ − ∇ ∇ = ∂
+ −
∂
∑
=alv i
i
pi i r g
v v v v
g s
p T L T T C
t
L S C
v ) (
) v v
( ) ( 1
, ,
ρ ρ
ρ λ
ρ φ ρ
φ (8)
where λ, L, Cpi are the thermal conductivity, latent heat and heat capacity of the
related medium. By applying a mass balance to the flow of gaseous (dry air and vapour) mixture within the pores of the ceramic body dictates that the time derivative of the gaseous mixture content is equal to the spatial derivative of the gaseous mixture .
(
)
•+ −∇
= ∂ ∂
m v
t g g
g ρ
ρ
(9)
The pressure and density of the gas accounts for an air and vapour mixture that is dependent on the surrounding humidity and also the convection at the surface of the body. In this problem, the air portion is assumed to follow Dalton’s Law as an ideal gas.
3
Thermodynamic Relationship
The existence of a local equilibrium at any point within the porous system is assumed. The equilibrium vapour pressure can be approximated by Kelvin’s equation. This equation shows that the equilibrium of water vapour, Pv differs from
the saturation pressure Pvs, due to the curvature of the interface between capillary, Pc
or hygroscopic water and the gas phase inside the pores of the medium. Given that
⎟⎟ ⎠ ⎞ ⎜⎜
⎝
⎛ −
− = ⎟⎟ ⎠ ⎞ ⎜⎜
⎝ ⎛ − =
T R
P P T
R P rh
v l
l g
v l
c
ρ
ρ exp
exp )
( (10)
where Rv is a specific gas constant for water vapour, the vapour partial pressure can
be calculated as a function of local temperature and relative humidity using the relationship
( )
vsv rhP
P = (11) where the saturation vapour pressure, Pvs may be estimated using the saturated
vapour density as a function of temperature and is given in[20]. This has been fitted to the vapour-pressure–temperature data from the steam tables. The degree of saturation Sl (considering together a hygroscopic region and capillary water, if the
( ) ( )
( )
( )
(
)
m
n c r
l sat l
r l l l
T P S
S S S
S ⎟⎟
⎠ ⎞ ⎜
⎜ ⎝ ⎛
+ = − − =
) ( 1
1
ϕ (12)
In eq(12), the parameters ϕ, n and m are three different porous material properties that are directly dependent on the shape of the water retention curve.
( ) ( )
Sl sat, Sl rare the saturated saturation and the irreducible saturation. The appropriateness of this will be addressed later within this research programme. The relative permeability expression for water(kl) and gas(kg) used Mualem’s model thathas been developed for soils and implemented in hygrothermal research [23]. This was also implemented in this model. In the latter work, these relative permeability properties on the ceramic body were measured in the isothermal condition which is the condition for drying of a ceramic shell body.
( )
(
(
)
)
2/ 1 1
1 m m
l sl sl sl
k = − − (13)
( )
(
m)
mg sl sl sl
k = 1− 1− 1/ 2 (14) where m and n terms and values in the Equation (12) to the Equation (14) are referring to the same terms and values as given in the reference[23].
4
Material Data for the Ceramic(shell) Body
In this work the ceramic shell body was considered to have the same properties as a nonhygroscopic brick. This is because the drying of investment shell ceramic is far below the temperature at which bound water becomes a consideration [24].
ρs,(kg/m3) φ K,(m2) Cp, J/(mol K) λ, (W/mK) L, (J.kg) Sr
2000 0.35 1X10-14 925 1.8 2.4X10⁶ 0.1
Table 1:Physical and transport properties of ceramic body where ρs and K are solid density and intrinsic permeability of solid phase
5
Boundary Condition
(
v)
s v m P Ph −
= ∞
m
J (15)
(
s)
T T T
h −
= ∞
h
J (16)
6 Solution of Governing Equations and Numerical
Method
The equations have been solved as a coupled set. Each equation can be written in the general form:
( )
[
] { }
(
[
K( )
]
i[
K( )
]
i)
{ } ( )
R Z tC ∂ Φ =∇ cx∇Φ x+ cy∇Φ y Φ + ∇
∂
Φ (17)
Through application of a Galerkin weighted residual approach, this leads to a matrix representation:
{ }
0 ) ( )( )
(Φ Φ+C Φ Φ+J Φ =
K (18)
Where for a set coupling moisture, heat and gas transport:
⎥ ⎥ ⎥ ⎦ ⎤ ⎢ ⎢ ⎢ ⎣ ⎡ = 33 32 31 23 22 21 13 12 11 K K K K K K K K K K ⎥ ⎥ ⎥ ⎦ ⎤ ⎢ ⎢ ⎢ ⎣ ⎡ = 33 32 31 23 22 21 13 12 11 C C C C C C C C C C ⎪ ⎪ ⎪ ⎭ ⎪ ⎪ ⎪ ⎬ ⎫ ⎪ ⎪ ⎪ ⎩ ⎪ ⎪ ⎪ ⎨ ⎧ ∂ ∂ ∂ ∂ ∂ ∂ = Φ t P t T t P g l ⎪ ⎭ ⎪ ⎬ ⎫ ⎪ ⎩ ⎪ ⎨ ⎧ = Φ g l P T P ⎪ ⎭ ⎪ ⎬ ⎫ ⎪ ⎩ ⎪ ⎨ ⎧ = 3 2 1 J J J J
In which typical elements of the matrix are;
∑ ∫
= Ω Ω = n 1 s e s r ij ij e d N N CC
∑ ∫
= Ω Ω ∇ ∇ = n s e s r ij ij e d N N K K 1 e i r e r i i e e d n J N zd N K
J
∫
∫
Γ Ω Γ − Ω ∇ ∇ = 4
7 Result and Discussion
7.1
Validation Case Study
Two examples are solved to validate and demonstrate robustness of the code by illustrating hygro-thermal phenomena and their evolution during the drying of a ceramic shell body. The first example deals with a one dimensional ceramic brick heated from the top side, the short sides and bottom were treated as being insulated and impermeable and the heat and moisture transfer takes place at the top exposed surface only. The relevant material properties are presented in the Table 1 and the matrix is assumed to be saturated at the commencement of the drying process. Experimental data from [15] and simulation results for brick drying at 75°C with heat and mass transfer hT= 6 W/m2/K and hm = 0.008 ms-1 are shown in Figure 1 in
which moisture and temperature at the mid height of the brick are depicted over time. The reference temperature and relative humidity used are 75°C and 50-60%, and the geometry was described by a brick comprising side 10.7cm long and 3.2cm thick with the above boundary condition. This enables validation against the work by Stanish et al[15].
0 10 20 30 40 50 60 70
0 20 40 60 120 180 240 300 360 420 480 540
Time(minutes)
S
atu
ra
ti
o
n
,s
l(%
)
0 10 20 30 40 50 60 70 80
T
em
p
er
atu
re,
T
Experiment(sl), ref[8] Model(sl) Experiment(T), ref[8] Model(T)
Figure 1: liquid saturation and temperature changing over the drying time
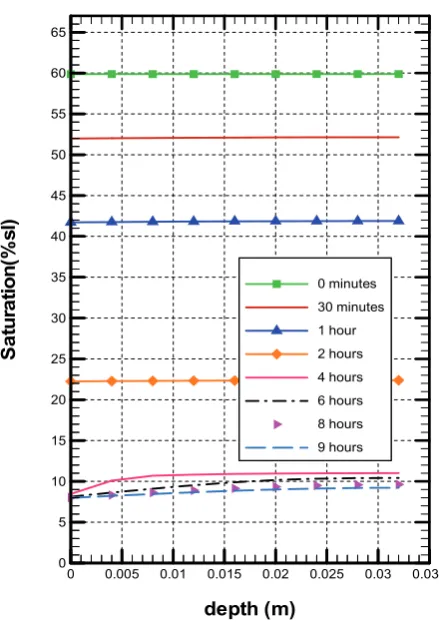
the interior of the materials and the dry zone will extend gradually. Normally this corresponds to a critical saturation of about 0.3[19] for most porous material. This shows the starting of the falling rate period. During this period the drying process will slow down and drying is now controlled by the water vapour movement. The comparison with experimental data displayed in Figure 1 is also very good, confirming the basis and quality of the simulation model that has been developed and applied in this case study. Figure 2, depicts the change in saturation over the brick height at discrete times, showing that the moisture content decreased slowly after the falling rate period.
depth (m)
S
a
tur
a
tion
(%
sl
)
0 0.005 0.01 0.015 0.02 0.025 0.03 0.035 0
5 10 15 20 25 30 35 40 45 50 55 60 65
[image:8.595.190.410.263.576.2]0 minutes 30 minutes 1 hour 2 hours 4 hours 6 hours 8 hours 9 hours
Figure 2: Saturation variation along the depth.
This is no longer possible below the irreducible saturation level [26, 27]. It has been found that the experimental detection of very low permeability is extremely difficult and it is generally taken as equal to zero in the drying process. Figure 4, also includes the variation of relative humidity within the porous matrix as a function of saturation. Above the critical saturation, the humidity remains close to a saturated humidity condition and below this value it showed the falling rate condition where the vapour transport mechanism plays an important role in changing the local humidity. When near to the irreducible saturation, the relative humidity just shows a very small change, indicating the minimum water content to which a material can theoretically be dried under the non hygroscopic condition.
depth(m)
T
em
p
er
at
u
re
(T
)
0 0.005 0.01 0.015 0.02 0.025 0.03 0.035 0
5 10 15 20 25 30 35 40 45 50 55 60 65 70 75
[image:9.595.196.412.290.617.2]0 minutes 30 minutes 1 hours 2 hours 4 hours 6 hours 8 hours 9 hours
0.0E+00 2.0E-09 4.0E-09 6.0E-09 8.0E-09 1.0E-08 1.2E-08 1.4E-08 1.6E-08 1.8E-08
60 42 12 8 8 8 8
Saturation(%sl)
L
iq
u
id
p
er
m
eab
il
it
y(
kw
)
0.0E+00 1.0E-01 2.0E-01 3.0E-01 4.0E-01 5.0E-01 6.0E-01 7.0E-01 8.0E-01 9.0E-01 1.0E+00
R
eal
ti
ve H
u
m
id
it
y(
rh
)
kw rh
Figure 4 : Liquid permeability and relative humidity against saturation.
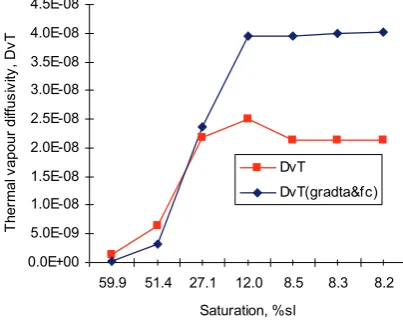
0.0E+00 5.0E-09 1.0E-08 1.5E-08 2.0E-08 2.5E-08 3.0E-08 3.5E-08 4.0E-08 4.5E-08
59.9 51.4 27.1 12.0 8.5 8.3 8.2 Saturation, %sl
T
her
mal
v
apour
di
ffus
iv
ity
, D
vT
DvT
[image:10.595.157.434.130.289.2]DvT(gradta&fc)
Figure 5: Thermal vapour(with and without microscopic pore temperature(gradta) gradient) diffusivity against saturation
By including a microscopic pore temperature gradient and a vapour flow factor in the Equation (6), these term change the thermal vapour diffusivity coefficient (DvT)
in the vapour transport equation as shown in Equation (7). This effect can be seen in Figure 5, where the plot without the pore temperature gradient (gradta) and and flow factor (fc) showed a small change in the value DvT. The same trend can be found in
[12] and also other related papers [17] that used this derivation showing an agreement with this formulation. The consequent difference is anticipated in the falling rate period where the vapour transport mechanism plays an important role in transferring moisture to the air. However, due to the small influence on the coefficient value, this effect just showed a small difference in temperature and also a small reduction in moisture content (especially after falling rate period). The small difference was not perceptible in comparison with the large scale of temperature and moisture variation. Typically the moisture difference was 0.01-0.05%, but even this
[image:10.595.184.386.324.486.2]7.2 Two Dimensional Case Study – Single Layer Problem
[image:11.595.101.436.287.467.2]The two dimensional case study represents a corner section. This is shown in Figure 6 that also summarises the boundary condition prescription. The ceramic comprises a single layer. The material properties that were used are listed in Table 1. Initially the layer shell has a saturation equal to 95-96% and a body temperature of 19°C. The saturation and relative humidity are almost constant across the body. The ambient condition applied comprise a temperature of 23°C and a relative humidity of 50%. This approximates nearly an isothermal drying process in which moisture is removed through control of ambient humidity. Examples of the two dimensional results at different times are presented in Figures 7 and Figure 8.
Figure 6: Schematic of convective boundary conditions in single first layer
X-coord (m)
Y
-c
o
o
rd
(m
)
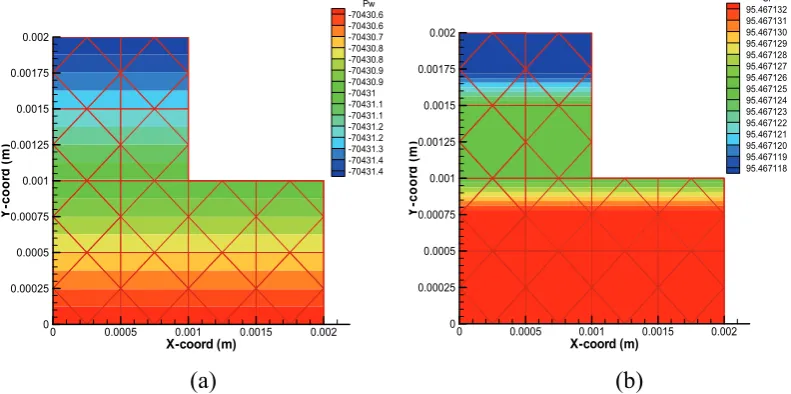
0 0.0005 0.001 0.0015 0.002 0
0.00025 0.0005 0.00075 0.001 0.00125 0.0015 0.00175 0.002
Pw -70430.6 -70430.6 -70430.7 -70430.8 -70430.8 -70430.9 -70430.9 -70431 -70431.1 -70431.1 -70431.2 -70431.2 -70431.3 -70431.4 -70431.4
X-coord (m)
Y
-c
o
o
rd
(m
)
0 0.0005 0.001 0.0015 0.002 0
0.00025 0.0005 0.00075 0.001 0.00125 0.0015 0.00175 0.002
Sl 95.467132 95.467131 95.467130 95.467129 95.467128 95.467127 95.467126 95.467125 95.467124 95.467123 95.467122 95.467121 95.467120 95.467119 95.467118
(a) (b)
[image:11.595.98.494.514.711.2]X-coord (m) Y -c o o rd (m )
0 0.0005 0.001 0.0015 0.002
0 0.00025 0.0005 0.00075 0.001 0.00125 0.0015 0.00175 0.002 kw 8.3714692E-11 8.3714689E-11 8.3714686E-11 8.3714683E-11 8.3714680E-11 8.3714677E-11 8.3714674E-11 8.3714671E-11 8.3714668E-11 8.3714665E-11 8.3714662E-11 8.3714658E-11 8.3714655E-11 8.3714652E-11 8.3714649E-11 (c)
Figure 7: (c) Permeability(kw) at the beginning of drying times
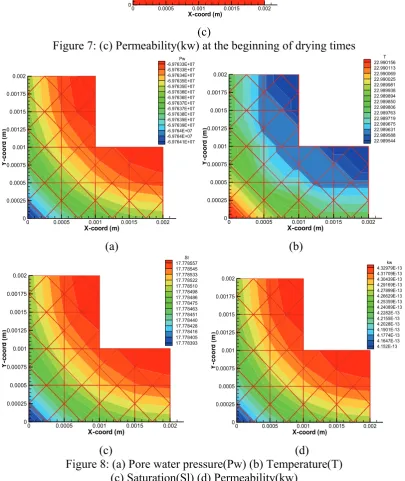
X-coord (m) Y -c oor d (m )
0 0.0005 0.001 0.0015 0.002 0 0.00025 0.0005 0.00075 0.001 0.00125 0.0015 0.00175 0.002 Pw -6.97633E+07 -6.97633E+07 -6.97634E+07 -6.97635E+07 -6.97635E+07 -6.97636E+07 -6.97636E+07 -6.97637E+07 -6.97637E+07 -6.97638E+07 -6.97639E+07 -6.97639E+07 -6.9764E+07 -6.9764E+07 -6.97641E+07 X-coord (m) Y -c oor d (m )
0 0.0005 0.001 0.0015 0.002 0 0.00025 0.0005 0.00075 0.001 0.00125 0.0015 0.00175 0.002 T 22.990156 22.990113 22.990069 22.990025 22.989981 22.989938 22.989894 22.989850 22.989806 22.989763 22.989719 22.989675 22.989631 22.989588 22.989544
(a) (b)
X-coord (m) Y -c oor d (m )
0 0.0005 0.001 0.0015 0.002 0 0.00025 0.0005 0.00075 0.001 0.00125 0.0015 0.00175 0.002 Sl 17.778557 17.778545 17.778533 17.778522 17.778510 17.778498 17.778486 17.778475 17.778463 17.778451 17.778440 17.778428 17.778416 17.778405 17.778393 X-coord (m) Y -c oor d (m )
0 0.0005 0.001 0.0015 0.002 0 0.00025 0.0005 0.00075 0.001 0.00125 0.0015 0.00175 0.002 kw 4.32979E-13 4.31709E-13 4.30439E-13 4.29169E-13 4.27899E-13 4.26629E-13 4.25359E-13 4.24089E-13 4.2282E-13 4.2155E-13 4.2028E-13 4.1901E-13 4.1774E-13 4.1647E-13 4.152E-13
(c) (d)
[image:12.595.93.499.255.737.2]X-coord (m)
Y
-c
o
o
rd
(m
)
0 0.0005 0.001 0.0015 0.002 0
0.00025 0.0005 0.00075 0.001 0.00125 0.0015 0.00175 0.002
rh 0.59913 0.599129 0.599129 0.599129 0.599129 0.599128 0.599128 0.599128 0.599128 0.599127 0.599127 0.599127 0.599126 0.599126 0.599126
(e)
Figure 8: (e) Relative humidity(rh) at 2 hours.
The results of measured parameters in the first layer within the first 2 hours of drying are shown in Figure 8. As expected, the greatest changes are observed in the corner zone where the temperature reaches its maximum value, leading to the lowest saturation, water permeability and relative humidity. Saturation, permeability and relative humidity contours show very close or similar patterns due to their strong dependence on the moisture content. At the time increments, all parameters show only a small variation across the body due to the geometry of the ceramic shell layer (1mm thick) and its ability to promote moisture transport. To some extent, this reflects industrial practice where a single layer is typically exposed to a drying duration of 2 hours.
7.3
Two Dimensional Case Study – Multilayer Problem
[image:13.595.196.397.104.292.2]Figure 9 : Schematic of convective boundary conditions in multilayer shell body
X-coord (m)
Y-co
o
rd
(m
)
0 0.005 0.01
0 0.001 0.002 0.003 0.004 0.005 0.006 0.007 0.008 0.009 0.01 0.011 0.012
Pw -1.05315E+07 -1.85629E+07 -2.65944E+07 -3.46258E+07 -4.26573E+07 -5.06888E+07 -5.87202E+07 -6.67517E+07 -7.47831E+07 -8.28146E+07 -9.08461E+07 -9.88775E+07 -1.06909E+08 -1.1494E+08 -1.22972E+08
X-coord (m)
Y-co
o
rd
(m
)
0 0.005 0.01
0 0.001 0.002 0.003 0.004 0.005 0.006 0.007 0.008 0.009 0.01 0.011 0.012
T 20.9403 20.8137 20.6872 20.5606 20.4341 20.3076 20.181 20.0545 19.928 19.8014 19.6749 19.5483 19.4218 19.2953 19.1687
(a) (b)
X-coord (m)
Y
-c
oor
d
(m
)
0 0.005 0.01
0 0.001 0.002 0.003 0.004 0.005 0.006 0.007 0.008 0.009 0.01 0.011 0.012
Sl 71.9123 67.8117 63.7111 59.6105 55.5099 51.4093 47.3087 43.2082 39.1076 35.007 30.9064 26.8058 22.7052 18.6046 14.504
X-coord (m)
Y-co
o
rd
(m
)
0 0.005 0.01
0 0.001 0.002 0.003 0.004 0.005 0.006 0.007 0.008 0.009 0.01 0.011 0.012
kw 3.44988E-11 3.21988E-11 2.98989E-11 2.7599E-11 2.52991E-11 2.29992E-11 2.06993E-11 1.83993E-11 1.60994E-11 1.37995E-11 1.14996E-11 9.19968E-12 6.89976E-12 4.59984E-12 2.29993E-12
[image:14.595.112.488.337.743.2](c) (d) Figure 10: (a) Pore water pressure(Pw) (b) Temperature(T)
X-coord (m)
Y
-c
oor
d
(m
)
0 0.005 0.01
0 0.001 0.002 0.003 0.004 0.005 0.006 0.007 0.008 0.009 0.01 0.011 0.012
rh 0.9433 0.905741 0.868181 0.830622 0.793063 0.755503 0.717944 0.680385 0.642825 0.605266 0.567706 0.530147 0.492588 0.455028 0.417469
[image:15.595.193.407.105.303.2](e)
Figure 10: (e) Relative humidity(rh) at the beginning of drying times.
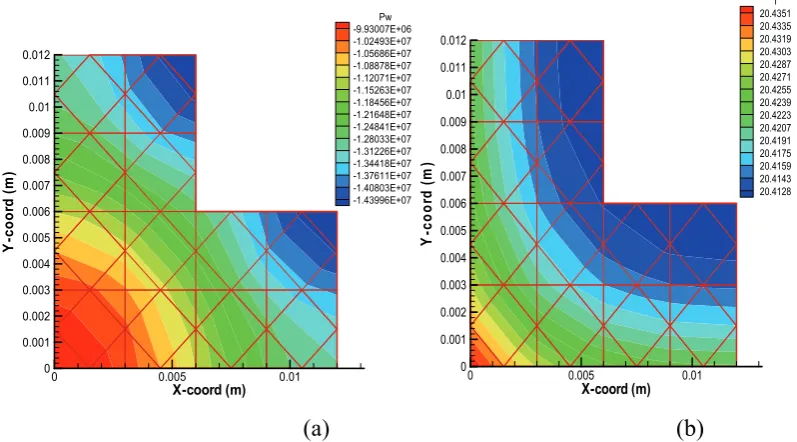
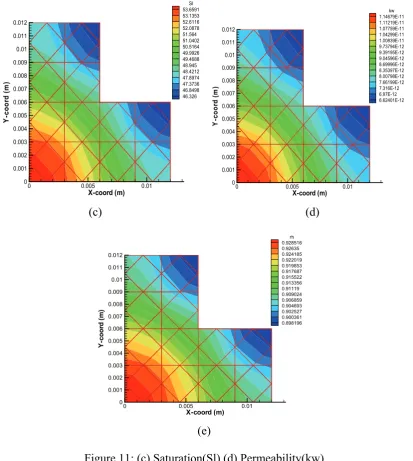
Results at the early stage of drying (1.3 minutes and 5.5 minutes) showed the saturation is higher at the tip of corner zone, due to the fact that the thinner layers dry faster. The same evolution is followed by the interrelated parameters and this information is shown in Figures 11 and Figure 12. Temperature shows the fastest change at the outer surface of the body at beginning of drying achieving the highest value at the saturated corner. This is probably due to the higher water content at the outer zone raising the thermal conductivity within the network. In this simulation, the inner surface (first layer) is assumed to be at a slightly higher temperature compared with the outer surface at the start of drying. Later, the highest temperature is shown at the tip of the corner zone due to heat input from the two sides.
X-coord (m)
Y-co
o
rd
(m
)
0 0.005 0.01
0 0.001 0.002 0.003 0.004 0.005 0.006 0.007 0.008 0.009 0.01 0.011 0.012
Pw -9.93007E+06 -1.02493E+07 -1.05686E+07 -1.08878E+07 -1.12071E+07 -1.15263E+07 -1.18456E+07 -1.21648E+07 -1.24841E+07 -1.28033E+07 -1.31226E+07 -1.34418E+07 -1.37611E+07 -1.40803E+07 -1.43996E+07
X-coord (m)
Y-co
o
rd
(m
)
0 0.005 0.01
0 0.001 0.002 0.003 0.004 0.005 0.006 0.007 0.008 0.009 0.01 0.011 0.012
T 20.4351 20.4335 20.4319 20.4303 20.4287 20.4271 20.4255 20.4239 20.4223 20.4207 20.4191 20.4175 20.4159 20.4143 20.4128
(a) (b)
[image:15.595.95.494.507.728.2]X-coord (m)
Y-co
o
rd
(m
)
0 0.005 0.01
0 0.001 0.002 0.003 0.004 0.005 0.006 0.007 0.008 0.009 0.01 0.011 0.012
Sl 53.6591 53.1353 52.6116 52.0878 51.564 51.0402 50.5164 49.9926 49.4688 48.945 48.4212 47.8974 47.3736 46.8498 46.326
X-coord (m)
Y
-c
oor
d
(m
)
0 0.005 0.01
0 0.001 0.002 0.003 0.004 0.005 0.006 0.007 0.008 0.009 0.01 0.011 0.012
kw 1.14679E-11 1.11219E-11 1.07759E-11 1.04299E-11 1.00839E-11 9.73794E-12 9.39195E-12 9.04596E-12 8.69996E-12 8.35397E-12 8.00798E-12 7.66199E-12 7.316E-12 6.97E-12 6.62401E-12
(c) (d)
X-coord (m)
Y
-c
oor
d
(m
)
0 0.005 0.01
0 0.001 0.002 0.003 0.004 0.005 0.006 0.007 0.008 0.009 0.01 0.011 0.012
rh 0.928516 0.92635 0.924185 0.922019 0.919853 0.917687 0.915522 0.913356 0.91119 0.909024 0.906859 0.904693 0.902527 0.900361 0.898196
(e)
[image:16.595.93.507.187.649.2]X-coord (m) Y -c oor d (m )
0 0.005 0.01
0 0.001 0.002 0.003 0.004 0.005 0.006 0.007 0.008 0.009 0.01 0.011 0.012 Pw -1.23709E+07 -1.23757E+07 -1.23805E+07 -1.23853E+07 -1.23901E+07 -1.23948E+07 -1.23996E+07 -1.24044E+07 -1.24092E+07 -1.2414E+07 -1.24188E+07 -1.24236E+07 -1.24284E+07 -1.24332E+07 -1.2438E+07 X-coord (m) Y -c oor d (m )
0 0.005 0.01
0 0.001 0.002 0.003 0.004 0.005 0.006 0.007 0.008 0.009 0.01 0.011 0.012 T 20.6094 20.6072 20.605 20.6028 20.6007 20.5985 20.5963 20.5941 20.5919 20.5898 20.5876 20.5854 20.5832 20.581 20.5789
(a) (b)
X-coord (m) Y -c oor d (m )
0 0.005 0.01
0 0.001 0.002 0.003 0.004 0.005 0.006 0.007 0.008 0.009 0.01 0.011 0.012 Sl 49.2668 49.2592 49.2516 49.244 49.2364 49.2288 49.2212 49.2137 49.2061 49.1985 49.1909 49.1833 49.1757 49.1681 49.1605 X-coord (m) Y -c oor d (m )
0 0.005 0.01
0 0.001 0.002 0.003 0.004 0.005 0.006 0.007 0.008 0.009 0.01 0.011 0.012 kw 6.54087E-12 6.53203E-12 6.52319E-12 6.51435E-12 6.50551E-12 6.49667E-12 6.48783E-12 6.47899E-12 6.47015E-12 6.46131E-12 6.45247E-12 6.44362E-12 6.43478E-12 6.42594E-12 6.4171E-12
(c) (d)
X-coord (m) Y -c oor d (m )
0 0.005 0.01
0 0.001 0.002 0.003 0.004 0.005 0.006 0.007 0.008 0.009 0.01 0.011 0.012 rh 0.911907 0.911875 0.911842 0.91181 0.911778 0.911746 0.911714 0.911682 0.91165 0.911617 0.911585 0.911553 0.911521 0.911489 0.911457 (e)
[image:17.595.92.495.98.712.2]X-coord (m) Y-co o rd (m )
0 0.005 0.01
0 0.001 0.002 0.003 0.004 0.005 0.006 0.007 0.008 0.009 0.01 0.011 0.012 Pw -1.24082E+07 -1.24147E+07 -1.24212E+07 -1.24277E+07 -1.24342E+07 -1.24407E+07 -1.24472E+07 -1.24537E+07 -1.24602E+07 -1.24667E+07 -1.24733E+07 -1.24798E+07 -1.24863E+07 -1.24928E+07 -1.24993E+07 X-coord (m) Y-co o rd( m )
0 0.005 0.01
0 0.001 0.002 0.003 0.004 0.005 0.006 0.007 0.008 0.009 0.01 0.011 0.012 T 20.6175 20.6157 20.6139 20.6121 20.6103 20.6085 20.6067 20.6049 20.6031 20.6013 20.5995 20.5978 20.596 20.5942 20.5924
(a) (b)
X-coord (m) Y -c oor d (m )
0 0.005 0.01
0 0.001 0.002 0.003 0.004 0.005 0.006 0.007 0.008 0.009 0.01 0.011 0.012 Sl 49.2062 49.1959 49.1855 49.1752 49.1649 49.1545 49.1442 49.1338 49.1235 49.1132 49.1028 49.0925 49.0822 49.0718 49.0615 X-coord (m) Y -c oor d (m )
0 0.005 0.01
0 0.001 0.002 0.003 0.004 0.005 0.006 0.007 0.008 0.009 0.01 0.011 0.012 kw 8.3177E-12 8.31181E-12 8.30593E-12 8.30004E-12 8.29416E-12 8.28828E-12 8.28239E-12 8.27651E-12 8.27062E-12 8.26474E-12 8.25886E-12 8.25297E-12 8.24709E-12 8.24121E-12 8.23532E-12
(c) (d)
X-coord (m) Y-co o rd (m )
0 0.005 0.01
0 0.001 0.002 0.003 0.004 0.005 0.006 0.007 0.008 0.009 0.01 0.011 0.012 rh 0.911663 0.91162 0.911577 0.911533 0.91149 0.911447 0.911404 0.911361 0.911317 0.911274 0.911231 0.911188 0.911145 0.911101 0.911058 (e)
[image:18.595.97.500.100.711.2]As drying proceeds, results show that the moisture content moves slowly from the wet zone to the inner shell due to convective transfer at the outer surface. The same evolution of others interrelated parameters is also exhibited in Figure 13. Now the excess moisture tends to moves towards to the inner dryer region driven by the temperature gradient at the highest temperature. Over the drying times, as expected, the greatest changes are observed in the corner zone where the temperature reaches its maximum value, leading to the lowest saturation, water permeability and relative humidity. The final state is depicted in Figure 14 in which thermal and saturation levels are nearly uniform throughout the matrix.
X-coord (m) Y -c oor d (m )
0 0.005 0.01
0 0.001 0.002 0.003 0.004 0.005 0.006 0.007 0.008 0.009 0.01 0.011 0.012 Pw -5.27646E+07 -5.30202E+07 -5.32757E+07 -5.35313E+07 -5.37869E+07 -5.40424E+07 -5.4298E+07 -5.45535E+07 -5.48091E+07 -5.50647E+07 -5.53202E+07 -5.55758E+07 -5.58314E+07 -5.60869E+07 -5.63425E+07 X-coord (m) Y-co o rd (m )
0 0.005 0.01
0 0.001 0.002 0.003 0.004 0.005 0.006 0.007 0.008 0.009 0.01 0.011 0.012 T 22.9433 22.9432 22.9431 22.9429 22.9428 22.9426 22.9425 22.9423 22.9422 22.942 22.9419 22.9417 22.9416 22.9414 22.9413
(a) (b)
X-coord (m) Y-co o rd (m )
0 0.005 0.01
0 0.001 0.002 0.003 0.004 0.005 0.006 0.007 0.008 0.009 0.01 0.011 0.012 Sl 21.9472 21.874 21.8007 21.7275 21.6542 21.5809 21.5077 21.4344 21.3612 21.2879 21.2146 21.1414 21.0681 20.9949 20.9216 X-coord (m) Y -coor d (m )
0 0.005 0.01
0 0.001 0.002 0.003 0.004 0.005 0.006 0.007 0.008 0.009 0.01 0.011 0.012 kw 2.65279E-13 2.60812E-13 2.56345E-13 2.51879E-13 2.47412E-13 2.42945E-13 2.38479E-13 2.34012E-13 2.29545E-13 2.25079E-13 2.20612E-13 2.16145E-13 2.11678E-13 2.07212E-13 2.02745E-13
[image:19.595.96.505.268.698.2](c) (d)
X-coord (m)
Y-co
o
rd
(m
)
0 0.005 0.01
0 0.001 0.002 0.003 0.004 0.005 0.006 0.007 0.008 0.009 0.01 0.011 0.012
rh 0.678725 0.677469 0.676213 0.674957 0.673701 0.672445 0.671189 0.669933 0.668677 0.667421 0.666165 0.664909 0.663653 0.662397 0.661141
[image:20.595.193.397.103.298.2](e)
Figure 14: (e) Relative humidity(rh) at 8 hours.
8
Conclusion
The aim of this study was to establish the basis of a simulation approach to represent the heat and mass transfer that occurs during the drying of layers in a ceramic shell mould. The model used is very comprehensive and accounts for moisture transport by capillary, vapour and gas transport mechanisms. Energy transfer accounts for latent heat and diffusion including the influence of local moisture content. Verification of the model has been performed on a one dimensional domain, focusing on brick drying. Through this benchmarking, the results show that the prediction of measured variables and transport properties are in good agreement with other related work. A two dimensional study is presented for conditions that are pertinent to shell drying conditions. The predicted results for single layer shell mould system show that after 2 hours drying times the shell achieves a nearly dried nonhygroscopic body. For a multilayer shell, drying to a similar state requires more than 8 hours drying time. These results also are compared well with shell drying experimental work in which later drying effects are explored.
Acknowledgment
The financial support sponsored by Tun Hussein Onn University College (KUiTTHO), Malaysia towards the research studies of first author is gratefully acknowledged.
References
[2] Leyland S., Jones S., "The Effect of Varying The Intercoat Drying Time Upon The Rate of Moisture Removal From An Investment Casting Shell Mould", Report: Rolls-Royce Plc and School of Metallurgy and Materials, The University of Birmingham, Bristol, UK.
[3] Jones S., Leyland S., "Investigation Into the Drying Behavior of Water Based Slurries", in "Proc. 42nd Annual Technical Meeting of the Investment Casting Institute", Investment Casting Institute, Atlanta, USA, September 1994.
[4] Leyland S., "Research Procedures and History of The Water Based Shell Development Programme", in "Internal memorandum", Rolls-Royce Plc, PCF-Derby, PCF-Derby, March 1996.
[5] Leyland S., Jones S., "The Effect of Drying Conditions Upon The Wax/Ceramic Interface Temperature", Report: Rolls-Royce Plc, Company Research & Development Foundry and School Of Metallurgy and Materials, The University of Birmingham, UK.
[6] Hyde R., "The Rupture of Ceramic Moulds for Investment Casting", Master Theses, School of Metallurgy and Materials, University Of Birmingham: Edgbaston, Birmingham England, October 1995.
[7] Scherer G.W., Theory of Drying, Journal America Ceramic Society, 73(1), 3-14, 1990.
[8] Jones S., Leyland S., "The Use of Conductivity As a Means of Assessing The Extent of Wet Back in An Investment Mould", Report: University of Birmingham, Birmingham and Roll Royce plc, Derby, 1995.
[9] Mendes N., Philippi C.P., "A Method for Predicting Heat and Moisture Transfer through Multilayered Walls Based on Temperature and Moisture Content Gradients", International Journal of Heat and Mass Transfer, 48, 37-51, 2005.
[10] Nasrallah S.B., Perre P., "Detailed Study of A Model of Heat and Mass Transfer During Convective Drying of Porous Media", International Journal Heat Mass Transfer, 31(5), 957-967, 1988.
[11] Whitaker S., "Simultaneous Heat and Momentum Transfer in Porous Media: A Theory of Drying", Advances in Heat Transfer, Academic Press, New York, 13, 119-203, 1977.
[12] Philip J.R., de Vries D.A., "Moisture Movement in Porous Materials Under Temperature Gradients", Trans. Am. Geophys. Union,38, 222-232, 1957. [13] Shusheng P., Keey R.B., "Modelling The Temperature Profiles within Boards
During the High-Temperature Drying of Pinus Radiata Timber: The influence of Airflow Reversal", International Journal heat Mass Transfer, 38(2), 189-205, 1995.
[14] Gawin D., Majorana C.E., Schrefler B.A., "Numerical Analysis of Hygro-thermal Behaviour and Damage of Concrete at High Temperature", Mechanics of Cohesive-Frictional Materials, 4, 37-74, 1999.
[15] Stanish M.A, Schajer G.S, and Kayihan F., "A Mathematical Model of Drying for Hygroscopic Porous Media" AIChE, 32(8), 1301-1311, 1986.
[17] Even J., Thomas H.R., "Heating Unsaturated Medium", Geotechnique, 39(3), 455-70, 1989.
[18] Kanno T., Kato K., Yamagata J., "Moisture Movement Under A Temperature Gradient in Highly Compacted Bentonite", Engineering geology, 41, 287-300, 1996.
[19] de Vries D.A.,"Simultaneous Transfer of Heat and Moisture in Porous Media", Trans. Am Geophysc Union, 39, 909-916, 1958.
[20] Mayhew Y.R., Rogers G.F.C., "Thermodynamic and Transport Properties of Fluids, 2nd edition, Blackwell, Oxford, 1976.
[21] Grant S.A., Salehzadeh H., "Calculation of Temperature Effects on Wetting Coefficients of Porous Solids and Their Capillary Functions", Water Resources Research Journal, 261-270, 1996.
[22] Van Genuchten M.T., "A Closed-Form Equation for Predicting the Hydraulic Conductivity of An Unsaturated Soils", Soil Science Soc. of America Journal, 44, 892-898, 1980.
[23] Baroghel-Bouny V., Mainguy M., Lassabatere T., Coussy O., "Characterization and Identification of Equilibrium and Transfer Moisture Properties for Ordinary and High Performance Cementitious materials", Cement and Concrete Research, 29, 1225-1238, 1999.
[24] Hansen K.K., "Unfired Clay Bricks-Retention Curves and Liquid Diffusivities", in "Building Physics 2002-6th Nordic symposium", 2002.
[25] Nissan A.H, Kaye W., Bell J.R., "Mechanism of Drying Thick Porous Bodies During The Falling Rate Period", AIChE, 5, 103-110, 1959.
[26] Spolek G.A., Plumb O.A., "Capillary Pressure in Softwood", Wood Science Technology, 15, 189-199, 1981.
[27] Tesoro F.O., Choong E.T., Kimbler O.K., "Relative Permeability and The Gross Pore Structure of Wood", Wood Fiber Science, 6(3), 226-236, 1974. [28] Huinink H.P., Pel L., Michels M.A.J, Prat M., "Drying Processes in The