Forecasting the Inventory Needs for the City Schools
Division of Mabalacat Using Moving Average and
Exponential Smoothing
Ronilyn M. Telan*, Mary Ann F. Quioc
Mabalacat City College, Philippines
Copyright©2017 by authors, all rights reserved. Authors agree that this article remains permanently open access under the terms of the Creative Commons Attribution License 4.0 International License
Abstract
This study focused on the development of a decision-support system to forecast the inventory needs of the City Schools Division of Mabalacat. Each Property Custodian, called District Property Custodian for primary and Secondary School Supply Officer for secondary, is responsible for determining the needs and excess items of schools within their jurisdiction. Their tasks involve itemization of each school’s physical properties to be able to forward proper requests for additional needs to division office. Such task requires time to be finished as the bulk of data needed to be processed and analyzed are increasing annually. Hence, delays had been experienced from requests to the delivery of the requested items. The Property Custodians should be able to plan the demand or identify the number of needed equipment and items of each school within their jurisdictions before the request will be delivered. The said manual procedures in the inventory had been automated in the new system. In order to forecast the necessary number of items for each school in the division office, the researchers applied Moving Average and Exponential Smoothing. The data resulted in the said forecast had been used to request items with neither minimal excess nor insufficiency that results in wastage.Keywords
Decision-support System, Moving Average, Exponential Smoothing, Inventory Forecasting1. Background
Inventory management involves systems and processes that identify inventory requirements, set targets, provide replenishment techniques, report actual and projected inventory status, and handle all functions related to the tracking and management of material. This would include the monitoring of material moved into and out of stockroom locations and the reconciling of the inventory balances [1].
Organizations, such as schools and universities, are responsible for the storage of nearly limitless supplies and books—from front office supplies to classroom texts and full libraries. The information and materials available at these institutions is incredibly valuable; however, without a quality inventory management system, that information can easily be lost or overlooked as materials are misplaced, forgotten, or pushed to the back of storage [2].
In 2012, by virtue of the Republic Act No. 10164, Mabalacat was converted into a City. Under Article VIII, Section 48 of the said Act, City Schools Division of Mabalacat (CSDM) was established with jurisdiction covers all the school districts within the City. Separating from the Division of Pampanga, CSDM faced adjustments as an independent Department of Education (DepEd) unit in Pampanga, specifically, in its inventory process.
The former CSDM inventory procedures involve personal submission of requests and forms for the delivery of the needed physical items of each school to the Division Supply Officer. Each Property Custodian, called District Property Custodian for primary and Secondary School Supply Officer for secondary, is responsible for determining the needs and excess items of schools within their jurisdiction. Their tasks involve itemization of each school’s physical properties to be able to forward proper requests for additional needs to division office. One of the responsibilities of the Division Supply Officer is to validate such information to be able to track if the awarded items, before and after the school year, match the recorded items in the record. These reports are required to be produced before other requests will be entertained. Such task requires time to be finished as the bulk of data needed to be processed and analyzed are increasing annually; hence, delays are being experienced from requests to the delivery of the requested items.
be able to plan the demand or identify the number of needed equipment and items of each school within their jurisdictions before the request will be delivered. With the increasing number of students enrolling each year, the necessity to know the number of items needed by each school is significant for students and teachers.
Forecasting is estimating how much product or service will increase or decrease in a matter of time. This is typically based on demand for the products and services it offers, compared to the cost of producing them. Demand forecasting is the method of projecting customer demand for a good or service. This process is a continual one where managers use historical data to calculate what they expect the sales demand for a good or service to be [3]. It also uses historical records to determine the direction of future trends [4].
The locale needs to make sure that all students in the Division of Mabalacat have a 1:1 ratio of books and chairs. All classrooms must not have more than 40 students. The books and chairs are delivered from the City Schools Division office. Therefore, number of items requested for the various elementary and high schools should be forecasted in the most efficient way. An excess in the number of requested supplies will result to wastage of funds while insufficient number of items will result to shortage of books and chairs
and will cause delays in the delivery of quality education among the students.
These challenges prompted the researchers to conduct a study to develop an inventory system with demand forecasting that aims to provide data to support decision-making for requirements to meet the physical future needs of all schools under CSDM.
2. Methods
2.1. Research Design
The System Development Life Cycle (SDLC) is a powerful methodology for systems development. Large Information Systems (ISs) that address structured problems are usually conceived, planned developed, and maintain within a framework. The approach is also called “waterfall” development, it consists of several distinct phases that are followed methodically, and developers complete the phases sequentially. SDLC follows the important phases and steps taken that are important for developers, such as requirement, analysis, design, development, testing, implementation and maintenance.
[image:2.595.122.519.377.615.2]The figure shown above is the methodology used by the researchers which describes the phases in creating the system. It composed of phases such as Requirement, Analysis, Design, Development, Testing and Maintenance.
2.1.1. Requirement Phase
In this phase, the researchers determined the requirements for the system by conducting initial interview to the locale and collecting all the information to be needed in developing the system. Gathered related studies and literature guided the researchers in setting the boundaries of the study. The researchers conducted interviews to the officers and staffs of City Schools Division of Mabalacat and gave questionnaires and suggestions to determine their perspective output for the proposed system.
The researchers considered what the locale wants for their intended output of the system. It is very important to understand the requirements and expectations that is why the researchers conducted a fact finding technique such as interview, giving questionnaires and collecting all the information to be needed in creating the system.
The method that was used by the researchers to get the information needed in developing the system was using survey. After giving survey questionnaires to the staff of CSDM, the researchers got the number of sample that was used for this research. Twenty-one (21) respondents out of twenty-three (23) staffs were surveyed.
Also, the researchers decided to conduct a weekly meeting to the locale specifically every Tuesday for their further comments or feedbacks regarding to the developing system. The purpose of the system to be developed was accepted and agreed upon. The requirements developed in this phase served as the basis for the succeeding phases in the development process.
2.1.2. Analysis Phase
Given all the data and information needed to build a system, the researchers put themselves in stage of analyzing. As the department wanted to have a website and reviewed all the information gathered, the researchers decided to develop a computerized system and it is supposed to be a Content Management System for City Schools Division of Mabalacat. The researchers studied the information that the locale provided and the processes of the system for the possible output.
The researchers used Context Diagram wherein the flow of the system would collaborate with one or more external user, Use Case Diagram used to describe a set of actions (use cases) that some system or systems (subject) can perform in collaborative with one or more external users of the system (actors), Visual Table of Contents for the presentation of the system and Entity-Relationship Diagram for showing the relationship between one or more entities.
2.1.3. Design Phase
To meet the system specification, after the planning and
analyzing, the researchers identified the software and hardware needed, database and user-interface design of the system.
First, the researchers deliberated what would be the design of the interface for the system based on the given data and information by the locale. After thorough analysis, the researchers agreed on what software would be used, the language for coding, and what database would be used. The researchers agreed to use Adobe Photoshop for the graphic design that would be used for the banner of the Content Management System, Cascading Style Sheet (CSS), PHP, and JavaScript for coding, XAMPP 1.7.3 with MYSQL for the database, and to access the system, the researchers considered mainstream web browsers for the users to use.
The general objective is to develop an online and Android-based system using Moving Average and Exponential Smoothing in forecasting the inventory needs of City Schools Division of Mabalacat.
Specifically, the study aimed to achieve the following: 1. To develop an access level controls for the following
types of users: 1.1. Administrator;
1.2. Property Custodian; and 1.3. School Representative.
2. To apply Moving Average and Exponential Smoothing forecasting methods in the system;
3. To create a module that will generate the following reports:
3.1. Inventory reports for all access level; 3.2. Enrollment reports for schools;
3.3. Shortages of textbooks, armchairs, rooms, and teachers;
3.4. Condemned items in textbooks and armchairs. 4. To develop a Content Management System for the
locale and the schools under the division;
5. To develop an Android-based application with synchronized data to the online system that will be used during the physical count of items;
6. To administer alpha and beta testing;
7. To evaluate the system using the following ISO 9126 criteria:
7.1. Functionality; 7.2. Usability; 7.3. Efficiency; 7.4. Maintainability; 7.5. Reliability; and 7.6. Portability.
This study focused on the development of an online and Android-based system with forecasting module using Moving Average and Exponential Smoothing in identifying the inventory needs of City Schools Division of Mabalacat.
division, districts, schools and items. The account can view the inventory status of every district and schools, forecasted enrollment, textbooks, armchairs, equipment, rooms and teachers, and notifications about the items condemnation dates.
The Property Custodian account updates the inventory of schools within the district, manage own account, view inventory, and forecasted enrollment and inventory figures of schools such as textbooks, armchairs, equipment, rooms including teachers.
School Representative account maintains and updates the school’s enrollment figure yearly, view the school’s inventory and forecasted enrollment figures. The account also has a module for the maintenance of school’s home page contents.
The system provides an inventory of each school’s textbooks, armchairs and equipment and materials for skill-based subjects such as electronics and computing devices. Information of each school’s number of rooms, teachers and the tally of enrollment figures will also be maintained.
Moving Average Method was used as the forecasting algorithm in the demand forecasting module of the system because it is the most common and tested method used for forecasting. Exponential Smoothing Method was also used to enhance the Moving Average Method to provide output of linear trend with smoothing factor (weighting) to the most recent period’s actual data [5]. Because of the continuous population increase, the number of students increases every year and linear trending is the most useful method to enhance the output of Moving Average Method.
The inventory system also includes forecasting reports for the enrollment of each school which will be needed in calculating the needed rooms. Each room will hold 40 students, as DepEd’s recommended pupil/student-teacher ratio is 40:1. Number of textbooks and armchairs will be forecasted using 1:1 ratio. Number of teachers that will be forecasted depends on the subject specializations and grade levels.
This system includes a module that generates inventory reports for all access levels, enrollment reports of each school, forecasted inventory of districts and schools, annual shortages of textbooks, armchairs, equipment, rooms and teachers. It will also provide a list of condemned inventory items for the current school year.
The system computes the shortages needed to be paid by a school in cases of lost or damage to any property issued by the DepEd. Each school has a dedicated page linked from the online system for navigation. All the data seen by the users will be synchronized online as well as on the Android application as soon as the application connects to the Internet. Additional feature of the Android application is scanning module using Quick Response (QR) code for getting each item status to be used by the Property Custodian in physical counting for inventory at the end of each school year.
The study does not include documents that need digital
signatures nor include scanned signatures of the various personnel. All documents will be still be personally signed by the supply officer. Billing module that will handle the shortages in inventory will no longer part of this system as the division has different scheme in payment. The CSDM personnel should still personally needs to count the inventory physically as per the directives of the Division Superintendent.
2.1.4. Development Phase
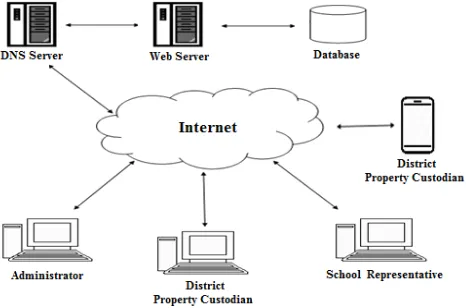
[image:4.595.316.549.340.494.2]The researchers decided to develop the system with the use of Adobe Dreamweaver and Adobe Photoshop CS4 for some of the web designs; XAMPP 1.7.3 for the web server and database. To further support the website’s frontend and backend, the researchers used HTML5, CSS, JavaScript and PHP. In building the Android application, the researchers used Android Studio. In this phase, following the system architecture, the system (online and the Android application) being developed should conform to the design requirement and was tested for bugs and errors while developing and improving its functionality.
Figure 2. System Architecture of the Developed System 2.1.5. Testing Phase
In this phase, Alpha and Beta testing used to check the system performance and to test its functionality, reliability, usability, efficiency, maintainability and portability. The system was tested by a four (4) IT expert and three (3) to the locale to ensure that the interface between the modules work and if the system worked on the intended platform required by the user.
If the system failed to function properly, the researchers would be required to go back to the stage of development where they can identify the errors in the codes. The system would be tested again to ensure the accuracy of each module before implementing the system.
2.1.6. Implementation Phase
2.1.7. Maintenance Phase
In the maintenance stage, the researchers and the locale decided and agreed to undergo database back up and would make a series of testing to ensure that the system is a bug free on a certain period in its implementation. Maintenance would be done to deliver some changes in the users’ environment if proven necessary.
3. Results
3.1. Alpha Test
[image:5.595.312.551.124.256.2]The researchers conducted the first stage of testing, which was the alpha test, and used the ISO 9126 as an evaluation tool for the proposed system. In alpha test, four (4) respondents were asked to evaluate the system. The respondents were selected based on their experiences in the field of Information of Communication and Technology (ICT). The respondents observed the accuracy and completeness of the system and gave some recommendations to make it more beneficial to the possible user.
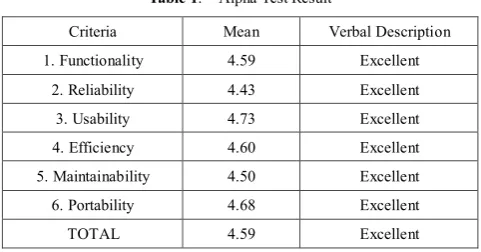
Table 1. Alpha Test Result
Criteria Mean Verbal Description 1. Functionality 4.59 Excellent
2. Reliability 4.43 Excellent 3. Usability 4.73 Excellent 4. Efficiency 4.60 Excellent 5. Maintainability 4.50 Excellent 6. Portability 4.68 Excellent TOTAL 4.59 Excellent
Table 1 shows the result of alpha test, the total weighted mean result is 4.59 which fall under excellent. The highest mean of 4.73 falls under Usability and the lowest mean of 4.43 falls under Reliability, both results also described as excellent.
The results show that the respondents found ease of understanding and that the system works for its intended purpose.
3.2. Beta Test
After the alpha test, the researchers have undergone beta testing using the same evaluation tool to ensure the quality and effectiveness of the said system. Beta test was conducted to the City Schools Division of Mabalacat to find out user acceptability of the system. The system was tested based on
the six (6) ISO 9126 criteria: functionality, reliability, usability, efficiency, maintainability, and portability and interpreted using the Likert Scale.
Table 2. Beta Test Result
Criteria Mean Verbal Description 1. Functionality 4.55 Excellent
2. Reliability 4.43 Excellent 3. Usability 4.89 Excellent 4. Efficiency 4.48 Excellent 5. Maintainability 4.43 Excellent 6. Portability 4.61 Excellent TOTAL 4.57 Excellent
Table 2 shows the result of beta testing which was conducted by the users in the locale. The total weighted mean result is 4.57 which fall under excellent. The highest mean is 4.89 and the lowest mean is 4.43 which both results also described as excellent.
The highest mean falls under Usability shows the clarity of the system to do its implied purpose. And the total weighted mean shows that the system achieved its intended purpose.
REFERENCES
[1] Benefits of Inventory Management [Internet]. Boundless.com; 2016 May 26 [cited 2016 August 8]. Available from: https://www.boundless.com/finance/textbookss/boundless-fin ance-textbooks/working-capital-management-18/inventory-m anagement-129/benefits-of-inventory-management-531-5154/ [2] Sutter, Brian. Managing Inventory for Education [Internet]. Wasp Barcode; 2014 August 28 [cited 2016 August 8]. Available from:
http://www.waspbarcode.com/buzz/managing-inventory-educ ation
[3] Demand Forecasting Techniques: Moving Average & Exponential Smoothing [Internet]. Study.com; 2016 [cited 2016 September 11]. Available from:
http://study.com/academy/lesson/demand-forecasting-techniq ues-moving-average-exponential-smoothing.html
[4] Forecasting [Internet]. Investopedia; 2016 [cited 2016 August 8]. Available from:
http://www.investopedia.com/terms/f/forecasting.asp
[image:5.595.57.298.364.490.2][5] Stevenson, W. J. Operations Management 12th Edition [Internet]. McGraw-Hill Education; 2014 [cited 2016 October 2]. Available from: