Multi objective genetic algorithm optimisation approach for the geometrical design of an active noise control systems
14
0
0
Full text
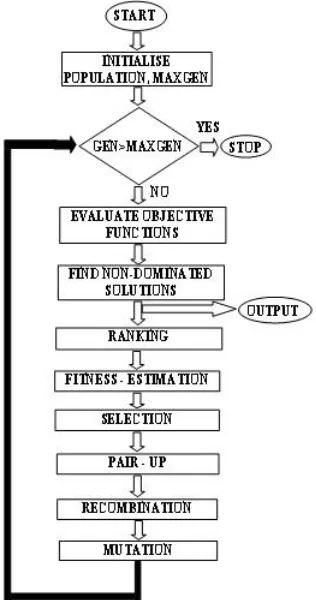
(2) International Journal of Integrated Engineering (Issue on Mechanical, Materials and Manufacturing Engineering). 1. INTRODUCTION ANC utilises the principle of wave interference to lead to destructive interference and hence to the reduction of unwanted noise. This is realised by generating cancelling sources through a process of detecting and processing unwanted sound with suitably designed electronic controllers. The wave interference yields a pattern of cancellation and reinforcement in a propagation medium. The pattern is mostly affected by the frequency of noise involved in relation to the separation between the system sources. The system’s dependence on geometrical arrangements of system components and the frequency range of interest is critical in affecting the physical extent of cancellation and system stability and imposing practical limitations on controller design. An analysis of the process of cancellation and the implications of system geometry on the physical extent of cancellation for single and multiple source configurations is carried out based on the geometrical design of ANC systems in a free-field propagation medium. The analysis is extended to the design constraints of the controller due to system geometrical and further to system stability. The analysis thus carried out is based on physical laws governing the characteristics of the medium and system components, and the system design based on such laws may require complex approaches, depending on the application. Hence suitable approaches allowing automatic designs are favoured. The success of the MOGAs approach, first introduced by Fonseca and Fleming [1, 2], in a wide variety of application domains, such as engineering, industrial and scientific field [3, 4], has encouraged the use of its potential the geometrical design of ANC systems to take account of more than one objective. This paper presents a combined approach to the selection and design pf a geometrical arrangement of system components for an ANC system. The aim of the control strategy is to obtain a broader zone of cancellation in the medium without neglecting the design criteria from a stability perspective. MOGA has been selected as the method to be used in this approach. Moreover, a comparative study is provided with single-objective GA in the same application.. 2. A BRIEF DESCRIPTION OF MULTIOBJECTIVE GENETIC ALGORITHM Multi-objective optimisation is a necessary element when attempting the optimisation of a number of functions at the same time. For example, as described in [1] , if there are n objectives fk , k=1, ..., n it is necessary to consider how to optimise the n objectives at the same time as a vector function f of variable x in a universe u , where f(x) = (f1 (x),..., fn(x)) (1) The defined problem most often has no absolute precise solution, but comes out as a set of non-dominated solutions, known as a Paretooptimal set. Dominance in a minimization problem is defined as follows: Definition 1 (Pareto dominance): A given vector u = (u1,…, un) is said to dominate v = (v1,…, vn) if and only if u is partially less than v (u < v), i.e, (2) Definition 2 (Pareto optimality): A solution xu ∈ U is said to be Pareto-optimal if and only if there is no xv ∈ U for which v = f(xv)=(v1,…, vn) dominates u = f(xu)=(u1,…, un). The concept of non-dominated solutions is the nearest to a solution for the problem of solving a number of objectives. A general view of multi-objective evolutionary optimization has been proposed by Fonseca and Fleming [1, 3, 4] and the nondominated classification of a GA population is used in MOGA. The optimization process is similar to a standard generational GA, but with multi-objective ranking, and with sharing and mating restrictions implemented in the objective domain [1]. The rest of the algorithm (selection, crossover and mutation) is the same as that in a standard GA. The algorithm flowchart is presented in Fig. 1 [5, 6]. The population is initialized and the chromosomes are decoded and evaluated. Then, the population is ranked and sorted according to the current preferences, and each individual is updated according to its degree of dominance. Fitness is assigned by re-ranking the population and performing fitness sharing based on the niche 74.
(3) International Journal of Integrated Engineering (Issue on Mechanical, Materials and Manufacturing Engineering). size determined earlier. Individuals on the Pareto front are non-dominated and assigned a ranking of one. Offspring are selected from the parental population according to fitness, and then reorganized so that pairs of future mates are, where possible, in the same niche. The fitness assigned to individuals with the same multiobjective rank is averaged, and fitness is shared within each rank before selection takes place. The new population is obtained by mutating the recombined offspring. This process is repeated until a satisfactory set of solutions is known or a given number of generations is reached. A detailed description of the MOGA process may be found in [1].. G and E in Fig. 2, may be found close to the origin, forming a non-dominated solution set. Individuals A, E, F and G are called non-dominated because no other individuals provide better performance in the objective space. On the other hand, individuals located far away from the origin, such as B, C and D, are called dominated solutions, since many individuals provide better performance than them in terms of both objectives. For example, individual A dominates individual B; similarly, B dominates C and C dominates D in the objective space in terms of the two objectives.. Fig. 2 Dominated and non-dominated solutions with rank values. 3. ACTIVE NOISE CONTROL STRUCTURE. Fig. 1 Flow chart of algorithm (MOGA process) Alam and Massoud [5, 6] described this process in a more straightforward way. They provide the results for a two-objective minimization problem, as in Fig. 2, where individuals that are closer to the origin are better than those further away from the origin. In the objective space, some individuals, such as A, F,. The formulation for an optimal cancellation controller has been derived and implemented in previous studies [7, 8]. In this work, the concept of parametric analysis of the field cancellation process is used. This is a frequency-domain analysis approach based on power spectral density functions. A schematic diagram of the geometric arrangement of the feedforward control structure (FFCS) with multiple source configuration used in this work is shown in Fig. 3(a). The waves emitted by n primary sources are detected by n detectors, placed at fixed distances relative to the primary and secondary sources. The detected signals are transferred to a controller for phase and amplitude adjustment. The processed signals are fed to a set of k secondary sources. The results of superposition between secondary signals and primary signals are observed at a set of k observation points. Fig. 3(b) is the corresponding block diagram of the FFCS, 75.
(4) International Journal of Integrated Engineering (Issue on Mechanical, Materials and Manufacturing Engineering). where E (s )(n × n ) , E (s )(n × n ) , E (s )(n × n ). and E (s )(n × n ) are matrices representing the transfer characteristics of propagation paths between the primary sources and detectors, secondary sources and detectors, primary sources and observers and secondary sources and observers respectively. E (s )(n × n ) , E (s )(n × n ) and. E (s )(n × n ) are matrices representing the transfer characteristics of the detectors, controller and secondary sources respectively.. Po (s )(1 × k ) ,. D(s )(1 × n ) , D(s )(1 × n ) ,. D(s )(1 × n ) ,. Po (s )(1 × k ) and. D(s )(1 × n ) are matrices representing the detected signals, primary signals at the primary source points, primary signals at the observation points, secondary signals at the secondary source points, secondary signals at the observation points and the superposition of primary and secondary signals at the observation points.. Fig. 4 Simplified block diagram of the FFCS where A(s)=E(s)M(s)C(s)L(s)[I-F(s)M(s)C(s)L(s)]-1 The objective of the FFCS is to reduce the level of noise to zero at the observation points. Analysing the system based on this objective leads to the required controller transfer characteristics as [8]: (3) where. is an n × n matrix given by (4). 4. DESCRIPTION OF THE PHYSICAL EXTENT OF CANCELLATION The interference of the component waves through the process of implementation of an ANC system will result in a pattern of zones of cancellation and reinforcement in the medium; a region of cancellation is created around each observation point and reinforcement will occur in regions further away from these points. The physical extent of zones of cancellation depends on the frequency of the noise involved and the separation between the sources. An investigation into the effects of system geometry on the physical extent of cancellation has been described in [8]. Consider that the implementation of controller transfer characteristics, C(s) in Fig. 3(b) is accurate as in (3), and the secondary signal S(s) is given as S(s) = P(s)A(s) . Substituting for C(s) from (3) into equation S(s) = P(s)A(s), using (4) and Fig. 3 Feedforward control structure. simplifying, with signal as. yields the secondary (5). Thus, Fig. 3(b) can be simplified as 76.
(5) International Journal of Integrated Engineering (Issue on Mechanical, Materials and Manufacturing Engineering). Consider that there are n primary the propagation medium under consideration are sources and k secondary sources emitting signal given by: waves in the medium. Let the result from the superposition of the primary and secondary waves at an arbitrary point q be denoted by (6) . In propagating through a distance of Rgq(i)(i = 1,2, …n), where the primary sources. where A is a constant, v is the speed of sound in result in waves at an arbitrary point q, the medium, Rgq(i)(i = 1,2, …n) is the distance of while in propagating through a distance Rhq(j) the acoustic path between the primary source and (j = 1,2, …k), the secondary sources result in the arbitrary point q and Rhq(j)(j = 1,2, …k) is the distance of the acoustic path between the secondary waves at the arbitrary point q. With source and the arbitrary point q. representing the radian frequency, let: The autopower spectral densities of the waves represented by Pq(s) and Oq(s) can be written matrix representing the wave as: emitted by primary sources in the frequency (7) domain, For cancellation of primary waves to occur matrix representing the wave at the arbitrary point q, the power spectral densities emitted by secondary sources in the frequency of the combined primary and secondary waves domain, should be less than that of the primary waves acting alone, as matrix representing the primary (8) waves at point q in the frequency domain, For a quantitative description of cancellation, matrix representing the observed the field cancellation factor K is defined as the ratio signal at point q in the frequency domain, to of the cancelled spectrum matrix representing the transfer the primary spectrum characteristics of the acoustic paths through arbitrary point [8], as: to the arbitrary point q, . that existed at the (9). matrix representing the transfer It follows from (8) and (9) that, for the characteristics of the acoustic paths through Rhq(j) primary waves to be cancelled, K must be between to the arbitrary point q, zero and unity: (10) the autopower spectral density of the where K = 1 means complete cancellation, K = 0 primary waves at the arbitrary point q, means no cancellation and K < 1 means that reinforcement occurs. the autopower spectral density of the from (5) into (7), Substituting for observed waves at the arbitrary point q. simplifying and using (9) yields the cancellation factor K at the arbitrary point q in the medium as: Elements of the transfer characteristics matrix. and. for. (11) Equation (11) gives a quantitative measure of the degree of cancellation achieved with the ANC 77.
(6) International Journal of Integrated Engineering (Issue on Mechanical, Materials and Manufacturing Engineering). system at the arbitrary point q under stationary conditions. A description of the pattern of zones of cancellation and reinforcement in the medium can thus be obtained by calculating the cancellation factor K for a given noise frequency. Geometry-related conditions involving separation between the sources and the location of a point in the medium at which cancellation is required are obtained. These lead to a description of cancellation in the medium. Thus (11) is useful in determining suitable geometrical arrangements of system components affecting cancellation in the propagation medium.. 5. STABILITY ANALYSIS As seen in Fig. 3, each detector gives a combined measure of the primary and secondary waves that reach the detection point. The secondary source radiation reaching the detector thus gives rise to acoustic feedback in this structure. Therefore, the closed loop formed by the detector, controller, secondary source and the acoustic path between the secondary source and the detector can cause the system to become unstable. A stability analysis of this loop is essential at the design stage. In this section, the stability condition is determined for a SISO and a SIMO ANC system only. From the block diagram in Fig. 3(b), the secondary signal S(s) can be written and simplified as: S(s)=[Pm(s)+S(s)F(s)]M(s)C(s)L(s)(12) where Pm(s) is the primary signal as measured at the detector. Simplifying this between Pm(s) and S(s) yields . (13). where X(s)= -M(s)C(s)L(s)F(s) (14) In order for the system to be stable, the denominator in (13) should have roots in the lefthand side of the s-plane. The stability analysis in this work is based on the Nyquist stability criterion, which uses a graphical polar plot of the open-loop transfer characteristic. Substituting C(s) from (3) into (14) and simplifying yields:. (15) To explore this further, and for reasons of simplicity, the system in Fig. 3(b) is considered within the SISO structure. Thus, (15) yields: Representing of. and phase. (16) with a magnitude. yields:. (17) Thus, in accordance with the Nyquist stability criterion, for the ANC system to be stable, the following situation should be true: (18) This can be expressed from to graphically by evaluating to form the polar plot. The direction of approach is the negative angle (clockwise) towards the axis on the polar plot of . If point lies on the left-hand side, then the system is considered to be stable, and vice versa. The design criterion in this work uses the concept of relative stability measurement, which is an acceptable method, using frequency response plots to provide gain and phase margins. The detailed derivation of the formula for finding the relationship between the stability of the system and the geometrical arrangement of the system components for a SISO ANC system has been reported previously [7].. 6. THE DESIGN PROBLEM Each ANC system is characterized by system source coordinates. The appropriate setting of such parameters is cast as the problem of optimizing a number of performance measures. In this study, a SIMO system is considered, and the design procedure described represents a step toward the design of a fixed controller. It shows how the concept of preference can be effectively explored 78.
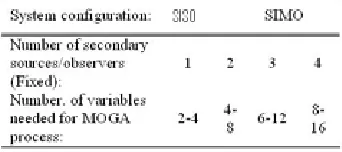
(7) International Journal of Integrated Engineering (Issue on Mechanical, Materials and Manufacturing Engineering). using an evolutionary technique such as the GA. The design objectives have been extracted from above description on the stability and the physical extent of the cancellation based on frequency domain measurements. Closed-loop stability: The stability of the closed-loop system is probably the most basic objective to be satisfied. The maximum value of should continue to be minimized below unity. This means that stability analysis is enhanced where a range of frequencies from f1 = 1 Hz to f500 = 500 Hz is involved. (19) The physical extent of cancellation in the medium: The cancellation factor K is measured in each segment of the medium and is generally independent from the maximum value of . The maximization of the cancellation zone is implemented as the minimization of the reinforcement area. This involves the concept of overlapping, since the values of K are counted for a range of frequencies from f1 = 1 Hz to f500 = 500 Hz. (20) c where XX represents the number of segments where reinforcement occurs, YY represents the numbers of segments along the X axis and ZZ represents the number of segments along the Y axis. The two objective functions, the multiobjective ranking algorithm and all GA routines were implemented as MATLAB in m - files and mex -files. The medium used in this work is 4 meters by 4 meters, segmented into smaller sections of 101 by 101 of area 40mm by 40mm each. Setting for the parameter, as used in this study, are crossover rate as 0.7, mutation rate as 0.001 and number of variables as between 2 and 16. Selection uses Baker’s stochastic universal sampling algorithm [9]. The settings are included as an example. The chromosomes are represented in binary form (0,1), with variables encoded into 16 bits mapped onto the chromosome. structure. Stochastic universal sampling is a singlephase sampling algorithm, which is optimal in terms of bias and spread. It minimizes the stochastic errors associated with roulette-wheel selection, and genetic drift [9, 3]. The recombination operator is used to exchange genetic information between pairs of individuals. The simplest recombination operator selected is that of single-point crossover. It is applied with the probability of 0.001, considered to be a background operator that ensures that the probability of searching a particular subspace of the problem space is never zero. Number of variables was selected so due to the arrangement of system components, which are as:. The MOGA process is implemented until certain termination criteria are satisfied.. 7. SIMULATION RESULTS Fig. 5 shows the performance result before applying MOGA, the convergence graph of the GA search process within the specified maximum number of 10 generations and the performance result achieved when MOGA was applied. These were evaluated with primary sources emitting single frequencies of 1 to 500 Hz and a population size of 10. Fig.6 shows the performance result before applying MOGA, the convergence graph of the GA search process within the specified maximum number of 22 generations and the performance result achieved when MOGA was applied. These were evaluated with primary sources emitting single frequencies of 1 to 500 Hz and a population size of 30. Both cases were evaluated with MOGA parameter options involving fixed number and location of primary source and detector, fixed numbers and locations of secondarysources and fixed number but randomly chosen observer locations of observers. The distance units are given in millimetres. The performance of the system is presented in contour line graphs, where cancellation is indicated in blue with Bode and Nyquist diagrams. In Fig. 5(a), an single input multi output 79.
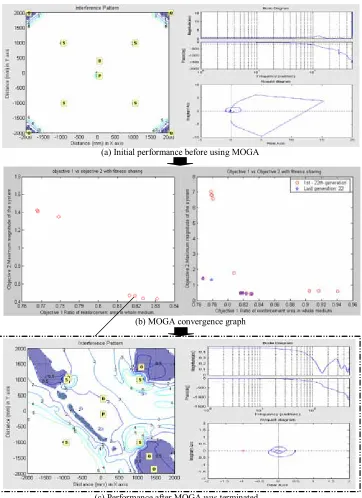
(8) International Journal of Integrated Engineering (Issue on Mechanical, Materials and Manufacturing Engineering). (SIMO) ANC system was set up on a 2-D coordinate system with one primary source at (-300,0), two secondary sources at (2000,0) and (2000,500) , one detector at (0,0), and two observers at (-200,-100) and (-200,100) , namely as Case 1. The initial results showed 99.49% reinforcement over the whole was 1.7. After using the MOGA for 10 generations as shown area, and the maximum value of in Fig. 5(b), the optimised coordinates found for the observer were at and , resulting in 82.01% reinforcement over the whole area, and the maximum value of was 0.5 (Fig. 5(c)).. (a) Initial performance before using MOGA. (b) MOGA convergence graph. (c) Performance after MOGA was terminated. Figure 5: Performance of Case 1 SIMO ANC under MOGA 80.
(9) International Journal of Integrated Engineering (Issue on Mechanical, Materials and Manufacturing Engineering). (a) Initial performance before using MOGA. (b) MOGA convergence graph. (c) Performance after MOGA was terminated. Figure 6: Performance of Case 2 SIMO ANC under MOGA. 81.
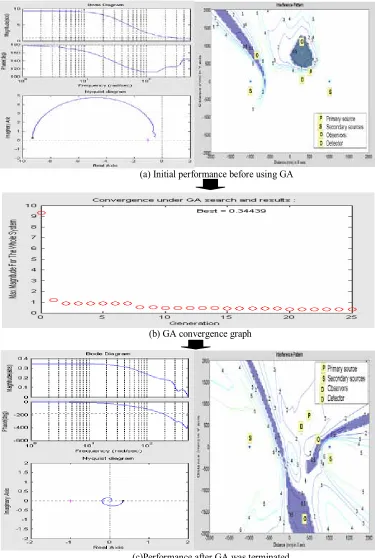
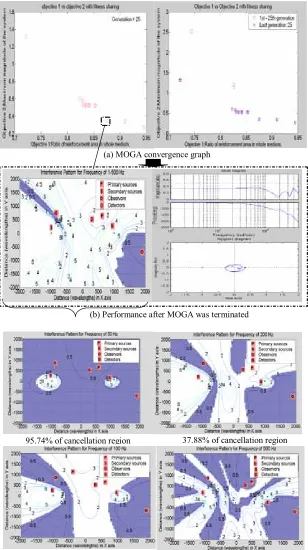
(10) International Journal of Integrated Engineering (Issue on Mechanical, Materials and Manufacturing Engineering). In Fig. 6(a), an SIMO ANC system was set up on a 2-D coordinate system with one primary source at , four secondary sources at (0,-100), (1000,1000), (1000,-1000) and (-1000,1000), (-1000,-1000) one detector at (0,400) and four observers at (2000,2000), (-2000,2000), (-2000,2000) and , namely as Case 2. The initial results showed 98.73% reinforcement over the whole was area, and the maximum value of over 15. After using the MOGA for 22 generations as shown in Fig. 6(b), the optimised coordinates found for the observer were at (1040,1407),(959,1078), (1381,-1854) and (1249,-1441), resulting in 81.91% reinforcement over the whole was area, and the maximum value of 0.46 (Fig. 6(c)).. 8. COMPARATIVE DISCUSSIONS Fig. 7 shows the performance results of the. SIMO ANC system arrangement based on physical extent of cancellation achieved in the medium. It shows the performance results before applying GA, the convergence graph of the GA search process and the performance results achieved when the GA was applied. The ANC system was set up on a 2-D coordinate system with a primary source at (500,500), two secondary source at (-1000,0) and (1000,0), one detector at (300, 300) and two observers at (-800, 500) and (300,800), namely as Case 3. Case 3 was optimized using singleobjective GA as a stability GA-ANC controlconfiguration. This stability GA-ANC control configuration is used to ensure the placement of the system components achieves an acceptable stability margin. The maximum magnitudes of is taken as a single objective function, which is defined as in (19). This case were evaluated with primary sources emitting a range of frequencies from 1 to 500 Hz, a maximum number of 25 generations and GA parameter options involving a fixed number and location of primary sources and detectors, a fixed number of secondary sources, fixed secondary source’s locations but randomly chosen observer’s locations. The initial results as in Fig. 7(a) show that the maximum value of was over 9 and. point -1 was on the right-hand side of the Nyquist diagram. The system will be basically unstable in this case. After the GA process was terminated, Fig. 7(c) show the maximum value of was 0.3444, found for an observers at (397,-1862) and (729,-20). As noted the system before using GA optimisation achieved cancellation over 4.74% of the medium and the system was unstable. After using GA optimisation to meet system stability requirements, it is noted that cancellation over 7.71% of the medium was achieved and the system was stable. The same configuration of system components was then optimized using MOGA. The objective function of MOGA process was to simultaneously minimise the magnitude of the closed-loop gain and the reinforcement region in the medium. As shown in Fig. 8(a), after using the MOGA for 25 generations, a set of 13 solutions was obtained. Selecting one of these as marked in Fig. 8(a), corresponding to optimized coordinates of the observation points as (-922,644) and (1958,466) , result in cancellation over 12.50% of the region within a set of overlapping frequencies from a range of 1 to 500 Hz (Fig. 8(b)), and the maximum magnitude of the closed-loop gain was 0.3499. Fig. 8(c) shows the interference pattern of cancellation and reinforcement area in the medium if it is segmented into separate single frequencies of 50, 100, 200 and 500 Hz. The performance thus achieved is better than that the 25th single-objective GA. The practical usefulness of MOGA is the ability to search and optimize multiple objectives: running the algorithm for much longer than ten generations, as provided by MOGA, could possibly give better results. Due to the considerable time required to run the function evaluation stage of the MOGA, it is recommended that it be run for acceptable objective values.. 82.
(11) International Journal of Integrated Engineering (Issue on Mechanical, Materials and Manufacturing Engineering). (a) Initial performance before using GA. (b) GA convergence graph. (c)Performance after GA was terminated. Figure 7: Performance of Case 3 SIMO ANC under single-objective GA 83.
(12) International Journal of Integrated Engineering (Issue on Mechanical, Materials and Manufacturing Engineering). (a) MOGA convergence graph. (b) Performance after MOGA was terminated. 37.88% of cancellation region. 95.74% of cancellation region. 40.01% of cancellation region 51.63% of cancellation region (c) Separate interference pattern based on different single frequencies. Figure 8: Performance of Case 3 SIMO ANC under MOGA 84.
(13) International Journal of Integrated Engineering (Issue on Mechanical, Materials and Manufacturing Engineering). 9. CONCLUSIONS. REFERENCES. The ANC system’s dependence on geometrical arrangements of system components and the frequency range of interest is critical in affecting the physical extent of cancellation and system stability. An analysis of the process of cancellation and the implications of system geometry on the physical extent of cancellation is carried out based on the geometrical design of ANC systems and the system design based on such laws may require complex approaches, depending on the application. Hence suitable approaches allowing automatic designs are favoured. GA is an effective way to optimize the geometrical arrangement of system components for desired physical extent of cancellation and system stability. The design and implementation of an ANC system using GA and MOGA has been presented and verified through simulated exercises. It has been shown that using minimum information specific to the system, which may be easily estimated using the system’s input and output, together with certain trial-and-error experiments, optimisation for good noise – control performance can be achieved using GA. However, enhancing the performance of an ANC system is a multiple objective optimization problem and GA is a single-objective optimization tool. This calls out for using MOGA which deals with many objectives simultaneously; also it can optimize different parameters at the same time. The application of the MOGA to ANC system design demonstrates the need for some degree of preference articulation in Pareto-based evolutionary optimisation, but the speed of execution then becomes an important concern. However the performance results of the system arrangement using MOGA thus achieved is much better than that using single-objective GA. MOGA could search and optimize multiple objectives; minimise the magnitude of the closed – loop gain and the reinforcement region in the medium, simultaneously in enhancing the physical extent of cancellation and providing a measure of relative stability in the ANC system structure. Due to the considerable time required to run the function evaluation stage of the MOGA, it is recommended that it should only be run to the extent that acceptable results are obtained.. [1]. [2]. [3]. [4]. [5]. [6] 85. C. M. Fonseca and P. Fleming, “Multiobjective optimization and multiple constraint handling with evolutionary algorithms Part 1: A unified formulation”, IEEE Transactions on System, Man and Cybernetics-Part A: Systems and Humans, vol. 128 (1), 1998, pp.26 – 37. R. C. Purshouse and P. J. Fleming, “The multiobjective genetic algorithms applied to benchmark problems – an analysis”, Research Report No. 769, Department of Automatic Control and System Engineering, The University of Sheffield, UK, August 2001. C. M. Fonseca and P. Fleming, “Multi objective optimization and multiple constraint handling with evolutionary algorithms - Part II: Application example”, IEEE Transactions on System, Man and Cybernetics-Part A: Systems and Humans, vol. 128 (1), 1998, pp.38 – 47. A. J. Chipperfield, R. Purshouse, P. J. Fleming, H. Thompson and L. Griffin, “Multi-objective optimization in control system design: An evolutionary computing approach”, IFAC World Congress 2002-Workshop, Barcelona, Spain, 20 Jun 2002, pp 1 – 53. R. Massoud, Intelligent control techniques for spring assisted FES-cycling, PhD Thesis, Department of Automatic Control and System Engineering, The University of Sheffield, UK, 2007. M. S. Alam, Genetic and swarm.
(14) International Journal of Integrated Engineering (Issue on Mechanical, Materials and Manufacturing Engineering). [7]. [8]. [9]. optimization algorithm for modelling and control of dynamic systems, PhD Thesis, Department of Automatic Control and System Engineering, The University of Sheffield, UK, 2007. M. O. Tokhi and R. R. Leitch, R. R., Active Noise Control, Clarendon Press, Oxford, UK, 1992. M. O. Tokhi and S. Veres, (Editors), Active Sound and Vibration Control: theory and applications, The Institute of Electrical Engineers, Michael Faraday House, Herts,UK, 2002. A. J. Chipperfield, P. J. Fleming, H. Pohlheim and C. Fonseca, Genetic Algorithm TOOLBOX: for use with MATLAB, The MATLAB Genetic algorithm Toolbox v1.2 User’s Guide. Department of Automatic Control and System Engineering, The University of Sheffield, UK. 1994.. 86.
(15)
Figure


+4
Related documents
The objective of this study was to evaluate the feasibility and acceptability of decision coaching guided by the Ottawa Family Decision Guide with children and parents
This unique quality of HRV/HRC analyses has led to interest in its application in pre-hospital triage and emergency clinical decision making; interest which has been bol- stered by
AIRWAYS ICPs: integrated care pathways for airway diseases; ARIA: Allergic Rhinitis and its Impact on Asthma; COPD: chronic obstructive pulmonary disease; DG: Directorate General;
It was decided that with the presence of such significant red flag signs that she should undergo advanced imaging, in this case an MRI, that revealed an underlying malignancy, which
In this cross-sectional analysis of participants from the Brazilian Longitudinal Study of Adult Health (ELSA- Brasil) [ 14 ], we hypothesized that NC could identify an
The scattergram represents the distribution with age of 69 determinations of concentration of potassium in serum of 39 premature infants with respiratory distress syndrome (Table
19% serve a county. Fourteen per cent of the centers provide service for adjoining states in addition to the states in which they are located; usually these adjoining states have
More specifically, can the federal govern- ment set standards of performance, encourage experi- mentation in the delivery o f health care, coordinate existing
