Journal of Chemical and Pharmaceutical Research, 2012, 4(4):2064-2069
Research Article
ISSN : 0975-7384
CODEN(USA) : JCPRC5
Simple and sensitive CE method for simultaneous determination of ofloxacin
and cefixime in their combined dosage form
Ahmed O. Alnajjar
Department of Chemistry, College of Science, King Faisal University, Al-Ahssa, Saudi Arabia
______________________________________________________________________________
ABSTRACT
In the current study, the first capillary electrophoresis (CE) method for the simultaneous determination of ofloxacin (OFL) and cefixime (CEF) in their combined dosage form was reported. Successful separation was achieved using 31.2 cm long × 50 µm I.D. fused-silica capillary, 10 mM phosphate electrolyte at pH 10, injection time 10.0 s, voltage 25 kV and column temperature 25 ◦C with photo diode array (PDA) detection at wavelength 254 nm. The validation criteria for accuracy, precision, linearity and limits of detection and quantitation were examined and discussed. An excellent linearity was obtained in concentration range from 5–200 µg/mL. The detection limits for OFL and CEF was 0.12 µg/ mL. The proposed method has been applied for the analysis of OFL and CEF both individually and in a combined tablet dosage form. The newly provided method enjoys the advantages of CE over HPLC with respect to rapidity, simplicity in reagents and sample preparation as well as saving in reagents and samples.
Keywords: Capillary electrophoresis (CE); Pharmaceutical analysis; Ofloxacin; Cefixime.
______________________________________________________________________________
INTRODUCTION
Capillary electrophoresis (CE) is an alternative resolving technique with some advantages over high performance liquid chromatography. CE has the combination of the benefits of high separation efficiency, rapid analysis time, ease of automation and low sample and solvent consumption [1]. Therefore, CE is an efficient analytical technique at pharmaceutical laboratories especially for routine assays.
Ofloxacin (OFL) is chemically known as (±)-9-fluro-2, 3 dihydro-3-methyl-10(4-methyl-1- piperazynyl-7-oxo-7H-pyrido [1, 2, 3-de]-1, 4- benzoxacine-6-carboxilic acid (Fig.1a). It is a broad spectrum antibiotic, which is one of the most frequently used fluorinated quinolone antibiotics. It is mainly used for the treatment of urinary tract infection and sexually transmitted diseases [2, 3]. Cefixime (CEF) is chemically known as (6R,7R)-7-[[2-(2-amino-1,3-thiazol-4-yl)-2 (carboxymethyloxyimino)acetyl]amino]-3- ethenyl-8-oxo-5-thia-1-azabicyclo[4.2.0]oct-2-ene-2-carboxylic acid (Fig.1b). It has broad and potent activities against various pathogens especially gram negative organisms. Its therapeutic uses include gonorrhea, tonsilitis, and pharyngitis [4,5]. OFL and CEF have been recently prepared in a combined dosage form for many bacterial infectionssuch as typhoid fever, urinary and respiratory tract infections, noscomial infections, soft tissue and intra abdominal infections.
The present work describes the first CE method for simultaneous separations and determination of OFL and CEF in their combined formulations. Sparfloxacin (SPA) (Fig.1c) was used as internal standard.
(a)
N N
H3C
N
O
CH3 F
O O
OH
(b)
N
S OH
N H N
S H2N
N O
OH
O
O
O O
H
(c)
N
OH
N
HN F
O O
Fig. 1. (a) Chemical structure of ofloxacin. (b) Chemical structure of cefixime. (c) Chemical structure of sparfloxacin, the internal standard.
EXPERIMENTAL SECTION
2.1 Chemicals, reagents and samples
All chemicals and reagents used in this study were of analytical grade. OFX and CEF were purchased from Sigma-Aldrich (St. Louis, MO, USA). Methanol, hydrochloric acid, phosphoric acid, sodium hydroxide and sodium phosphate were supplied from Merck (Darmstadt, Germany). Zenflox Plus® tablets (containing 200 mg OFL and 200 mg CEF) were prepared by Akums Drug & Pharmaceuticals Ltd. (Ranipur, India). Tarivid® (200 mg OFL) and Winex® (200 mg CEF) were obtained from local stores.
2.2 Instrumentation and Operating conditions
[image:2.595.213.397.109.523.2]water for 1 min, and finally by the background electrolyte for 2 min. This was done to equilibrate the capillary. The capillary was stored overnight filled with water.
2.3 Stock and Standard Solutions
OFL and CEF standards were stored at 4°C protected from light to minimize photolytically induced degradation. Standard stock solution (1000 µg/mL) of OFL and CEF were prepared in water and was kept refrigerated. Working standard solutions were prepared daily by diluting the suitable aliquots of the stock solution with running buffer in 1:1 ratio. The standard solutions were stored in brown glass vials for light protection . Standard stock solution (1000
µg/mL) of sparfloxacine (IS) was prepared in methanol and kept refrigerated.
2.4 Preparation of Pharmaceutical Sample
Twenty tablets were weighed, ground and mixed. An appropriate amount of the powder was taken and dissolved with water in 100 mL volumetric flask to yield 500 µg/mL concentration. The solution was filtered through a 0.45 mm PTFE membrane filter. The filtered solution was diluted with running buffer to yield different concentrations of OFL and CEF. Thereafter, the solution was introduced to the CE system for separation.
RESULTS AND DISCUSSION
3.1 Preliminary Investigation
Spectrum scan for OFL and CEF were performed individually in a range of 190-400 nm using a PDA. It has been found that the λmax for OFL and CEF is 254, which was set for detection with CE.
In order to significantly reduce the injection-related impression and to ensure better reproducibility and greater control over the sample amount injected, the use of IS in quantitative analysis is generally preferred [1]. Ciprofloxacin, sparfloxacin and norfloxacin were added to the mixture of OFO and CEF. Limited resolution was obtained for ciprofloxacin and norfloxacin. A complete recognition of resolution was obtained with sparfloxacin, the structure of which is shown in Fig. 1c with a satisfactory analysis time.
3.2 Optimization of Separation Conditions 3.2.1 Effect of pH
A better understanding of the influence of various experimental parameters is essential in predicting the migration behavior of individual solutes in a mixture and, consequently, in optimizing their separation. In electrophoretic separation of ionizable compounds, pH plays an important role as it determines the extent of ionization of each individual solutes [1]. Buffer acidity may affect mobility and electroosmosis flow (EOF) by changing the dissociation constant of analyte and Si–OH groups on the capillary. The effect of pH on the resolution and migration time was investigated over the pH range of 2.5–10.0, using 10 mM buffer solution. At pH 8.0, the mixture of OFL and CEF started separation. However, with increasing pH the two active ingredients separated more efficiently. At pH 10.0, the compounds migrated faster due to increasing EOF. Based on the result obtained, pH 10.0 was chosen as the optimal pH for the separation of the two analytes.
3.2.2 Effect of Buffer Concentration
The buffer composition also affects the separation efficiency, baseline stability and peak shape. In this study, a new set of experiments was proposed taking into account phosphate concentration . The examined levels ranged from 10 to 100 mM. Symmetrical peaks were observed at 10 mM but were broadened when the buffer concentration was 25 mM. However as expected peak tailing was observed when the buffer concentration changed from 50 to 100 mM. There was an increase in analyte migration times due to a decrease in EOF with increasing buffer concentration. Hence, 10 mM buffer was selected to achieve good resolution without sacrificing the migration time.
3.2.3 Effect of Separation Voltage
It is well known that increasing the voltage shorten migration times. However, the generation of Joule heating may limit the resolution and efficiency when the voltage is increased [1]. In this study, voltages between 15 and 30 kV were investigated. A decrease in migration times for both analytes was observed from 15 to 30 kV. The voltage of 25 kV was chosen because there was an adequate resolution of the two analytes and the signal-to-noise ratio was satisfactory.
3.2.4 Effect of Injection Time and Capillary Temperature
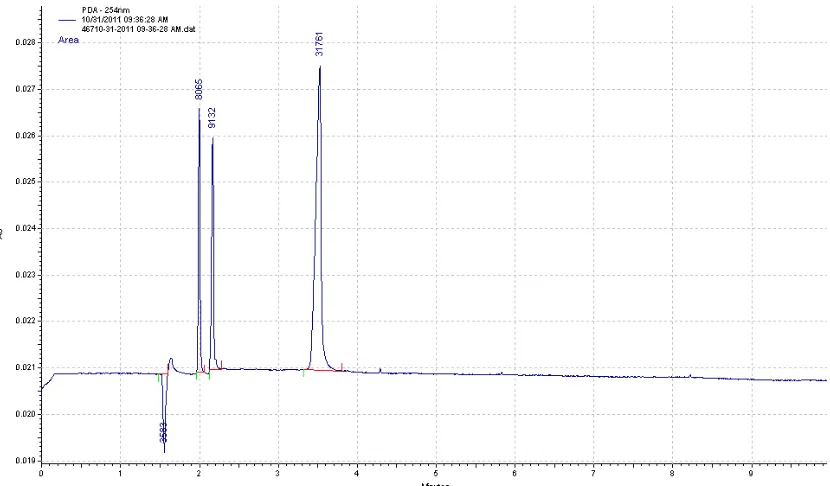
conditions are summarized in Table 1. Fig. 2 shows the electropherogram of OFL and CLF separated under those optimized conditions.
Fig. 2. Typical electropherogram of the separated compounds under the optimized conditions, were peak 1 is sparfloxacin (IS); peak 2 is ofloxacin and peak 3 is cefixime. Conditions as
[image:4.595.100.515.115.358.2]describe in Section 2.2
Table 1. Optimum CE operating conditions
Parameters Conditions
Electrolyte 10 mM sodium phosphate dibasic heptahydrate adjusted to pH 10 with phosphoric acid Applied Voltage 25 kv
Sample injection 10 s hydrodynamically Capillary temperature 25°C
Fused silica capillary 31.2 cm long × 50 µm i.d. Detection wavelength 254 nm
3.3 Method Validation 3.3.1 Linearity
The linearity of the analytical procedure was evaluated by plotting peak area vs. the concentration of OFL and CEF present in the mixture of standard solutions. Each calibration curve was constructed using six standard solutions (5, 10, 25, 50, 100 and 200 µg/mL) and spiked with 25 µg/mL of internal standard, performed in triplicate. The correlation coefficient for the two analytes was ≥ 0.9995 over a relatively wide concentration range (5–200 µg/mL). The linear regression equations obtained were as follows:
OFL: y = 0.0395C + 0.1178 CEF: y = 0.0683C + 0.1199
3.3.2 Precision
Intra-day precision was assessed by injecting three standard mixtures of OFL and CEF at different concentrations (10, 100 and 200 µg/mL). As shown in Table 2, the relative standard deviation (RSD) for migration times and peak areas were less than 0.94 and 0.83 %, respectively, The inter-day precision was assessed with standard mixture containing both drugs at 10, 100 and 200 µg/mL. The validation of the analytical procedure was performed over a period of 7 days. The relative standard deviations were less than 2.2 for migration time and corrected peak areas.
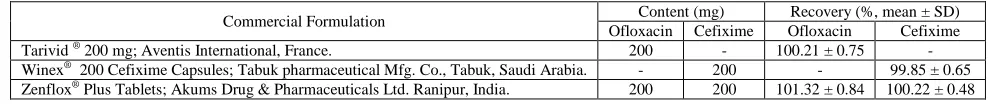
3.3.3 Accuracy/recovery
calculation. In general, the recovery of both drugs in their formulations was in the range of 99.85-100.21 % indicating acceptable accuracy of the proposed CE method.
3.3.4 Limit of Detection
In this study, the limit of detection (LOD) was determined based on the standard deviation of the response, σ, and the slope of the calibration curve, S. The LOD can be expressed from the following equation:
s
LOQ
=
3
.
3
σ
Based on the standard deviation of the blank measurement, the magnitude of analytical background response was performed by analyzing an appropriate number of blank samples, i.e. 10 [1]. Calculation of standard deviation, σ, was performed from the responses. From the result, the LOD for both OFL and CEF was 0.12 µg/mL.
3.3.5 Limit of Quantification
In this study, the LOQ was determined based on the standard deviation of the response, σ, and the slope of the calibration curve, S. The LOQ can be expressed from the following equation:
s
LOQ
=
10
.
0
σ
[image:5.595.159.453.397.508.2]Based on the standard deviation of the blank measurement, the magnitude of analytical background response was performed by analyzing an appropriate number of blank samples, i.e. 10. Calculation of the standard deviation, σ, was performed from the responses. From the result, the LOQs calculated were 0.4 and 0.7 µg/mL, for OFL and CEF, respectively.
Table 2. Intra- and inter-day reproducibility for the repeated injection of different concentrations of both ofloxacin and cefixime
RSD% (corrected peak areas) RSD% (migration time)
Concentration µg/mL Cefixime Ofloxacin Cefixime Ofloxacin
Intra-day precision(n= 15)
0.6 0.40 0.72 0.40 10 0.72 0.62 0.94 0.62 100 0.83 0.65 0.81 0.71 200
Inter-day precision (n= 105)
1.5 1.2 1.4 1.1 10 2.1 1.7 2.0 1.8 100 1.8 2.0 2.2 1.9 200
Table 3. Recoveries obtained from the determination of ofloxacin and cefixime in commercial formulations
Commercial Formulation Content (mg) Recovery (%, mean ± SD) Ofloxacin Cefixime Ofloxacin Cefixime Tarivid ® 200 mg; Aventis International, France. 200 - 100.21 ± 0.75 -Winex® 200 Cefixime Capsules; Tabuk pharmaceutical Mfg. Co., Tabuk, Saudi Arabia. - 200 - 99.85 ± 0.65 Zenflox® Plus Tablets; Akums Drug & Pharmaceuticals Ltd. Ranipur, India. 200 200 101.32 ± 0.84 100.22 ± 0.48
CONCLUSION
A new CE method for the simultaneous determination of OFL and CEF in pharmaceutical tablet formulations is described and validated. The adopted method is fast, accurate, precise, reproducible and inexpensive. Several variables were studied and the optimized CE conditions were as follows: 10 mM phosphate buffer adjusted to pH 10.0 with phosphoric acid; applied voltage 25 kV; capillary temperature 25°C; and injection time 10 s. The analytes were detected at 254 nm. Therefore, the CE method is suitable to be applied to industrial-scale pharmaceutical analysis for the purpose of quality control or as a complementary technique to traditional methodologies.
Acknowledgements
[image:5.595.57.551.539.591.2]REFERENCES
[1]K.D. Altria, Capillary Electrophoresis Guidebook, Humana Press, Totwa, New Jersy, 1996. [2]N Ichihara; H Tachizawa; M Tsumura; T Une; K Sato, Chemotherapy (Tokyo)., 1984,(32),118-149.
[3]D C Hooper, S WolfsonJ. Mechanisms of quinolone action and bacterial killings. Quinolone Antimicrobial Agents (2nd ed.), American Society for Microbiology, Washington D.C., 1993;1:53-57.
[4]A McMillan; H Young, Int J STD AIDS., 2007;18(4), 253-254.
[5]G Zhao; MJ Miller; S Franzblau; B Wan; U M llmann, Bioorg. Med. Chem. Lett.., 2006,16(21), 5534-5537.
[6]KB Vinay; HD Revanasiddappa; MR Divya; N Rajendraprasad, Eclectica Quimica., 2009,34, 65-78.
[7]J Shah; M Jan; S Shah, J FLUORESC., 2010:1-7.
[8]B Nausheen; AA Al-Warthan; SM Wabaidur; ZA Othman; M Javid; S Haider, Sensor Letters., 2010, 8, 280-284.
[9]K Kaur; B Singh; AK Malik, Thai J. Pharm. Sci., 2010, 34, 58-66.
[10]HJ Kraemer; R Gehrke; A Breithaupt; H Breithaupt, J Chromatogr B Biomed Sci Appl., 1997, 700(1-2), 147-53.
[11]P Hemendra; K Sourabh; S Chandra; M S Ranawat; A D Ankalgi, J. Chem. Pharm. Res., 2010, 2(4), 984-992.
[12]D Zendelovska; T Stafilov; P Miloševski, Bulletin of the Chemists and Technologists of Macedonia., 2003, 22(1), 39-45.
[13]A Espinosa-Mansilla; P AMdl; DG Gَmez; F Salinas, J Chromatogr B., 2005, 822(1-2), 185-193.
[14]M Garcia; C Solans; A Calvo; M Royo; E Hernandez; R Rey; M Bregante, Chromatographia., 2002, 55(7), 431-434.
[15]T Ohkubo; M Kudo; K Sugawara, J Chromatogr B: Biomedical Applications., 1992, 573(2), 289-293.
[16]V V Pisarev; K V Zaĭtseva; L B Smirnova; V G Belolipetskaia; D A Kibal'chich, Antibiot Khimioter., 2009, 54(7-8), 37-40.
[17]Y Gaillard; G Pepin, J Chromatogr A 1997, 763(1-2), 149-63.
[18]V Madhura; S J Dhoka; D SC Sandage, J. Aoac Int., 2010, 93(2), 531-535.
[19]T Wen-yan; Q Zhen-yu; Z Heng, J Chinees. Mass Spectrom., 2008, 29, 211-212.
[20]H-B Lee; TE Peart; ML Svoboda, J Chromatogr. A., 2007, 1139(1), 45-52.
[21]F Meng; X Chen; Y Zeng; D Zhong, J Chromatogr. B., 2005, 819(2), 277-282.
[22]M Hernández; F Borrull; M Calull, J. Chromatogr. B: Biomed. Scie. Appl., 2000, 742(2), 255-265.
[23]S Honda; A Taga; K Kakehi; S Koda; Y Okamoto, J. Chromatogr. A., 1992, 590(2), 364-368.
[24]Y M Liu; Y M Shi; Z L Liu, Biomed. Chromatogr., 2010, 24(9), 941-947.
[25]KL See; A A Elbashir; B Saad; ASM Ali; H Y Aboul-Enein, Biomed. Chromatogr., 2009, 23(12), 1283-1290.
[26]C Horstkِtter; G Blaschke, J. Chromatogr. B: Biomed. Scie. Appl., 2001, 754(1), 169-178.
[27]K D Gite; S R Tajane; D D Shah; A R Choudhari; V P Kuchekar, Der Pharma Chemica., 2011, 3 (3), 397-403. [28]A Kumar; S Nanda; R Chomwal, J. Chem. Pharm. Res., 2011, 3(5), 705-709.