Pressure drop prediction of square cell honeycomb monolith structure
5
0
0
Full text
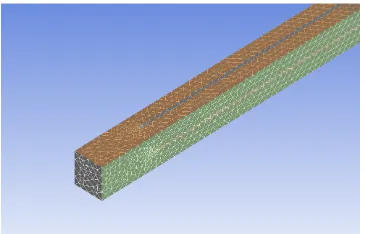
(2) 2011 International Conference on Environment Science and Engineering (ICESE 2011). Figure 1.. values from the beginning of monolith until its end. This technique is primarily focused on heterogeneous chemical reaction in which the prediction of temperature and concentrations within the entire catalytic converter is obtained based on a complex combination of the properties of the gas and solid parts. Such effects cannot be predicted by single channel method and provides better accuracy compared to single channel [12]. This paper proposes the adapted sub-grid scale modeling to predict the pressure drop of square cell shape honeycomb monolith structure in exhaust aftertreatment application. This method offers closer approximation in pressure loss prediction compared to established technique with additional advantages of fewer elements which reduces the computing cost. Beginning from the next section, this paper is organized as follows: Section II describes the geometry, computational domain, meshing and boundary conditions of the model. Section III discusses the results of the Computational Fluid Dynamics (CFD) calculation including grid independence study and comparison with the experiment and other models and finally, the paper is concluded in Section IV.. Single channel modeling [8].. the calculations; if each channel is represented by a 10 x 10 x 100 cells, modeling all the channels produce millions of cells which will take tremendous computational efforts and high cost to solve it. As a result, modeling of honeycomb monolith is rather complicated due to the massive numbers of channels. Since honeycomb material is a unitary structure with uniform-sized and parallel channels, it is available in various channel shapes and dimensions including hexagon, square, sinusoidal, triangular and circle. Macroscopic modeling of catalytic activities is seen to be limited to a single channel of the substrate monolith. It is valid by considering the velocity profile is uniform at the inlet face of the monolith sample (it is assumed that flow maldistribution does not occur when the exhaust gas enters a substrate from the diffuser). Individual channels are separated from each other in term of mass transfer, hence provides information to the pressure loss, heat and mass transfer and chemical behavior of the catalyst. Single channel method of analysis are seen to be employed by many previous researchers [6][7][8][9][10]. Fig. 1 displays a concept of single channel modeling of a circular substrate with a square cell shape. The increasing needs of design and optimization of the full scale catalytic converters requires further modeling techniques to be improved. Sub-grid scale modeling (Fig. 2) had been used to predict the temperature and concentration. II.. METHODOLOGY. A. Computational Domain The geometry of honeycomb monolith structure employed in this study was square shape with 600 cpsi/4.5 mil (cpsi is cells per square inch and 4.5 mil (0.114 mm) is. Figure 2. Sub-grid scale modeling [11].. Figure 3. Adapted sub-grid scale modeling applied on square-cell honeycomb.. of a catalytic combustion in a full scale catalytic converter [11]. The simulation had provided certain pressure drop. TABLE 1. GEOMETRY OF SINGLE CHANNEL [8] AND SUB-GRID SCALE MODELING. 282.
(3) 2011 International Conference on Environment Science and Engineering (ICESE 2011). Sub-grid scale Single channel. modeling. Cell shape. Square. Square. A (mm). 0.950. 1.064. B (mm). 0.950. 1.064. Cell length (mm). 118. 118. Figure 5. Meshing of square cell-shape using sub-grid scale modeling.. The fluid properties of air used in this model was given in Table 2. A three dimensional (3D) steady state incompressible solution of the Navier-Stokes was performed using ANSYS CFX. The equations involved are outlined in (1) and (2). During the solver definition, upwind advection scheme was used and the convergence criteria mentioned residual type as Root Mean Square (RMS) with residual target was set on 1x10⁻⁵.. Parameters. Cell density (cpsi). 600. 600. Wall thickness (mm). 0.114. 0.114. the wall thickness). The domain was built using the approach adapted from sub-grid scale modeling [12] as in Fig. 3. Instead of considering single channel only [8], this method utilizes four channels which were taken into account simultaneously its inlet and outlet length. Its geometrical difference in domain set up was compared to single channel method and tabulated in Table 1. Fig. 4 shows the actual domain with solid T- shaped represent the wall thickness of honeycomb structure. Unstructured Tri-Mesh (0.2 mm spacing) with 121,718 elements was depicted in Fig. 5.. The Continuity Equation [14]. ∂ρ + ∇ • ( ρU ) = 0 ∂t. (1). The Momentum Equation [14]. B. Boundary Condition. ∂ρU + ∇• (ρU ⊗U) = ∇• (−pδ + μ(∇U + (∇U)T ))+ SM ∂t. Inlet was defined as its flow regime in subsonic, assumed of uniform velocity in 5 m/s and air inlet temperature at 20 o C (293 K). Air inlet temperature was selected based on the experimental and numerical condition conducted by Miyairi et al. [8]. As the simulation proceeds, the velocity was changed to 10, 15 and 20 m/s. Pressure outlet was set at atmospheric pressure. The wall was defined as no slip condition and the temperature was fixed at 100 oC (373 K).. (2). C. Validation Pressure drop calculation was performed on the honeycomb structure with the cell density, wall thickness and length stated in Table 1. At 5 m/s inlet velocity, the TABLE 2. AIR PROPERTIES AT 20 OC AND 1 ATMOSPHERE IN BOUNDARY CONDITION Thermodynamic properties (unit) Molar mass (kg/mol) 3. Figure 4. Actual domain of square-cell using sub-grid scale modeling.. 283. Properties 28.96. Density (kg/m ). 1.205. Specific heat capacity (J/kg.K). 1005. Dynamic viscosity (kg/m.s). 18.207x10⁻⁶. Thermal conductivity (W/m.K). 0.0257.
(4) 2011 International Conference on Environment Science and Engineering (ICESE 2011). Figure 6. Grid independence study for square-cell shape using sub-grid scale modeling.. Figure 7. Comparison of pressure drop for square-cell using different technique.. calculated results were compared to the experimental data as in [8]. The difference was calculated using Root Square (RS) and RMS shown in (3) and (4). The difference was tabulated in percentage. The same steps was applied for 10, 15 and 20 m/s of inlet velocity.. ⎛ X sim − X exp Root Square (RS) = ⎜ ⎜ X exp ⎝. 2. ⎞ ⎟ % ⎟ ⎠. (3). 1 i =n ∑ RS i % n i =1. (4). where Xsim: Calculated data Xexp: Experimental data Root Mean Square (RMS) = where. illustrates the experimental and calculated pressure drop for different velocity and mesh density. Small deviation of pressure drop values compared to the experiment indicates the reliability of the meshing scheme to be employed further. The calculation achieves the grid independence result between 121,718 and 150,744 with mean deviation ranges between 1.14 to 5.15 %. RMS difference for each set of data at each particular velocity exhibits the consistency of computed pressure loss compared to the values from the experiment. Preferred mesh density is selected by obtaining the best fit of predicted pressure drop to the experimental data. Therefore, the lowest mean difference chosen is 5.14 % representing the mesh density 121,718. This meshing scheme is selected to be used further in the simulation. The present work is validated by comparing the simulation results from the preferred meshing to the experimental data and numerical work conducted by Miyairi et al. [8]. Table 3 shows the mean RMS difference of the present simulated results is 5.14 %.. n: number of data III.. RESULTS AND DISCUSSION. Grid sensitivity tests were conducted using the same geometry of the experiment by Miyairi et al. [8]. Fig. 6 TABLE 3. VALIDATION FOR SQUARE CELL SHAPE. Air velocity (m/s) 5 10 15 20. Miyairi et al. (2003) Experiment Simulation RS Pressure Pressure difference drop (Pa) drop (Pa) (%) 417 476 14.16 857 987 15.10 1339 1527 14.00 1857 2132 14.78 RMS difference 14.51 (%). Present work Computed RS Pressure difference drop (Pa) (%) 400 4.00 806 5.97 1266 5.47 1762 5.12 RMS difference 5.14 (%). 284. Figure 8. Parity chart of correlation between simulation and experimental pressure drop..
(5) 2011 International Conference on Environment Science and Engineering (ICESE 2011). [1]. Compared to the previous numerical work [8], it exhibits higher deviation with mean RMS difference is 14.51 %. Fig. 7 shows the comparison of all models including Ekstrom and Andersson [7] and the established Darcy equation [4]. It was found that deviation of these two models compared to the experiment is higher which are 19.41 and 22.73 % respectively. The present method of prediction exhibits higher accuracy up to 5 % deviation from the actual experiment. A parity chart is also plotted in Fig. 8 showing that the present numerical work is in good agreement with the experimental data. Evidently, the present numerical approach has its advantage in predicting the pressure drop across the square cell-shape channel. It shows that the sub-grid scale modeling is a better approach in giving good results compared to single channel approach and other available models as indicated in Fig. 7. Its advantage is highlighted in terms of computational cost (lower number of cells and computing time) and accuracy (lower difference in pressure drop compared to the experiment). It only employs up to 150,000 elements for square-cell compared to 300,000 to 500,000 elements using single channel method. IV.. [2] [3]. [4] [5]. [6]. [7]. [8]. [9]. [10]. CONCLUSION [11]. The sub-grid scale model approach gives better agreement in pressure drop compared to the numerical work using single channel approach. This present method also possesses lower computational cost based on the less computing time and number of elements in the simulation.. [12]. [13] [14]. ACKNOWLEDGMENT The authors would like to thank the Ministry of Higher Education, Malaysia for supporting this research under the Fundamental Research Grant Scheme (FRGS) VOT 0729. REFERENCES. 285. G.M Pannone and J.D Mueller, “A comparison of conversion efficiency and flow restriction performance of ceramic and metallic catalyst substrate,” SAE International, 2001-01-0926, 2001. M. Lashmikantha and M. Keck,“Optimization of exhaust systems,” SAE International, 2002-01-0059, 2002. R.A. Searles, “Contribution of automotive catalytic converters,“ in Hans Bode. “Material aspects in automotive catalytic converters,” Germany: Wiley-VCH, pp. 3-16, 2002. F.M. White, “Fluid Mechanics.” Singapore: Mc-Graw Hill, Inc. 295334. 2003. M. Luoma, M. Harkonen, R. Lylykangas and J.Sohlo, “Optimisation of the Metallic Three-Way Catalyst Behaviour.” SAE International. 971026. 1997. E. Abu-Khiran, R. Douglas, and G. McCullough, ”Pressure loss characteristics in catalytic converters,” SAE International, 2003-320061, 2003. F. Ekstrom and B. Andersson,“Pressure drop of monolythic catalytic converters experiments and modeling,” SAE Internationals, 2002-011010, 2002. Y. Miyairi, T. Aoki, S. Hirose, Y. Yamamoto, M. Makino, S. Miwa, and F. Abe, ”Effect of Cell Shape on Mass Transfer and Pressure Loss.” SAE International, 2003-01-0659, 2003. T.Shamim and H.Shen, “Effect of geometric parameters on the performance of automotive catalytic converters,” International Journal of Science and Technology, 14, pp. 15-22, 2003. L. Andreassi, S. Cordiner and V. Mulone, “Cell shape influence on mass transfer and backpressure losses in an automotive catalytic converter,” SAE International, 2004-01-1837, 2004. O. Deutschmann, L. I. Maier, U. Riedel, A.H. Stroemann and R.W. Dibble, “Hydrogen assisted catalytic combustion of methane on platinum, “ Catalysis Today. 59, pp. 141-150, 2000. S. Mazumder and D. Sengupta,“Sub-grid scale modeling of heterogeneous chemical reactions and transport in full-scale catalytic converters,” Combustion and Flame. 131. 2002. Manual of ANSYS CFX , 2005. Abu-Khiran, E., Douglas, R. and McCullough, G. (2003). ”Pressure Loss Characteristics in Catalytic Converters. ” SAE International. 2003-32-0061..
(6)
Figure
![Figure 2. Sub-grid scale modeling [11].](https://thumb-us.123doks.com/thumbv2/123dok_us/8778326.902724/2.595.91.270.558.680/figure-sub-grid-scale-modeling.webp)
Related documents
The National School of Government will be an important enabler to the implementation of human resource development/training policy in the Public Service through the provision
Inhibition of XPO1 by selinexor (KPT-330), an oral Selective Inhibitor of Nuclear Export (SINE) compound, leads to nuclear accumulation of tumor suppressor proteins (TSPs), cell
It is submitted that in the event sub-paragraph (4) and (5) occurred, the licensed family takaful operator shall refer to Schedule 10, Section 142, (Paragraph 3(1)) of the
The purpose of this research was to evaluate the usability of King Khalid University (KKU) website to determine the users’ effectiveness, efficiency, and satisfaction as well as
National University of Colombia at the Institute of Genetics through the IBRO’s Latin America 256. Regional Committee (LARC) short research training grant.
This panel study, which has followed the adult respondents for a long period (1994 – 2013), provides empirical evidence in subscribing to the fact that (1) the in-country average
The econometric analysis was used to test the hypothesis of the relationship between micro enterprise profit and micro microcredit and other performance variables
