A study of the durability of OPC vs. GGBS concrete
on exposure to silage effluent.
S. Pavía and E. Condren
Department of Civil, Structural and Environmental Engineering. University of Dublin, Trinity College Dublin.
ABSTRACT:
Ordinary Portland cement (OPC) has been traditionally used in the construction of concrete silos in Ireland. However, the aggressive nature of the effluent produced by silage leads to severe degradation of the concrete. GGBS is a common addition to PC composites. It has been demonstrated that GGBS improves the general performance of PC concrete decreasing chloride diffusion and chloride ion permeability; reducing creep and drying shrinkage; increasing sulfate resistance; enhancing ultimate compressive strength and reducing heat of hydration and bleeding. It has also been suggested that GGBS may increase concrete durability in the aggressive environment of silos. In order to investigate this theory, a simulation study was carried out by immersing samples of mortars incorporating increasing amounts of GGBS in a silage effluent solution and a magnesium sulphate solution. Over the course of an experiment consisting of three, 28-day cycles of immersion in the silage effluent, the sample performance was evaluated by testing permeability, porosity, water absorption, capillary suction, compressive strength and mass loss. According to the results obtained, the OPC samples suffered the highest rise in permeability and porosity and the greatest loss in both mass and compressive strength. In addition, the durability of the mortars, when subjected to both salt crystallisation and silage effluent cycles, increased with increasing amounts of GGBS. The significant rise in capillary suction, water absorption and permeability over the course of the experiment indicates that the damage induced by the effluent is not as superficial as previously reported. Loss in mass and increase in permeability were found to be the most reliable indicators of corrosion as they gave the most dramatic and uniform results.INTRODUCTION
Grass conserved as silage for winter feed is vital for livestock production. One of the storage systems most commonly used consists of unwilted silage in horizontal concrete silos. Last year, in the Republic of Ireland, 25 million tonnes of silage were produced. In turn, this silage produces about 140 litres of effluent per tonne (Irish Dept. of Agriculture, Food and Forestry 1985). Proper management and containment facilities for this effluent are vital as it contains lactic and acetic acids having an acidic pH ranging from 2.5 to 4.5 and a Biochemical Oxygen Demand (pollution potential) of up to 200 times that of raw domestic sewage (Sangarapillai 1993). Pollution caused by silage effluent not only results in acute environmental damage and killing of aquatic life but can also cause a loss of revenue for the fishing and tourism industries.
repairing silos costs the agricultural industry vast sums of money. In Ireland, silage silos are grant-aided under the Farm Waste Management scheme. In 2005, €5 million was spent on repairs to silage facilities in response severe corrosion (Irish Dept. of Agriculture and Food Statistics Office 2005). Therefore, the development of a more durable concrete for use in silage facilities is of paramount importance.
Blastfurnace slag (BS) is a by product of the steel industry. It results from the combination of iron ore with limestone flux and is obtained from the manufacture of pig iron in a blastfurnace. When BS is quenched by water it forms a glassy material known as granulated blastfurnace slag (GBS). In contact with water, GBS possesses hydraulic properties. However, the rate of reaction is slow and needs alkalis and sulphates to activate. When mixed with PC, as PC hydrates it releases alkalis and sulphates which serve as a activators for the GGBS.
The final properties of GGBS concrete are determined by the pozzolanic efficiency and hydraulic activity of the GGBS which control the amount of cement produced and the reactivity of the slag. These depend on the reactive glass content, the chemical and mineralogical composition, type of activator and fineness of GGBS (Ganesh Babu and Rama Kumar 2000). GGBS has the same constituents as Portland cement but in different amounts (Table 1). In general, the more basic slags are, the greater their hydraulic activity in the presence of alkalis. Swamy (1986) has suggested that at constant basicity, strength of concrete increases with the Al2O3 content. Additionally, it has been observed by Frearson (1986) that
hydraulic activity is enhanced with an increase in Al2O3, CaO and MgO while an increase in
SiO2 diminishes hydraulic activity. To ensure high alkalinity, without which slag would be
hydraulically inactive, European Standard ENV 197-1:1992, recommend that the ratio of CaO + MgO to SiO2 exceeds 1.
Table 1. Chemical Composition of GGBS and OPC after Bakherev et al. 2003; Jianyong and Yan 2001; Higgins 2003. ______________________________________________
It has been demonstrated that roves the general e of PC composites g chloride diffusion and chloride ion permeability (Luo et al. 2003, Yun Yeau and
Kim 2005); reducing p and drying shrinkage yong and Yan 2001);
sing sulfate resistance (Higgins 2003, Binici and 006); enhancing the ultimate compressive strength (Barnett et al. 2006) and reducing the heat of hydration and bleeding (Wainwright and Rey 2000). GGBS also improve concrete workability due to its high specific surface, marketed at 375-435 m3/kg with a fineness of approximately 460 Blaine (m2/kg.min). This makes GGBS finer than PC (typically, PC is approximately 300 m3/kg). According to Swamy (1986) this leads to increased workability and a better performance in bleeding, setting times and heat evolution.
Chemical Analysis % Portland cement GGBS ____
GGBS imp performanc decreasin
Kyum cree (Jian increa
Aksogan 2
SiO2 20.10 34.35-35.04
Al2O3 4.15 11.80-15.26
Fe2O3 2.50 0.29- 1.40
CaO 61.30 36.80-41.40
MgO 3.13 6.13-9.10
K2O 0.39 0.39
Na2O 0.24 0.34
TiO2 0.24 0.42
P2O5 <0.90 <0.10
MnO - 0.43
SO3 4.04 0.05-2.43
The purpose of this paper is to determine whether PC composites incorporating GGBS are more durable than those made with PC alone under the action of the chemicals produced by silage and hence provide information to allow the specification of a more durable concrete mix for agricultural use in silos.
BACKGROUND
As aforementioned, a number of authors have studied the effect of GGBS on PC concrete concluding that GGBS enhances the general performance of PC composites improving workability, reducing creep and drying shrinkage, raising the ultimate compressive strength and reducing bleeding and heat of hydration. In relation to durability, Kumar et al. (1987) proved that GGBS concrete is better at both resisting chloride ingress and alkali-silica reactions than PC concrete while other authors proved that GGBS increases sulfate resistance (Higgins 2003, Binici and Aksogan 2006) and decreases the chloride diffusion coefficient and chloride ion permeability (Luo et al. 2003 and Yun Yeau and Kyum Kim 2005). However, sileage produces lactic and acetic acids and, in relation to the durability of GGBS concrete on exposure to these, results in literature were contradictory. For example, De Belie et al. (1996) conclude that GGBS enhanced concrete possesses a higher resistance to acid attack than PC concrete while Kleinlogel (1960) agrees with the above and states that acetic acid attacks PC concrete twice as fast as it does BS concrete. In addition, McCloskey et al. (1997) conclude that the inclusion of blast furnace slag at 60% reduced corrosion of the concrete by silage effluent by 18-37%. However, on the other hand, Hussey and Robson (1950) stated that the inclusion of blastfurnace slag to concrete subjected to lactic acid solutions, provides no appreciable improvement.
O’Donnell et al. (1995) studied surface effects of sileage effluent on concrete using a system in which effluent constantly flowed over the samples. As measurements of deterioration, the thickness of each specimen was recorded and the variation of surface profile over time was monitored by measurements of mass, volume, direct path ultrasonic pulse velocity and texture depth. According to these authors, the depth of the corroded layer was similar in the laboratory trials than on silo floors. However, based on their sorptivity test, the authors concluded that only the surface layers of the concrete were affected and, hence, the remaining concrete was capable of containing solutions and would not let effluent to escape through permeation.
De Belie et al. (1996) demonstrated that concretes/ mortars made using 100% PC degrade at a faster rate than those including GGBS on exposure to liquids containing lactic and acetic acid with a pH ranging between 2 and 5.5. The authors carried out resistance and permeability tests on a number of samples made with OPC, OPC without C3A, fly ash cement and BS cement.
According to these authors, the cement type has an important influence on the corrosion of concrete by feed acids. In descending order, the groups that performed best in the solutions were: BS cement, fly ash cement, OPC and OPC without C3A. This study also noted that,
although GGBS improved performance, the amount of GGBS used was insignificant once the percentage was over 35%.
METHODOLOGY
In order to compare the durability OPC and GGBS mortars, samples of different mix
proportions (see table 2) were exposed to silage effluent.
Table 2. Composition of mixes tested.
Three 28-day cycles of effluent exposure were repeated over a 4 month period. In
order to determine the rate of deterioration, following each cycle, the mortars were tested for
permeability, capillary suction, water absorption and mass loss. Durability test by salt crystallisation and compressive tests were also carried out.
Mix proportions OPC Sand Sand (kg) Water (kg) GGBS(kg)
(kg) moisture
100% OPC 4.55 2.8 24.05 2.6 - 70%OPC / 30%GGBS 3.185 2.5 24.05 2.6 1.385 50%OPC / 50%GGBS 2.275 2.8 24.05 2.6 2.275
Mixing and Curing
According to the Irish Dept. of Agriculture (1990), the resistance of concrete to acid attack by silage effluent improves with a high cement content and the use of the least amount of water to produce a stiff but workable mix which is thoroughly compacted and subsequently cured as specified. In order to test the effect of increasing GGBS amounts samples containing 100%OPC, 70%OPC / 30%GGBS and 50%OPC / 50%GGBS were mixed for testing. Water was added to each mix according to the moisture content of the sand measured using a speedy test. Thirteen 100mm cubes were made from each mix. Sample preparation was carried out in accordance with BS 4551: 2000. The moulds were filled and compacted using a vibrating table and covered with hessian sacking to be left for 24 hours to set. They were cured for 28 days according to the aforementioned standard and then released from the moulds, labeled and placed in a curing tank.
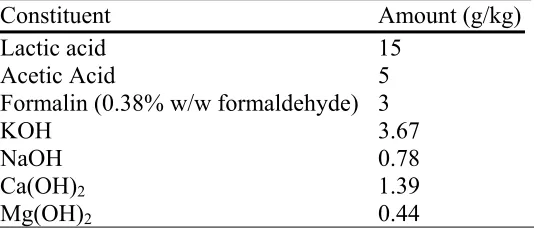
[image:4.595.72.339.586.700.2]Preparation of silage effluent
Table 3. Chemical composition of the synthetic silage effluent.
___________________________________________________________
A synthetic solution containing the key components of farmyard silage effluent was prepared according to O’Donnell et al. (1995). The
his solution is 3. The pH of the djusted to 4.0 by droxides of cations (K , Na , Ca , Mg2+) in the relative proportions specified by the aforementioned authors.
composition of t included in Table solution was a adding the hy
+ + 2+
Constituent Amount (g/kg)
Lactic acid 15
Acetic Acid 5
Formalin (0.38% w/w formaldehyde) 3
KOH 3.67 NaOH 0.78
Ca(OH)2 1.39
Durability test by exposure to silage effluent
As aforementioned, a 28-day cycle was repeated three times over a 4 month period. It was decided for the cycle to last for 28 days as, according to De Belie et al. (1996, 2000), silage effluent typically flows for a period of 28 days after ensiling crops and, after this time, the effluent flow reduces to a negligible amount. Four cubes of each mix, were immersed in the synthetic effluent at the start of each cycle. In order to avoid blockages of salt crystals building up in the mortar pores, the mortas were put through 3 cycles of immersion in water for 12-16 hours during the cycling. However, as the acids reacted with the basic samples, the pH of the effluent rose and acetic and lactic acids were regularly added to the solution in order to keep the pH at 4.
Durability test by salt crystallisation cycling
In order to measure the resistance of OPC and GGBS mortar to weathering by salt crystallization, three cubes of each mix were subjected to sulphate attack in a magnesium sulphate solution. The test procedure was carried out in accordance with I.S. 5: Part 3.1. The standards suggest 5 cycles, however, noticeable degradation was not observed in this time and 10 cycles were deemed to be more suitable after which degradation was more obvious and significant results were observed. At the end of the 10 cycles, the samples were immersed in water for 24 hours in order remove salt and their final weight measured.
Permeability test
Permeability determines the durability of concrete as the less permeable the concrete, the fewer destructive substances will be able to penetrate it. This property was measured with the Autoclam test. A base ring was fixed onto the surface of the sample isolating a test area with a diameter of 50 or 75 mm. A constant pressure of 0.5 bars was applied to contribute to the rate of flow across this area. The flow of water into the specimen was recorded automatically, with a data collector attached to the Autoclam, every minute for 15 minutes. The total volume of water penetrating the concrete was recorded in m3 and plotted versus the square root of time informing on the material’s permeability. In most instances this should yield a straight line graph, the slope of which may be reported as a Water Permeability Index (WPI) with units m3/√min.
Capillary test
The capillary tests were performed in accordance with BS EN 1925:1999. The purpose of this test is to determine how much fluid will enter into the mortar through suction forces created by the water molecules and their micro connections with pore walls. The more fluid is able to enter the mortar through capillary action the more susceptible it will be to attack by silage effluent. The area of the base of each cube was calculated. The samples were then placed on thin supports and submerged to a constant depth of 3±1mm. At time intervals, for a total of 45 minutes, the cubes were removed, blotted dry and weighed. The water suction was calculated using the formula:
S = (Ws – Wd/ A) * 100
S = Suction (g/cm2.min)
Ws = Final weight after submersion after one minute (g)
Wd = Initial dry weight of cube (g)
A = Area (cm2)
Water absorption test
The water absorption was calculated in order to assess whether there was an increase in the mortar’s pore space as a result of weathering by exposure to silage effluent. This test was carried out in accordance with the Spanish Standards UNE 67-027-84. The mortars were immersed in water, at atmospheric pressure until saturation. Water absorption was measured as a percentage of the saturated mass of the specimen using equation:
Wa = (Ws – Wd / Ws) * 100
Where:
Wa = Water absorption
Ws = Final weight after absorption
Wd = Initial dry weight
RESULTS
Visual inspection following exposure to silage effluent
Samples incorporating GGBS visually fared better on exposure to silage effluent over
the course of the experiment. Visual degradation was obvious on mortars made from
100%OPC, with corners and edges invariably disintegrating when pressurised. In
contrast, samples containing 30% as well as those including 50% GGBS remained
largely unaltered, except for slight rounding of corners of the 30% GGBS samples. The
visual results indicate that the higher the percentage of GGBS incorporated into the
mix, the better the durability on exposure to silage effluent. See section: Mass loss on
exposure to silage effluent below.
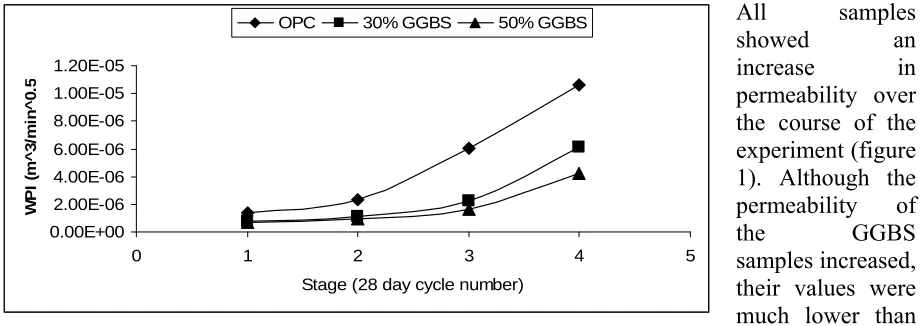
Permeability
Fig. 1. Average WPI for GGBS and PC samples at each stage of the experiment. Stage 1-prior to immersion.
All samples showed an increase in permeability over the course of the experiment (figure 1). Although the permeability of the GGBS samples increased,
their values were much lower than 0.00E+00
2.00E-06 4.00E-06 6.00E-06 8.00E-06 1.00E-05 1.20E-05
0 1 2 3 4
Stage (28 day cycle number)
W
P
I (
m
^
3
/m
in
^
0
.
5
5
[image:6.595.73.534.597.760.2]those reached by the PC samples. It is also clear from figure 1 that the WPI decreases with increasing amounts of GGBS. It can also be noted that, at the second stage of the experiment (i.e. following completion of the first 28-day-cycle), there is a dip in the WPI. This was probably due to the presence of salt crystals, formed by immersion in the effluent, blocking the pathway for water ingress thus providing a lower WPI. However, once the samples were washed and the salt cleared from the pores, the increase in the WPI for each proceeding stage was significant and relatively linear. Clearly, the permeability increase rate is greater for the PC samples than for those containing GGBS. As expected, the reference samples (unexposed to silage effluent) remained at a nearly at constant average WPIs of 1.38Exp-6 m3 (100% OPC); 7.43Exp-7 m3 (30% GGBS) and 6.48Exp-7 m (50% GGBS). 3
Water Absorption
The PC mortars initially absorbed more water than the GGBS samples. However, all samples showed a progressive increase in water absorption over the course of the experiment (figure 2). The water absorption of the reference samples not exposed to silage effluent is reported as stage 1 in figure 2.
Fig. 2. Water absoption of PC and GGBS samples. Stage 1-prior to immersion.
An increase of water absorption is directly related to an enhancement in pore space in the mortars, thus the greater the increase of water absorption the greater the weathering as a result of exposure to silage effluent. The water absorption results in figure 2 suggest that the amount of water absorbed by the GGBS samples is lower than that absorbed by the PC samples, and that the higher the GGBS content the lower the amount of water absorbed. This is also evidenced in Table 4 which shows the total increase in water absorption between the first and last stage of the experiment as a percentage. 5 5.5 6 6.5 7 7.5 8 8.5 9
0 1 2 3 4
stage (28-day cycle number)
% wa te r a b s o rb e d 5
OPC only 30% GGBS 50% GGBS
Table 4. Total increase in water absorption as a result of exposure to silage effluent. ________________________________
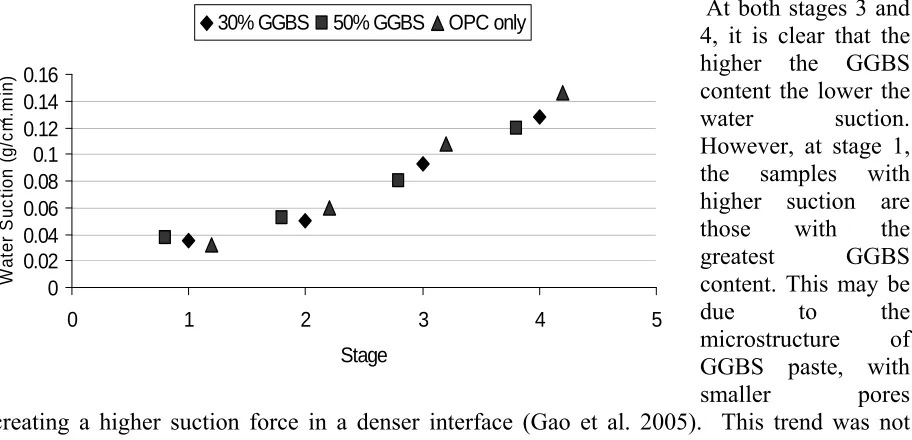
Capillary Test
The variation of capillary suction as a result of exposure to sileage effluent is included in figure 3. The capillary suction of the reference samples not exposed to silage effluent is reported as stage 1 in figure 3. In general, it can be assumed that the higher the amount of water suction exerted by the pores of a particular sample, the more susceptible it would be to degradation and hence the less durable it would be deemed. As it can be seen from figure 3, the 100% PC specimens showed the greatest increase Sample Average increase
in water absorbed (%) ________________________________ OPC only 18.65
30% GGBS 12.65 50% GGBS 8.26
in water suction, however, there is a sharp increase in water suction for all samples over the duration of the experiment.
Fig. 3. Average capillary suction of PC and GGBS samples at each stage (28-day, effluent immersion cycle). Stage 1-prior to immersion.
At both stages 3 and 4, it is clear that the higher the GGBS content the lower the
water suction. However, at stage 1,
the samples with higher suction are those with the greatest GGBS content. This may be due to the microstructure of GGBS paste, with smaller pores creating a higher suction force in a denser interface (Gao et al. 2005). This trend was not
observed in the measurement of water absorption (on the contrary, the amount of water absorbed by the GGBS samples was lower than that absorbed by the PC samples), since water absorption is more dependent on total volume of pores rather than on the pore size distribution. Alternatively the higher suction of the samples with the greatest GGBS content can also suggest that, due to a lower rate of hydration, discontinuity of pores has
0 0.02 0.04 0.06 0.08 0.1 0.12 0.14 0.16
0 1 2 3 4
Stage W a te r S u c ti o n ( g /c m 2.m in ) 5
30% GGBS 50% GGBS OPC only
not yet occurred.
Mass loss on exposure to silage effluent
Mass loss gave a very clear illustration of the amount of degradation that occurred in the samples as a result of effluent exposure. There was a relatively steady decline in the masses of all samples. However, the 100% OPC mortars lost mass at a faster rate than those containing GGBS, and the 50% GGBS samples performed the best showing the lowest mass loss (figure 4).
Fig. 4. Mass loss (g) as a result of exposure to silage effluent. Stage 1-prior to immersion. 1900 1950 2000 2050 2100 2150 2200
0 1 2 3 4
Stage
Ma
s Table 5 includes the average
percentage mass loss of each sample type. When compared to the previous tests where the 50% and 30% GGBS samples behave similarly, the percentage mass lost by the 30% GGBS 5
s
[image:8.595.80.375.581.753.2]samples is disproportionately large when compared to that of the 50% GGBS samples. Figures 5-8 illustrate material loss following exposure to silage effluent.
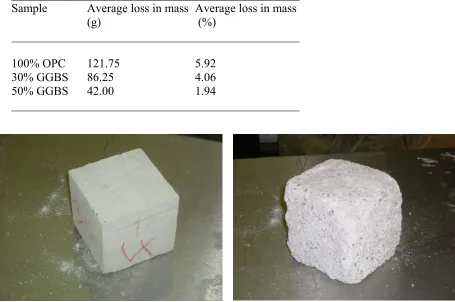
Table 5. Average loss in mass as a result of exposure to silage effluent. ________________________________________________
Sample Average loss in mass Average loss in mass
(g) (%)
________________________________________________
100% OPC 121.75 5.92
30% GGBS 86.25 4.06
50% GGBS 42.00 1.94
________________________________________________
Fig. 5: Typical mortar sample before immersion in silage effluent.
Fig. 6: Typical 100% Portland cement mortar sample after final stage of immersion.
Fig. 7: Typical 30% GGBS mortar sample after final stage of immersion.
[image:9.595.77.534.496.664.2]Compressive strength
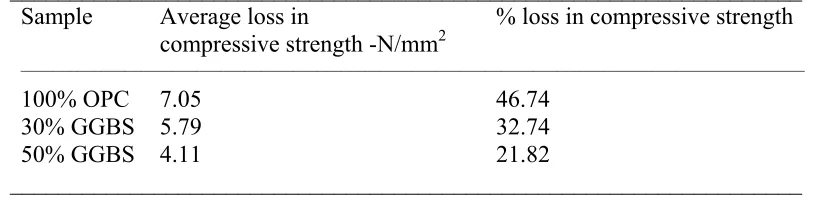
Mechanical strength is a good indicator of long term concrete durability, and it is generally accepted that stronger concretes will have a longer life. As expected, at the end of the sileage immersion experiment, mortar mixes containing GGBS performed better, showing a greater strength than those including 100% PC (Table 6). The initial compressive strength of the samples prior to effluent exposure was 13.83; 19.76 and 24.79 N/mm2 for the OPC; 30%
[image:10.595.76.484.293.392.2]GGBS and 50% GGBS samples respectively. This is probably due to the cements produced by GGBS. These cements have a greater proportion of strength-enhancing compounds and less lime (which contributes little to concrete strength) than those produced in the hydration of PC. The percentage loss in strength of the 100% PC samples was nearly twice as much as that of the 50% GGBS samples.
Table 6. Average loss and percentage loss of compressive strength as a result of exposure to sileage effluent.
__________________________________________________________________ Sample Average loss in % loss in compressive strength
compressive strength -N/mm2
__________________________________________________________________________________________________
100% OPC 7.05 46.74
30% GGBS 5.79 32.74
50% GGBS 4.11 21.82
__________________________________________________________________
Salt Crystallisation Cycles
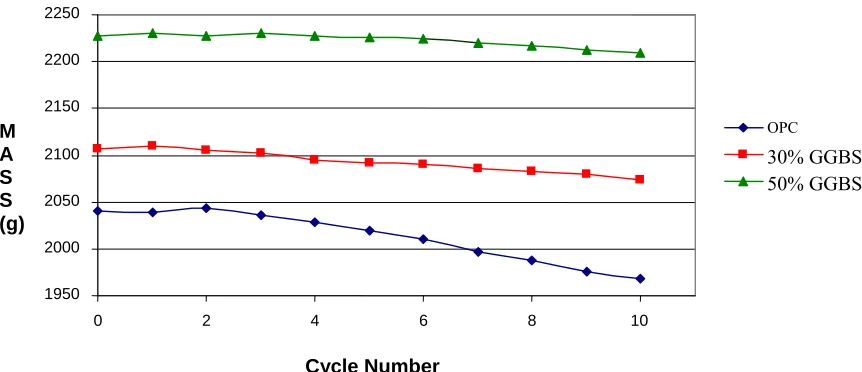
Over the course of the experiment surface degradation was slow and minute thus it was difficult to visually judge performance. However, at the end of the experiment, when all excess salt was washed away, it became clear that the OPC samples had degraded significantly more than their GGBS enhanced counterparts as the aggregate could be clearly seen protruding through the corroded cement paste. The increase of surface roughness of the 100% OPC samples was far greater than that of the 50% and 30% GGBS mortars. Very little surface degradation took place to the 50% GGBS samples. The average mass loss following immersion in MgSO4 solution is included in table 7.
Table 7. Average mass loss as a result of ten cycles of immersion in MgSO4 solution.
_____________________________
In addition the mass loss after each cycle of immersion in the MgSO4 solution is reported in Figure 9. The
100% OPC samples lost mass at a faster rate than those containing a percentage of GGBS, showing the greatest total mass loss. The 100% OPC samples showed an initial increase in mass which was then followed by a steady decrease in mass. This was probably due to cystallization of salt from the solution during the drying phase. However, once these salt crystals dissolved, the decrease in mass accelerated, and the 100% OPC mortar degraded quite rapidly in comparison to the GGBS enhanced mixes. The mass of the 50% GGBS mortar stayed relatively unchanged until the seventh cycle and even then mass loss was very slow. Although, the decrease in mass of the OPC mortar over the duration of the experiment was quite small (2.8 – 3.5%), it was, however, relatively large when compared to the percentage mass lost by the 50% GGBS cubes (0.8 – Sample type % average mass loss
_____________________________ OPC 3.5- 2.8
1.2%). The results suggest that increasing the percentage of GGBS in the mix enhances performance on exposure to salt crystallisation.
Fig. 9. Mass loss after each cycle of immersion in the MgSO4 solution.
2250
2200
2150
OPC M
A S S (g)
2100 30% GGBS
50% GGBS
2050
2000
1950
0 2 4 6 8 10
Cycle Number
DISCUSSION
The low values of the properties related to the presence and movement of moisture (permeability, capilary suction and water absorption) of the GGBS mixes tested are partially responsible for the high resistance of GGBS mixes to attack by chloride and sulfate. These low values agree with the lower chloride diffusion and chloride ion permeability of GGBS concrete reported by Luo et al. (2003) and Yun Yeau and Kyum Kim (2005) and the increased sulfate resistance reported by Higgins (2003) and Binici and Aksogan (2006); and the enhanced resistance to chloride ingress and alkali-silica reactions reported by Kumar et al. (1987).
The ultimate reason for this reduced moisture transport ability probably lyes in the strong microstructure of the interfacial aggregate/binder transition zone of GGBS which is often an area of weakness in other composites. GGBS significantly decreases both the content and the size of Ca(OH)2 crystals in the aggregate-paste interface which makes the microstructure of the
transition zone aggregate/binder dense and strong (Gao et al. 2005).
In addition, as reported by aforementioned authors, the mineral composition of GGBS is also partially responsible for the high durability of GGBS concrete. GGBS includes more SiO2 and
less CaO than PC forming different hydrates in the cement paste. Specifically, hydrated PC paste contains more calcium hydroxide [Ca(OH)2] and more aluminates than GGBS, and these
are the cement components most vulnerable to acid and sulphate attack. For example, when exposed to sulphates and weak acids such as those found in silage effluent, [Ca(OH)2] forms
soluble calcium salt crystals which are then washed away by any leachate present (De Belie 1996). However, in GGBS composites, GGBS reacts with the Ca(OH)2 during the hydration
process thus less Ca(OH)2 is available to react with any acids or sulphates. In addition, when
tri-calcium aluminate [C3A] comes into contact with weak acids or sulphates present in silage
[image:11.595.76.507.144.330.2]accelerating the deterioration process. Therefore, with the introduction of GGBS salt and acid attack should decrease.
This research agrees with conclusions by Barnett et al. (2006) stating that GGBS enhances the ultimate compressive strength of OPC. The results of this research also agree with those by Kleinlogel (1960); McCloskey et al. (1997) and De Belie et al. (1996 and 2000) concluding that GGBS enhanced concrete possesses a higher resistance to acid attack. However, O’Donnell et al. (1995) concluded that only the surface layers of the concrete were affected and that the remaining concrete was capable of containing the effluent escape through permeation. The present study disagrees with this, as from the capillary, permeability and water absorption tests, it was clear that fluid could easily find its way further than the first few millimetres through the mortar, especially in those samples made from 100% PC. This would suggest that pathways for fluid exist deep within the samples. However, the immersion method used in this study was far more aggressive than the flow method used by O’Donnell et al. (1995) as, by immersion, obvious effects were noticeable at the end of the second cycle whereas it took 5 cycles to see obvious effects using the flow method.
De Belie et al. (1996) evidenced that the rate of deterioration of the OPC samples was greater than that of the samples containing GGBS. However, these authors noted that the amount of GGBS didn’t determine durability once the percentage was over 35%. In contrast, the present work demonstrates that there were significant differences between the results provided by the 30% and 50% mixes in mass loss and water absorption. Nevertheless, in other properties such as capillarity and permeability the difference in the results was not important thus indicating that the amount of GGBS does not significantly impact the transport properties of the mortars near the surface. McCloskey et al. (1997) agrees with the present study as they observed a noticeable gap in mass lost between the two different percentages of GGBS. These authors deemed weight loss to be the most reliable indication of concrete corrosion. However, this research suggests that both mass loss and increase in permeability are the most reliable indications of corrosion as they gave the most dramatic and uniform results.
CONCLUSION
Concrete used to build silage silos undergoes severe chemical attack over its lifetime. This damage invariably costs a lot of money to repair and hence research is needed in order to find a more durable concrete in this environment.
This paper has evidenced that PC composites incorporating GGBS are more durable than those made with PC alone in aggressive environments under the action of acids and salts such as those produced by silage, and that durability increased with increasing amounts of GGBS. GGBS mixes showed the smallest progressive rise in permeability, water absorption and capillary suction as a result of sileage immersion and salt cycling, as well as the smallest mass and compressive strength loss. Therefore a more durable concrete mix for agricultural use in silos can be specified by incorporating GGBS as a partial substitute for OPC.
This research concludes that the low values of the properties related to the presence and movement of moisture of GGBS mixes, probably due to the dense and strong microstructure of the interfacial aggregate/binder transition zone are probably responsible for the high resistance of GGBS mixes to attack in aggressive environments such as silage pits. The mineral composition of GGBS cement paste (with less aluminates and portlandite than PC) probably contributes to this resistance. The deterioration of performance of all tested mixes (based on the measurements of water absorption and mass loss) suggests that attack by silage effluent is not as superficial as previously reported, and that silage effluent corrodes PC concrete deep significantly incresing capillary suction as well as absorption and permeability. Finally, this paper concludes that mass loss and increase in permeability (as measured with the Autoclam test) are the most reliable indicators of concrete corrosion as they gave the most dramatic and uniform results.
ACKOWLEDGEMENTS
The authors thank Mr. Chris O’Donovan, for facilitating our laboratory work; Mr. Eoin Dunne for his assistance with testing in the Materials Laboratory and Mr. Patrick Veale for his help in the Environmental Laboratory. Their help is much appreciated. The authors also thank Mr. Donal O’Riain and Mr. Dave Reddy for supplying information on GGBS.
REFERENCES
Barnett S.J., Soutsos M.N., Millard S.G. and Bungey J.H. (2006). “Strength development of mortars containing ground granulated blast-furnace slag: Effect of curing temperature and determination of apparent activation energies”. Cement and Concrete Research, 36 (3), 434-440.
Binici, H. and Aksoğan, O. (2006). “Sulfate resistance of plain and blended cement”. Cement and Concrete Composites, 28 (1), 39-46.
BS 4551: 2000.Methods of testing mortars.
BS EN 1925:1999. Determination of water absorption by capillarity.
BS EN 206-1:2000 Concrete. Specification, performance, production and conformity.
De Belie N., Verselder H.J., De Blaere B., Van Nieuwenburg D. and Verschoore R. (1996). “Influence of the cement type on the resistance of concrete to feed acids”. Cement and Concrete Research, 26 (11), 1717-1725.
De Belie N., Lenehan JJ, Braam C.R., Svennerstedt B, Richardson M. and Sonck B. (2000). “Durability of Building Materials and Components in the Agricultural Environment, Part III: Concrete Structures”. Journal of Agricultural Engineering Research, 76, 3-16.
Ecocem. www.ecocem.ie. 2005
Gao, J. M., Qian, C. X., Liu, B. and Wang, L. L. (2005). “ITZ microstructure of concrete containing GGBS”. Cement and Concrete Research, 35 (7), 1299-1304.
Cement and Concrete Research, 30 (7), 1031-1036.
Higgins, D. D. (2003). “Increased sulfate resistance of ggbs concrete in the presence of carbonate”. Cement and Concrete Composites, 25 (8), 913-919.
Hussey A.V., Robson T.D. (1950). “High alumina cement as a constructional material in the chemical industry”. Symposium: Materials of Construction in the Chemical Industry.
Birmingham, 217-222.
Irish Department of Agriculture, Food and Forestry (1985). Guidelines and recommendations on control of pollution from farmyard wastes.
Irish Dept. of Agriculture and Food Statistics Office (2005). Farm Waste Management scheme.
Irish Department of Agriculture, Food and Forestry. S.128, (1990). Minimum specification for concrete silage bases and concrete walled silos.
IS 5: Part 3.1: 1990. Method of test for the determination of the soundness of coarse aggregate.
Jianyong, L. and Yan, Y. (2001). “A study on creep and drying shrinkage of high performance concrete”. Cement and Concrete Research, 31 (8), 1203-1206.
Kleinlogel A. (1960) The influence of different physical chemical elements on concrete, 1st Ed., Dunod, Paris.
Kumar A., Roy D.M. and Higgins D.D. (1987). “Diffusion through Concrete.” Concrete, 31-32.
Luo, R., Cai, Y., Wang C. and Huang X. (2003). “Study of chloride binding and diffusion in GGBS concrete”. Cement and Concrete Research, 33 (1), 1-7.
McCloskey A., Cleland D.J., Frost J.P., Rankin G.I.B and Wilson J.W. (1997). “Improving the durability of concrete in silos for grass silage”. Proc., Concrete for a Sustainable Agriculture, Stavenger, 154-162.
O’Donnell C., Dodd V., O’Kiely P. and Richardson M. (1995). “A Study of the Effects of Silage Effluent on Concrete: Part 1 Significance of concrete characteristics”. Journal of Agricultural Engineering Research, 60, 83-92.
O’Donnell C., Dodd V., O’Kiely P. and Richardson M. (1995). “A Study of the Effects of Silage Effluent on Concrete: Part 1 Significance of concrete characteristics”. Journal of Agricultural Engineering Research, 60, 93-97.
Sangarapillai V.G. and Dumelow J. ‘Rapid assessment of the durability of concrete exposed to silage effluent’, Farm Buildings Progress (114), October 1993, pp15-17
UNE (1984) 67-027-84. Normas ladrillos: Determinación de la absorción de agua y ensayo de heladicidad. Ed. Instituto Español de Normalización (AENOR).
Wainwright, P. J. and Rey, N. (2000). “The influence of ground granulated blastfurnace slag (GGBS) additions and time delay on the bleeding of concrete”. Cement and Concrete
Composites, 22 (4), 253-257.