STRUCTURAL EQUATION MODELLING AND SYSTEM DYNAMIC IN THE DETECTION OF POWER QUALITY EVENTS
ASHRAF ZULFA BINTI AZIZAN
A thesis submitted in partial
fulfillment of the requirement for the award of the Degree of Master of Electrical Engineering
Faculty of Electric and Electronic Engineering Universiti Tun Hussein Onn Malaysia
ABSTRACT
The issues of power quality had been discussed since the starting of power system and it will keep on arise from time to time because power quality is important to electricity consumers at all levels of usage. Since sensitive equipments and power electronic devices are now more common in industrial/commercial sectors as well as domestic use, the awareness of power quality is developing amongst electricity users. In general, the main power quality issues can be identified as voltage variations, voltage imbalance, voltage fluctuations, transients, harmonic distortions, interruptions, etc. The
consequences of one or more of the above non-ideal conditions may cause thermal effects, life expectancy reduction, dielectric strength reduction and disoperation of different equipments. In this project, power quality events are verified using Structural Equation Modeling (SEM) and System Dynamic method. In detecting power quality events, Amos 5.0.1 and Vensim PLE for Windows version 5.11 were used. The
vi
ABSTRAK
Isu-isu tentang kualiti kuasa telah dibincangkan semenjak bermulanya sistem kuasa dan ia akan terus dibangkitkan dari masa ke semasa kerana kualiti kuasa adalah penting kepada pengguna-pengguna bekalan elektrik pada semua tahap penggunaan. Disebabkan peralatan-peralatan sensitif dan juga peralatan elektronik kuasa semakin biasa digunakan di dalam sektor industri atau komersial serta kegunaan domestik, kesedaran tentang kualiti kuasa berkembang di kalangan pengguna-pengguna bekalan elektrik. Secara amnya, isu utama kualiti kuasa boleh dikenalpasti melalui variasi voltan, ketidakseimbangan voltan, naik-turun voltan, transien, pengherotan harmoni, gangguan dan sebagainya. Akibat daripada satu atau lebih daripada keadaan-keadaan tidak ideal seperti yang di atas boleh menyebabkan kesan terma atau kepanasan, pengurangan jangkahayat, pengurangan kekuatan dielektrik dan ketidakfungsian peralatan. Di dalam projek ini, gangguan kualiti kuasa disahkan menggunakan kaedah Structural Equation Modeling (SEM) dan System Dynamic. Dalam mengesan gangguan kualiti kuasa, perisian AMOS 5.0.1 dan Vensim PLE for Windows Version 5.11 digunakan.
CONTENTS
CHAPTER TITLE PAGE
1 2 TITLE DECLARATION DEDICATION ACKNOWLEDGEMENT ABSTRACT ABSTRAK CONTENTS
LIST OF FIGURES LIST OF TABLES
LIST OF ABBREVIATIONS
INTRODUCTION 1.1 Project Introduction 1.2 Problem Statement 1.3 Objective of Project 1.4 Scope of Project
LITERATURE REVIEW 2.1 Introduction
viii
3
4
METHODOLOGY 3.1 Introduction
3.2 Phase I: Literature Study 3.3 Phase II: Data Collection
3.4 Phase III: Evaluate Data using Structural Equation Modeling
3.4.1 Total Harmonic Distortion
3.4.2 Root Mean Square Error of Approximation (RMSEA)
3.5 Phase IV: Evaluate Data using System Dynamic 3.6 Phase V: Results Comparing
RESULT AND ANALYSIS
4.1 Structural Equation Modeling 4.1.1 Voltage harmonic distortion 4.1.1.1 Phase A 4.1.1.2 Phase B 4.1.1.3 Phase C 4.1.2 Current harmonic distortion 4.1.2.1 Phase A 4.1.2.2 Phase B 4.1.2.3 Phase C 4.2 System Dynamic
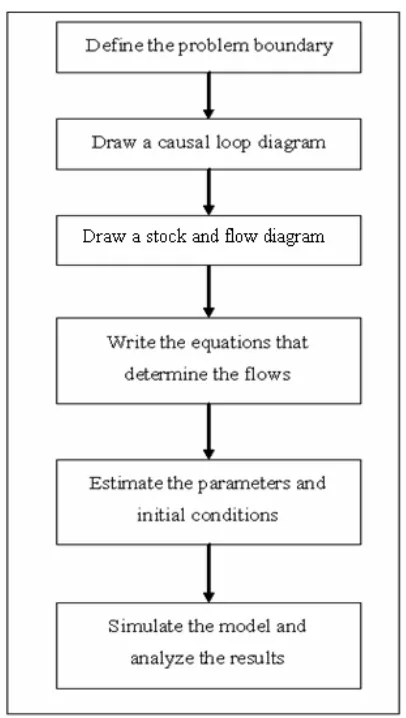
4.2.1 Define the problem boundary 4.2.2 Draw a causal loop diagram 4.2.3 Draw a stock and flow diagram
4.2.4 Write the equations that determine the flows 4.2.5 Estimate the parameters and initial conditions 4.2.6 Simulate the model and analyze the results
5 CONCLUSION AND FUTURE WORK 5.1 Conclusion
5.2 Future Work
REFERENCES APPENDIX
46 47
x
LIST OF FIGURES
FIGURE. NO TITLE PAGE
3.1 3.3 3.4 3.5 4.1 4.2 4.3 4.4 4.5 4.6 4.7 4.8 4.9 4.10 4.11 4.12 4.13 4.14 4.15 4.16 4.17 4.18
Block Diagram of Methodology
Location of TNB Distribution in Skudai, Johore Flow Chart of SEM analysis
Flow of system dynamic analysis Data in text file
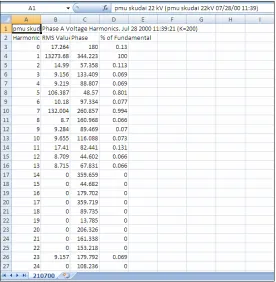
Data in excel file
Waveform of Phase A Voltage Harmonic Distortion Model constructed
Waveform of Phase B Voltage Harmonic Distortion Model constructed
Waveform of Phase C Voltage Harmonic Distortion Model constructed
Waveform of Phase A Current Harmonic Distortion Model constructed
Waveform of Phase B Current Harmonic Distortion Model constructed
Waveform of Phase C Current Harmonic Distortion Model constructed
Time bounds box and the setting for this project Causal loop diagram for this project
Stock and flow diagram
Equation of the flows of model
4.19 4.20 4.21 4.22 4.23 4.24 4.25 4.26
Initial value setting RMS value setting Units Check result Control Panel window
Custom Graph Design window
Graph of Initial and RMS Value over THD Corrected equation
Error occurred during units check
xii
LIST OF TABLES
TABLE. NO TITLE PAGE
3.2 3.4
Description of Power Quality Events
Icons and functions in performing SEM analysis using AMOS Graphics
12
LIST OF ABBREVIATIONS
LISREL - Linear Structural Relations SEM - Structural Equation Modeling RL - Resistor-Inductor
ADALINE - Adaptive Linear Neuron DC - Direct Current
CBEMA - Computer Business Equipment Manufacturing Association ANSI - American National Standards Institute
ITIC - Information Technology Industry Council PQ - Power Quality
CHAPTER 1
INTRODUCTION
1.1 Project Introduction
Structural equation modeling is an extension of the general linear model that enables researchers to fit more than one regression equation simultaneously [1]. It encompasses a larger number of statistical procedures including latent variable analysis, confirmatory factor analysis, causal modeling, LISREL analysis, growth curve
System dynamics is an approach to understanding the behaviour of complex systems over time. It deals with internal feedback loops and time delays that affect the behaviour of the entire system [6, 7]. In another word, system dynamic is a methodology and mathematical modeling technique for framing, understanding, and discussing
complex issues and problems [8]. System dynamics has been used extensively to aid in resource planning in the electric power industry. The many applications constitute a major body of work that has proven useful to large and small power companies as well as to government agencies at the local, state and federal level. The work has been performed by utility analysts, government planners, consultants and academics. System dynamics was first used in water resource planning in the study of river basin
development. With that start, more research on system dynamic has been carried out [9, 10].
This project will use these two methods in an attempt to detect power quality events such as harmonics and voltage sags that occurred in electric power system. With all the steps in both methods, the data will be analyzed and thus, detecting the events and the possible mitigation will then be justified.
1.2 Problem Statement
3
these two methods, it might be a solution to easily detect the power quality events. From that, a comparison between structural equation modeling and system dynamic modeling will take position thus suggesting a possible mitigation for a better performance of electrical energy supply.
1.3 Objective of Project
There are a few objectives for this project that includes:
1. To implement structural equation modeling and system dynamic method in electrical power system.
2. To determine several power quality events in electrical system using the methods mentioned.
3. To propose a possible mitigation for the power quality events occurred.
1.4 Scope of Project
Every project has its scope and limitation. For this particular project, the scopes and limitation are:
2. The techniques use to identify the power quality events are only structural equation modeling and system dynamic.
CHAPTER 2
LITERATURE REVIEW
2.1 Introduction
Electrical fault in a distribution network is almost impossible to avoid. Main causes for power quality disturbances may be due to insulation failure, tree falling, bird’s contact, lightning or a fault on an adjacent feeder [11]. The research of power quality issues has captured ever increasing attention in the power engineering society [12]. A power quality problem can be described as any variation in the electrical power service, such as voltage sags and swells, interruptions, transients, harmonics, notches, and fluctuations, resulting in misoperation or failure of end-use equipment. To analyze these electric power system disturbances, data is often available as a form of a sampled time function that is represented by a time series of amplitudes [13].
20kHz from an experimental system, which is composed of a three-phase wye-connected 380V, 50Hz, 25kVA, 5-wire supply loaded with RL load banks and three-phase induction motors coupled with varying mechanical loads. The system also includes adjustable speed drives that control the induction motor. Another advantage is this method does not experience short discontinuity at the beginning and the end of the events. Although this method provides good detection of power quality events, it is difficult to observe the data if it is only processed in horizontal direction. This means that by using this method, the data have to be processed in both horizontal and vertical direction in order to easily observe the result.
Carlos A. Duque, Moises V. Ribeiro, Frederico R. Ramos and Jacques Szczupak [15] have published a journal in detecting power quality events based on the Divide and Conquer Principle and Innovation Concept. The power quality events detection is based on the Divide and Conquer Principle and Innovation Concept, as found in Kalman’s filter formulation, and it is applied to voltage signals. This method makes use of digital signal processing techniques to obtain the stationary and non-stationary components of the monitored power quality events. The Innovation Concept is implemented to detect power quality disturbances start and end point. There are a few advantages of this method which are it introduces a simple and efficient way to evaluate the total harmonic distortion, in case of harmonic pollution, this method offers a new perspective in
analyzing power quality events or even other problems in the power systems and by using this method, more accurate detections of power quality events can be
accomplished. There is only one disadvantage of this method which is it requires a much reduced computational complexity for event detection, as compared to usual procedure. This means that this method cannot be used in a complex situation.
7
power quality events. The events investigated are line-to-ground arcing faults and voltage sags due to the induction motor starting. A vector with six parameters is used as a feature vector. After the detection of power quality events, the maximum and
minimum values of the cumulants around the event instant are used to classify the events. The conclusions made from the experiment done are higher order statistics are effective tools to detect deviations from Gaussianity, which is valid for several types of different loading conditions, the combination of higher order statistical parameters and quadratic classifiers is a promising tool for power quality event detection and
classification and the cumulant calculation can be performed in real time even using simple microcontrollers even though for power quality event discrimination, using lower order cumulants is not possible as the complicated fluctuations cannot be visualized or differentiated [16].
Cheng-I Chen and Yu-Ting Fu [17] uses Wavelet and Adaptive Linear Combiner (ADALINE) to detect power quality events in 2010. By using this method, power
system monitoring provides accurate and useful information to power grids and the starting and ending time of events can be effectively detected. On the conference paper, it was stated that power quality events are detected and classified by combining the wavelet analysis and adaptive linear combiner (ADALINE). The proposed algorithm is demonstrated by a simple laboratory setup with LabVIEW program and actual recorded waveforms. By using Wavelet and Adaptive Linear Combiner (ADALINE), time location of events can be detected more accurately than the traditional window-based methods and adaptive filtering techniques. But this method requires many computational operations and need data training and the adaptive approaches always suffer from
numerical stability and computational burden.
Also, in the year 2010, Dr.M.Sushama, Dr.G.Tulasi Ram and Dr.A.Jaya Laxmi [18] used Wavelet Transforms in detecting power quality disturbances. Wavelet
The power quality events considered are sag, swell, interruption, DC offset, frequency variation and harmonics. For this method, it is fast, sensitive and practical for detection and identification of power quality disturbances and it is suitable for stationary signal analysis where frequency component doesn’t vary with time. The wavelet method can also be applied in other fields due to its variety of properties such as astronomy, nuclear engineering, acoustics, signal and image processing, speech discriminations, radar, human vision and in mathematics applications such as solving partial differential equations.
On every existing approach to compensate for voltage disturbances, the very first step is to detect the disturbance itself, and then other actions will come such as
CHAPTER 3
METHODOLOGY
3.1 Introduction
PhaseI: Literature Study
Phase II: Data Collection
Phase III: Evaluate data using Structural Equation
Modeling
Phase IV: Evaluate data using System Dynamic
Phase V: Results Comparing
Figure 3.1: Block Diagram of Methodology
3.2 Phase I: Literature Study
11
be verified by installing a special type of high-speed recording test equipment to monitor the electrical power. This type of test equipment will provide information used in
evaluating if the electrical power is of sufficient quality to reliably operate the equipment.
Power quality events can be defined as any power problem manifested in voltage, current or frequency deviation. There are several problems related with power quality such as voltage sag, voltage swell, voltage fluctuations (flicker), transient, harmonics distortion and etc. Power quality issues can be divided into short duration, long duration, and continuous categories. The computer industry has developed a qualification standard to categorize power quality events. The most common standard is the CBEMA curve (Computer Business Equipment Manufacturing Association). Other standards include ANSI and ITIC.
From literature study, most of proposals is about the detection and classification methods for PQ events. The classification of a PQ event is as important as its detection because a large class of events is due to the normal operation of power distribution networks, and these events should not cause nuisance tripping of protection equipment in the network.
On the other hand, arcing faults correspond to relatively dangerous cases and they must be opened by protective equipment in order to avoid undesirable
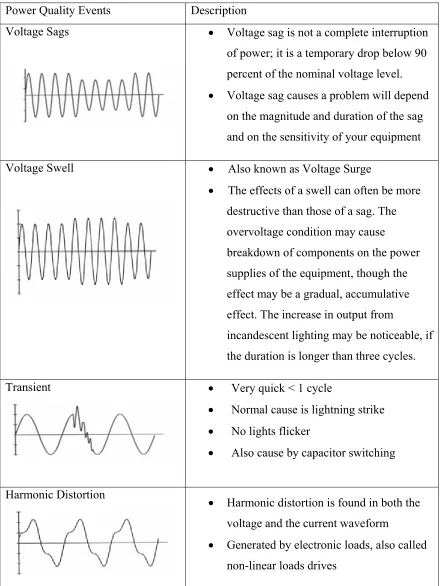
Table 3.2: Description of Power Quality Events Power Quality Events Description
Voltage Sags • Voltage sag is not a complete interruption of power; it is a temporary drop below 90 percent of the nominal voltage level. • Voltage sag causes a problem will depend
on the magnitude and duration of the sag and on the sensitivity of your equipment
Voltage Swell • Also known as Voltage Surge
• The effects of a swell can often be more destructive than those of a sag. The overvoltage condition may cause
breakdown of components on the power supplies of the equipment, though the effect may be a gradual, accumulative effect. The increase in output from
incandescent lighting may be noticeable, if the duration is longer than three cycles.
Transient • Very quick < 1 cycle
• Normal cause is lightning strike • No lights flicker
• Also cause by capacitor switching
Harmonic Distortion
• Harmonic distortion is found in both the voltage and the current waveform
13
3.3 Phase II: Data Collection
The data of power quality events in this project was taken from TNB
distribution in Skudai area at 22 kV. The data that contains harmonics distortion was observed and then analyzed by using RPM Power Analysis Software. Figure 3.3 below shows the location of TNB Distribution in Skudai, Johore, where the data was taken.
Figure 3.3: Location of TNB Distribution in Skudai, Johore
3.4 Phase III: Evaluate Data using Structural Equation Modeling
structural model. Both models are defines by the researcher. The measurement model defines the constructs (latent variables) that the model will use, and assigns observed variables to each. The structural model then defines the causal relationship among the latent variables. For this project, AMOS 5.0.1 software was used. The model for this project was constructed using Amos Graphics. Figure 3.4 below shows the flow chart of the steps done in performing SEM analysis.
Figure 3.4: Flow Chart of SEM analysis
15
[image:25.612.116.539.314.700.2]text file (*.txt) and excel (*.xls) file, and then inputs the data into the SEM software package. The package fits the data to the specified model and produces the results. There are several steps in performing model construction, model testing and observing results. The first steps are handling data manipulation and get the data into AMOS. And then, the model or diagram was drawn. The third and fourth step in SEM analysis is naming the variables and editing functions. Before running the model, the fifth step which is verifying analysis properties was done. And the sixth and last step done was running the model and viewing and observing the result. Table 3.4 below shows the icons and functions used in performing SEM analysis using AMOS Graphics.
Table 3.4: Icons and functions in performing SEM analysis using AMOS Graphics
Icons on AMOS 5.0.1 Functions
Specify data files for the model
View the variable list in the files user have specified
Draws observed variables
Draws latent variables. Also the symbol for error terms.
Draws a latent variables with its indicators
Causal relationships Covariances/correlations
Adds an error term to an endogenous (dependent variable)
Add a title to your diagram
Select on object/select all objects/deselect all objects
Move object
Delete object
Modify object size
Rotate indicators of a latent variable
Drag properties from one object to another
Undo and Redo
Analysis properties
Calculate estimates/Run model
View results (text form)
3.4.1 Total Harmonic Distortion
In understanding a system with an input and an output, such as an audio
17
This can equivalently be written as
If there is no source of power other than the signal and its harmonics.
Total harmonic distortion, or THD, is the summation of all harmonic components of the voltage or current waveform compared against the fundamental component of the voltage or current wave:
where Vn is the RMS voltage of nth harmonic and n=1 is the fundamental frequency
or
where In is the RMS current of nth harmonic and n=1 is the fundamental frequency
3.4.2 Root Mean Square Error of Approximation (RMSEA)
This measure, an absolute measure of fit, is based on the non-centrality parameter. Its formula can be shown to equal:
√ [χ²/df) - 1) / (N - 1)]
where N the sample size and df the degrees of freedom of the model. (If χ² is less than df, then RMSEA is set to zero). First, the value of the non-centrality parameter is determined by χ²- df. Then these values are substituted for χ²- df into the formula for the RMSEA.
3.5 Phase IV: Evaluate Data using System Dynamic
System dynamics is a methodology and mathematical modeling technique for framing, understanding, and discussing complex issues and problems. System dynamics is an aspect of systems theory as a method for understanding the dynamic behavior of complex systems. The basis of the method is the recognition that the structure of any system. The elements of system dynamics diagrams are feedback, accumulation of flows into stocks and time delays. In this project, after the data is evaluated using Structural Equation Modeling, System Dynamic is used to evaluate the data and for that, another software was used which are Vensim PLE for Windows Version 5.11. The evaluation or analysis of the data involved several steps, which are:
19
[image:29.612.225.428.211.570.2]• Write the equations that determine the flows • Estimate the parameters and initial conditions • Simulate the model and analyze the results
Figure 3.5 shows the flow of system dynamic analysis done.
3.6 Phase V: Results Comparing
CHAPTER 4
RESULT AND ANALYSIS
This chapter discussed the result and analysis for this project. The analysis has been performed based on data obtained by the means of Structural Equation Modeling and System Dynamic method.
4.1 Structural Equation Modeling
Figure 4.1: Data in text file
[image:32.612.190.466.351.633.2]23
SEM analysis was done on voltage and current harmonic distortion. Analysis was performed on each phase which is Phase A, Phase B and Phase C. Usually, in SEM diagrams the variables are arranged from left to right. Observed variables are represented by rectangles and unobserved variables are represented by ellipses.
4.1.1 Voltage harmonic distortion
4.1.1.1 Phase A
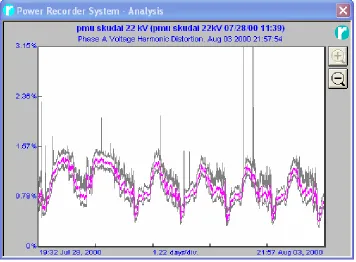
Figure 4.3 shows the waveform of Phase A Voltage Harmonic Distortion analyzed from Power Analysis Software.
[image:33.612.150.506.402.664.2]
Based on the Total Harmonic Distortion formula, the percentage of THD was calculated as below:
= √ (14.99² + 9.156² + 9.219² + 106.387² + 10.18² + 132.004² + 8.7² + 9.284² + 9.655² + 17.41² + 8.709² + 8.715² + 9.157² + 12.757² + 36.035²)
___________________________________________________ X 100% 13.273k
= 1.337 %
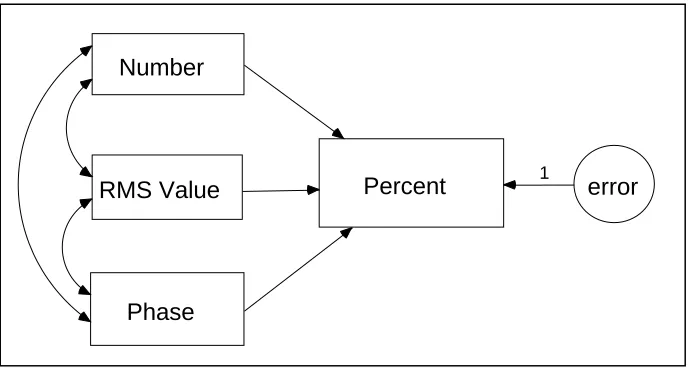
[image:34.612.122.520.120.326.2]From the calculation above, the percentage of total harmonic distortion is 1.337%. Figure 4.4 show the model constructed using AMOS Graphics.
Number
RMS Value
Phase
Percent 1 error
Figure 4.4: Model constructed
[image:34.612.147.493.424.610.2]REFERENCES
[1] Gefen,D., Straub,D., and Boudreau,M. (2000). Structural Equation Modeling and Regression:Guidelines for Research Practice. Communications of AIS (7:7, August), pp.1-78.
[2] Romano,R. and Palumbo,F. (2006). Classification of structural equation models based on fuzzy regression. Preprint submitted to KNEMO Conference 21 July 2006, pp.1-17.
[3] Saghaei,A. and Ghasemi,R. (2009).Using Structural Equation Modeling in Causal Relationship Design for Balanced-Scorecards Strategic Map. World Academy of Science, Engineering and Technology 49 2009, pp.1-7.
[4] Shimizu,S. and Kano,Y. (2006). Use of non-normality in structural equation modeling: Application to direction of causation. Preprint submitted to Elsevier Science 7 January 2006, pp.1-18.
[5] Maxwell,K.H. (2007). Structural Equation Modeling with Amos: A methodology for predicting behavioral intentions in the services sector.
Wisconsin: SPSS Inc.
[6] Gillespie,R.B., Hoffman,M.B. and Freudenberg,J. (2003). Haptic Interface for Hands-On Instruction in System Dynamics and Embedded Control. Symposium 2003, pp.1-6.
[7] Pruyt,E. (2004). System Dynamic Models of Electrical Wind Power. MOSI Working Paper 2004, pp.1-31.
[8] Lan,Z., Gan,D., Shi,L. and Ni,Y. (2007). A Study on the Control of AC/DC Power Systems Based on System Dynamic COI. pp.1-5.
Forrester Prize Lecture 1996, pp.1-29.
[10] Kirkwood,C.W. (1998). System Dynamics Methods: A Quick Introduction. Arizona: Ventana Systems, Inc. pp.1-4.
[11] Chandrasekaran,K., Vengkatachalam,P.A, Karsiti,M.N. and Rao,K.S.R. (2007). Mitigation of Power Quality Disturbances. Journal of Theoretical and Applied Information Technology, pp.1-12.
[12] Haibo,H., Shen,X. and Starzyk,J.A. (2009). Power quality disturbances analysis based on EDMRA method. Electrical Power and Energy Systems 31, 2009, pp.258–268.
[13] El-Gammal,M., Abou-Ghazala,A. and El-Shennawy,T. (2003). Detection, localization, and classification of power quality disturbances using discrete wavelet transform technique. Alexandria Engineering Journal, Vol. 42 (2003), No. 1, 17-23, pp.1-7.
[14] Ece,D.G. and Gerek,O.N. (2004). Power Quality Event Detection Using Joint 2- D-Wavelet Subspaces. IEEE Transactions on Instrumentation and Measurement, Vol.53, No.4, August 2004, pp.1-7.
[15] Duque,C.A., Ribeiro,M.V., Ramos,F.R. and Szczupak,J. (2005). Power Quality Event Detection Based on the Divide and Conquer Principle and Innovation Concept. IEEE Transactions on Power Delivery, Vol.20, No.4, October 2005, pp.1-9.
[16] Ece,D.G. and Gerek,O.N. (2006). Power Quality Event Analysis Using Higher Order Cumulants and Quadratic Classifiers. IEEE Transactions on Power Delivery, Vol.21, No.2, April 2006, pp.1-7.
[17] Chen,C.I. and Fu,Y.T. (2010). Hybrid Power Quality Events Detection Method with Wavelet and ADALINE. 2010 International Conference on Power System Technology, pp. 1-8.
48
[19] Montero-Hernández,O.C. and Enjeti,P.N. (2005). A Fast Detection Algorithm Suitable for Mitigation of Numerous Power Quality Disturbances. IEEE TRANSACTIONS ON INDUSTRY APPLICATIONS, VOL. 41, NO. 6, NOVEMBER/DECEMBER 2005, pp.1-7.