Application of Digital Camera and Digital Image
Processing Techmique for Molecular Absorption Analysis
in the Visible Spectrum
Anastas Dakashev
1,*, Stancho Pavlov
2, Krasimira Stancheva
11Department of Inorganic and Analytical Chemistry, Prof. Dr. Assen Zlatarov University, 8010 Bourgas, Bulgaria 2Department of Mathematics and Physics, Prof. Dr. Assen Zlatarov University, 8010 Bourgas, Bulgaria
*Corresponding Author: [email protected]
Copyright © 2013 Horizon Research Publishing All rights reserved.
Abstract
A method of molecular absorption analysis in the visible spectrum has been developed that does not need monochromatic light and measuring the absorbance. Instead, pictures of the test color solution are taken using a digital camera. The digital image data are transferred to a personal computer through a capture card or a cable. Tristimulus values (R, G and B) representing image chromaticity are found. A polynomial regression equation is applied to describe the relation between one of the R, G or B tristimulus values and a concentration of the test solution in order to calculate the unknown concentration. A computer program is specially created to process all necessary operations. Solutions of MnO4-, Cr2O7 2-, Cu2+, Fe3+ and NH4+ with low -
and high - level concentrations are analyzed with good analytical characteristics.
Keywords
Molecular absorption analysis in the visible spectrum, Digital camera, Digital image processing
1. Introduction
Molecular absorption analysis in the visible spectrum appeared for the first time as a method called Visual colorimetry. Today, a commonly used method of Molecular absorption analysis is Spectrophotometry. Visual colorimetry is deferred from Spectrophotometry in the visible spectrum in some aspects: Spectrophotometry is based on passing monochromatic light, with specific wavelengths from the visible specter, through the test solution, and measuring, with a spectrophotometer, absorbance of the solution. Concentration of the test solution is then found comparing test solution absorbance with the absorbance of standard solutions. For Visual colorimetry polychromatic light of the entire visible specter (which is day light) is applied instead of monochromatic light. The solution absorbs light with some specific wavelengths of the visible specter, and as a result this solution is colored in the
solid hydrophobic film, membrane or foam of a polymer, in which chromogenic reagents are included [6-13]. Gas sensors were also developed. For analyzing sulfur dioxide, hydrogen cyanide and diphosgene in air, the air was passed through a filter, made of modified cotton fabric, which was previously saturated with a chromogenic reagent, and color spot on the filter was then analyzed [14-16]. Colorimetric sensor arrays for identification of toxic gases [17] and volatile organic compounds in gas phase [18] were developed as well.
All these analyses of liquid and gas samples with colorimetric sensors are based on measuring colors of the sensors, using digital color measuring devices and computer assistance. Digital color analyzer, color digital photographic camera or color flatbed scanner were applied as a measuring device. For above - mentioned analyses with optical sensors, actually reflected light was measured. Not light reflected from the sensor but light transmitted through a color solution is measured, in the present work. That allows all available examples of Molecular absorption analysis in the visible spectrum to be performed, measuring solution color instead absorbance of the solution. The method so developed will possess advantages of both: simplicity of Visual colorimetry and objectivity of the measurement. This method could become an alternative method to the Spectrophotometry.
Digital camera used for color measurements in the work, implements RGB color system. The RGB color system is formed by three main colors: red (R), green (G), and blue (B), which, added together, create the light of the color being measured. Amounts of these three kinds of light are expressed by their numerical values, named tristimulus values or coordinates [19].
2. Materials and Methods
Reagents, procedures of preparing colored solutions for all examples of analysis done in the work, are the same as for those of the standard Spectrophotometric analysis.
An amateur digital camera Panasonic DMC-LS5 is used for capturing an image of the colored solutions.
Pictures of sample and standard solutions are taken consecutively with a digital camera. The captured solution images are transferred to a personal computer through a capture card or a cable. A region on the image of the colored sample is selected. Color coordinates of the selected region are found. An algorithm that relates color coordinates to concentration is created. Finally the sample concentration is calculated.
Software, specially developed by us for the purpose, performs operations as follows: selecting in two ways a region on the color image; finding in three ways tristimulus values of the selected region; testing different order polynomial regressions or linear regression analysis to describe relation of tristimulus values to standard solution concentration; and finally calculating sample concentration.
3. Results and Discussions
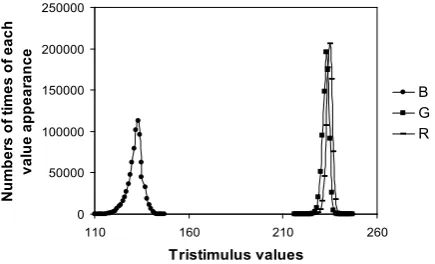
[image:2.595.323.541.288.420.2]The method presented here applies CIE RGB color system. Each color for this system is presented by its tristimulus values: R, G and B, and they have to be first found. The picture of test solution represents a color spot on some background. The background has to be separated (this being done by software) and tristimulus values of the remaining color spot to be found. Another approach for the same task is to select a region (for example a rectangular one) on the color spot with a click of the mouse, and then to find tristimulus values of the region selected. Although the selected region on the image of the test solution usually seams homogeneous, it actually consists of a variety of colors. Figure1 shows a statistical distribution of tristimulus values of a yellow-colored complex of ferric sulphosalicylic acid, used for determining iron (III).
Figure 1. Statistical distribution of R, G and B tristimulus values of the yellow - colored complex of ferric sulphosalicylic acid.
Each of the three coordinates has “bell-shaped” or normal statistical distribution. In principle the tristimulus values of a given image have to be the dominant R, G and B values that correspond to the dominant color of the image. For normal distribution of the thristimulus values, when increasing and decreasing parts of the distribution curve are symmetric, the most frequently appeared R, G and B values coincide with the mean value of all R values, mean value of all G values and mean value of all B values. In Fig.1 the distribution curves are only slightly asymmetrical. Because of this the tristimulus values found experimentally by the dominant R, G and B values and tristimulus values found by averaging in R, G and B color channel, differ from each other by no more than two or three tristimulus value units. Two ways of determining the dominant three tristimulus values are applied in the work: by the most frequently appeared simultaneously three tristimulus values and by the most repeated thristimulus value in each of the three color channels. The tristimulus values found by these two manners are almost equivalent but the method of the separate color channels must be chosen. When the color spot is homogeneous, there are no significant differences in tristimulus values, found by the two ways of selecting a color image. When the color spot is not homogeneous, a selection by mouse clicking is preferred because a homogeneous part
0 50000 100000 150000 200000 250000
110 160 210 260
of the image can be separated. Generally, the selection of an entire color spot has an advantage because more reliable information can be taken from the whole color spot. An influence of the different ways of selecting and finding image coordinates upon the final results of analysis is tested by means of R-square coefficient. R-square coefficient shows how points are situated around a curve. From the dispersion of points around the standard calibration curve one can get information about the results of the analysis. When the dispersion is diminishing, shown by the R-square value is tending to one, the results of the analysis become more favorable. From the data for R-square values given in Table 1, one can conclude that determining the tristimulus values by averaging and by finding the most repeated value in every color channel give almost equal results, while the method of repeating the three tristimulus values simultaneously does not give so accurate results. When distribution curve is asymmetric or has more than one maximum, averaging method gives better results. For the method of selecting the whole color spot the results are less successful than those of the method of a selection by mouse clicking because of an indistinct border between the color spot and background.
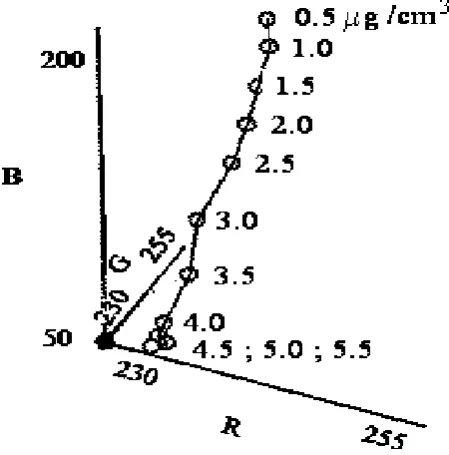
Figure 2. Three - dimensional view of tristimulus values of the yellow - colored complex of ferric sulphosalicylic asid at different concentrations. When the concentration of the colored solution is changed, the color of the solution and respectively its tristimulus values are also changed. Figure 2 shows a three dimensional picture of tristimulus values at different concentrations. Linear regression analysis can be implemented in order to solve the dependence of tristimulus values on standard solutions concentration and to find unknown concentration. The dependences of every tristimulus value on concentration are presented in Fig 3. The value of B undergoes significant
changes while the changes for R and G values are insignificant. It is the same for all examples of analysis done in the work: one of the three tristimulus values undergoes great changes while for the other two the changes are slight. It is better to use only the tristimulus value having large changes, instead of all three values because by using one of the tristimulus values, the results of analysis are even better than when using all the three values.
For analysis of Fe (III), the following results were
achieved: for 1.0 μg/cm3 Fe (III) introduced, we found 1.25
μg/cm3 Fe (III), SD= 0.22 μg/cm3 by the three tristimulus
values, and respectively 0.996 μg/cm3 Fe (III) and SD=
0.017 μg/cm3 by B tristimulus value. Five numbers of
determinations were done for each case of analysis. The curve representing dependence of B tristimulus value on concentration, in Fig. 3, has a horizontal part (section III). This part of the curve cannot be used for analytical purposes. The remaining part of the curve forms an interval of concentrations that can be determined by the method proposed here. This part of the curve at low concentrations has a section with a small slope (section I), followed by a section with a steep slope at higher concentrations (section II).
[image:3.595.318.545.445.673.2]The analytical characteristics, such as sensitivity of analysis, accuracy and probability are better for the steep slope section of the essential part of the curve. In present work the essential part of the curve is treated with different order polynomial regressions. The order of the polynomial regression depends on a position of the standard calibration curve on the useful part of the curve B in Fig. 3.
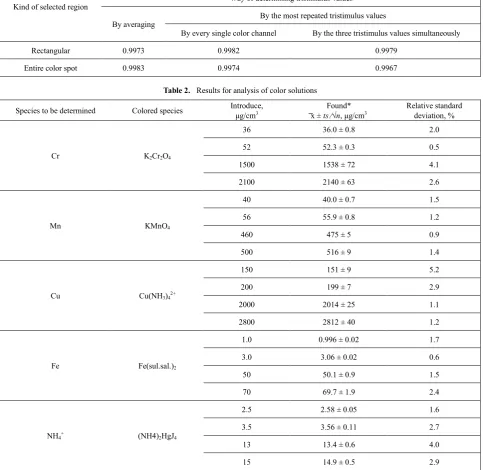
Table 1. Influence of the kind of selected region and the way of determining tristimulus values upon the results of analysis indicated by R-square value.
Kind of selected region
Values of R-square Way of determining tristimulus values
By averaging By the most repeated tristimulus values
By every single color channel By the three tristimulus values simultaneously
Rectangular 0.9973 0.9982 0.9979
[image:4.595.64.548.118.588.2]Entire color spot 0.9983 0.9974 0.9967
Table 2. Results for analysis of color solutions
Species to be determined Colored species Introduce, μg/cm3 ͞x ± ts ⁄√nFound* , μg/cm3 Relative standard deviation, %
Cr K2Cr2O4
36 36.0 ± 0.8 2.0
52 52.3 ± 0.3 0.5
1500 1538 ± 72 4.1
2100 2140 ± 63 2.6
Mn KMnO4
40 40.0 ± 0.7 1.5
56 55.9 ± 0.8 1.2
460 475 ± 5 0.9
500 516 ± 9 1.4
Cu Cu(NH3)42+
150 151 ± 9 5.2
200 199 ± 7 2.9
2000 2014 ± 25 1.1
2800 2812 ± 40 1.2
Fe Fe(sul.sal.)2
1.0 0.996 ± 0.02 1.7
3.0 3.06 ± 0.02 0.6
50 50.1 ± 0.9 1.5
70 69.7 ± 1.9 2.4
NH4+ (NH4)2HgJ4
2.5 2.58 ± 0.05 1.6
3.5 3.56 ± 0.11 2.7
13 13.4 ± 0.6 4.0
15 14.9 ± 0.5 2.9
* t is Students t-value at 95% probability, s is standard deviation, n is number of determinations, n = 5.
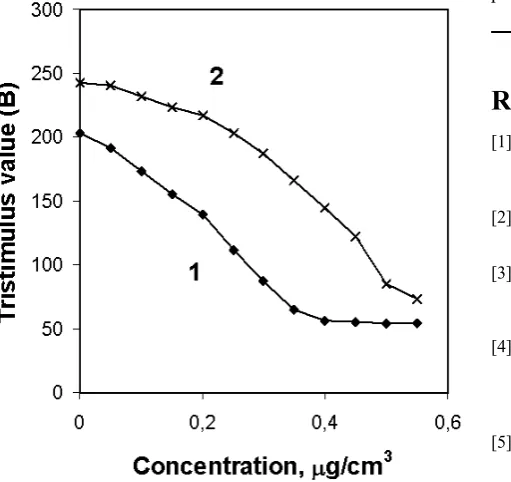
Both curves on Fig. 4 are obtained by images of the same standard solutions. The information in Curve 2 is found from pictures taken of the standard solutions which are illuminated more intensively, while for curve 1 the illumination of the solutions is less intensive. The slope of curve 1 is bigger than that of curve 2. In order to find the sensitivity of the method, experimental points of the useful part of the curve are connected with straight lines to achieve a broken line as it is done in Fig.4. The slope of each part of the broken line is determined and then a mean value of all slope values is calculated. The mean, calculated in this way,
is the sensitivity. The slope of a straight line, passing through the first and the last point of the useful part of the curve, gives the same result for the absolute value of sensitivity. Sensitivity values for curve 1 and curve 2 are respectively
39.4 and 30.9 tristimulus value units per 1 μg/cm3
concentration. Detection limit, determined by the three - time standard deviation method, for curve 1 and curve 2 is
respectively 0.2 and 0.55 μg/cm3. The interval of
concentration for curve 1 is from 0.2 to about 4.0 μg/cm3,
and from 0.55 to about 5.5 μg/cm3 for curve 2. In conclusion:
characteristic of the method. An increase in intensity of illumination decreases the sensitivity, worsens the detection limit but allows determining of higher concentrations. Whereas, a diminution in intensity of illumination improves the sensitivities and the detection limit and makes possible the determination of lesser concentrations. Data for analysis of color solutions with low and high level concentrations, corresponding to lower and higher intensity of illumination, are shown in Table 2. Results are acceptable. The investigations confirm that better results are achieved for concentrations corresponding to the section of calibration curve having a larger slope, i. e. an appropriate illumination is to be chosen so that test solution to get into the calibration curve section with a bigger slop.
Figure 4. Influence of intensity of illumination on tristimulus value vs. concentration calibration curve. Curve 1 is for less and curve 2 is for a more intensive illumination
4. Conclusion
The developed method is easy to perform and has good analytical characteristics. An important advantage of the method is an ability to analyze both low and high level concentrations by means of changing the intensity of illumination, when pictures of tests solutions are taken. The use of digital camera gives several advantages. Digital camera excels over any other photo detector. It gives a big amount of information. The image consists of millions color points (pixcels). The digital information taken from a color picture is convenient for software processing. Because the digital camera at certain conditions functions as an absolute tristimulus colorimeter [20], it is possible for an absolute analysis to be performed, i. e. an analysis without a calibration curve, but only by previously obtained data for
tristimulus values and the corresponding concentrations to them. The kinetic of color reaction can be studied if a digital video camera is used.
The method could be further developed. Arguments for this statement are as follows: There are many other color systems, apart from those used in the process of the work, for which correlation with concentration can be found. A modern digital camera has many opportunities to create a color image. Using these opportunities, a more accurate image can be achieved and in this way the result of the analysis can be improved. This also can be done by precisely arranging the scene and preparing the conditions for taking a picture. A variety of software for processing and editing color images is available which could be used for analytical purposes as well.
REFERENCES
[1] F. Rouessac, A. Rouessac. Chemical Analysis. Modern Instrumentation Methods and Techniques, John Wiley & Sons, Chichester, 2007.
[2] Chemtech International, Online available from http://chemtech-usa.com/wastewater.htm
[3] V. G. Amelin. Indicator Papers in Test Methods of Visual Colorimetry, Jounal of Analytical Chemistry, Vol. 57, No 8, 733-738, 2002.
[4] O. K. Khim, N. Ismail, S. H. Jamal, M. L. Jabit, N. A. Azmi. Development of Arsenic Detection Test Kit for Military Field Drinking Water, Journal of Defence and Security, Vol. 1, No 2, 251 – 257, 2010.
[5] E. Hirayama, T. Sugiyama, H. Hisamoto, K. Suzuki. Visual and Colorimetric Lithium Ion Sensing Based on Digital Color Analysis, Analytical Chemistry, Vol. 72, No 3, 465-474, 2000.
[6] C. Zhang, S. Suslick. Colorimetric Sensor Array for Soft Drink Analysis, Journal of Agricultural and Food Chemistry, Vol. 55, No 2, 237-242, 2007.
[7] Y. Suzuki, K. Suzuki. Optical Sensors for Ions and Protein Based on Digital Color Analysis, Springer Series on Chemical Sensors and Biosensors Vol. 3, 343-365, 2005. [8] R. Volinskya, M. Kligerb, T. Sheynisa, S. Kolusheva, R.
Jelineka. Glass-Supported Lipid/Polydiacetylene Films for Colour Sensing of Membrane-Active Compounds, Biosensors & Bioelectronnics, Vol. 2, 3247-3251, 2007. [9] S. V. Muravyov, N. A. Gavrilenko, A. S. Spiridonova, S. V.
Silushkin. Digital Color Analysis for Chemical Measurements Based on Transparent Ppolymeric Optodes, Online available from http: //www.researchgate.net/publicati on/
[10] N. A. Gavrilenko, G. M. Mokrousov, O. V. Dzhiganskaya. An optical Sensor for the Determination of Ascorbic Asid, Journal of Analytical Chemistry, Vol. 59, No 9, 871-874, 2004.
Badakova, L. N. Pyatkova. Use of a Scanner and Digital Image-Processing Software for the Quantification of Adsorbed Substances, Journal of Analytical Chemistry, Vol. 59, No 2,102-106, 2004.
[12] N. A. Gavrilenko, N. V. Saranchina, G. M. Mokrousov. A Sensitive Optical Element for Mercury(II). Journal of Analytical Chemistry, Vol. 62, No 9, 832-836, 2007. [13] W. Xueqin, S. Yang, M. Xue, L. Yan, Y. Jianyong , W.
Huaping , D. Bin. Colorimetric Sensor Strips for Formaldehyde Assay Utilizing Fluoral-p Decorated Polyacrylonitrile Nanofibrous Membranes. Analyst, DOI: 10.1039/C3AN00812F, 2013.
[14] V. Pitschmann, Z. Kobliha, E. Halamek, I. Tuzarova. Simple
in situ Visual and Tristimulus Colorimetric Determination of
Sulfur Dioxide in Air, Journal of Analytical and Enviremental Chemistry, Vol. 7, No2, 120 – 124, 2006.
[15] V. Pitschmann, I. Tusarova, E. Halamek, Z. Kobliha. The Use of Tristimulus Colorimetry for the Determination of Hydrogen Cyanide in Air by a Modified König Method, Journal of Serbian Chemical Society, Vol. 75, No 6, 813-822, 2010.
[16] V. Pitschmann, Z. Koblina, E. Halamek, I. Tusarova. A Simple in situ Visual and Tristimulus Colorimetric Method for the Determination of Diphosgene in Air, Journal of Serbian Chemical Society, Vol. 72, No 10, 1031-1037, 2007. [17] L. Feng, C. J. Musto, J. W. Kemling, S. H. Limb, K. S.
Suslick. A Colorimetric Sensor Array for Identification of Toxic Gases Below Permissible Exposure Limits, The Royal Society of Chemistry, Chemical Communications, Vol. 46, 2037-2039, 2010.
[18] M. C. Janzen, J. B. Ponder, D. P. Bailey, C. K. Ingison, K. S. Suslick. Colorimetric Sensor Arrays for Volatile Organic Compounds, Analytical Chemistry, Vol. 78, No 11, 3591-3600, 2006.
[19] D. Pascale. A Review of RGB Color Spaces, Babel Color, Montreal, 2003.