Probability Distribution Fitting of Rainfall Patterns in
Philippine Regions for Effective Risk Management
Ma. Dely P. Esberto
Doctor of Engineering (Civil Engineering) Program, School of Graduate Studies, College of Engineering, Mindanao State University, Iligan Institute of Technology, Iligan, Philippines
Copyright©2018 by authors, all rights reserved. Authors agree that this article remains permanently open access under the terms of the Creative Commons Attribution License 4.0 International License
Abstract
This study aims to determine the best fit frequency distribution of rainfall patterns for event forecasting in order to address potential disasters. The monthly rainfall data were taken from the PAGASA which are analyzed using Chi-Square and K-S goodness-of-fit tests. Rainfall data for the past 26-30 years was used to determine the distribution pattern fitted into more than 60 Probability Distribution Functions (PDF). The best fitted PDF both in Kolmogorov-Smirnov and in Chi-square tests were used in statistical inferences. Findings showed that each site has specific theoretical probability distribution functions to infer rainfall events. Varying levels of rainfall events were measured using the CDF. Consequently, the statistical inferences found in this study are important for designing optimum flood control facilities. Moreover, it is also contributory for the effective management of irrigation system of the National Irrigation Administration for a more efficient water supply to the agricultural sector.Keywords
Distribution Fitting, Rainfall1. Introduction
Rainfall is the most important environmental factor contributory to agricultural activities of the Filipino people across regions in the country. Irrigation supply depends much on the availability of water where the volume distribution is based on the available water resources such as spring, river, and rainfall. Water supply through irrigation is an important strategy in alleviating the current food crisis. However, rain-fed agriculture is still the domi-nant practice in most upland areas. Soil moisture manage-ment in some areas of the country is faced with limited and unreliable rainfall and high variability in rainfall pattern.
Collection and measurement of hydrological data proved difficult on the part of hydrologists due to limited data with some gaps in the series. It is vital to study the variability of rainfall pattern to address climate changes which resulted
to occurrences of floods and droughts in several regions. Dry and wet seasons can be felt simultaneously in the country. When parts in Luzon have been flooded, most areas in Mindanao were experiencing dry season and vice versa as claimed by South Travels [1]. It can be observed that the Philippines have been devastated by these famines for quite a time now. We have been receiving news of flash flood events in various parts of the country, the latest of which occurred in Northern Mindanao, while other areas (Luzon for instance) are experiencing limited rainfall. Similar variations can also be noted in other parts of the globe as reported by JPL TRMM Team [2] and Melville [3].
Such variation can also be noted within adjacent regions or provinces where dry season is widespread in most regions, but some geographical areas are severely hit by excessive monsoon rain leading to flash floods. One example of the incident earlier cited was the December 2010 storm that swept the cities of Iligan and Cagayan de Oro into a severe state of calamity. In contrast, most areas in other regions such as Region XII did not experience heavy rainfall during the time that the storm smashed the two cities.
and disaster management in terms of flood estimation, forecasting of extreme events and the return period, water management and civil works
2. Objectives
This study aims to determine the distribution of rainfall patterns of Cotabato City, General Santos City, Lumbia Misamis Oriental and Kabacan North Cotabato. Specifically, it aims to investigate the shape of frequency distribution curves of rainfall; verify the theoretical distribution function best fit to describe the monthly and annual rainfall patterns; determine the exceedance probability and the return period of occurrence; and calculate probability of events of the four sites.
3. Materials and Methods
3.1. Research Design
The study used available rainfall data of Cotabato City (1986-2011), General Santos City (1982-2011), Kabacan North Cotabato (1985-2011) and Lumbia Misamis Oriental (1982-2011) in Mindanao. The methods of statistical analysis employed distribution fitting and probability estimates. To be able to test the samples for normality, a simulation model with proven reliability was used for the distribution fitting utilizing Chi-Square and Kolmogorov-Smirnov goodness-of-fit tests.
3.2. Collection of Data and its Reliability
Rainfall data of the study sites from 1982 to 2011 was collected from the Climatology Division of the PAGASA Main Headquarters and from USM Agromet Station. Due to limited sources, data reliability check cannot be pursued but to consider the data taken from the official documents of PAGASA and local Agromet Stations to be reliable.
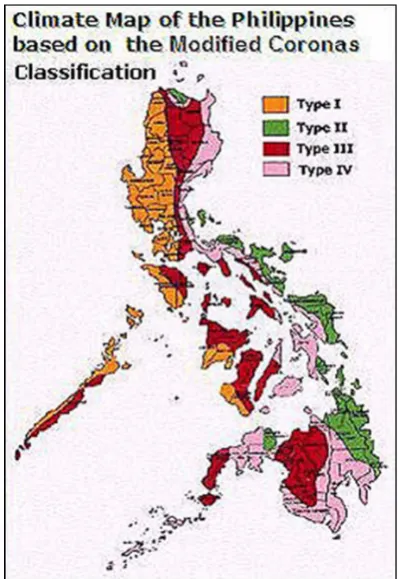
evenly distributed throughout the year. The former is considered one of the driest places in the county. Kabacan is characterized by dry season for one to three months with less than 76 millimeters or more rainfall per month throughout the year. The wettest month has more than three times the rainfall of the driest month. This type of climate is conducive to intensive rice cultivation and plantings of bananas and other fruit trees according to Wikipedia [9]. On the other hand, Cotabato City with 70% of its total land area is below sea level, belongs to Type 3 category, for which seasons are not very pronounced but relatively dry from November to April and wet during the rest of the year, while Lumbia Misamis Oriental is Type 2 (Figure 1).
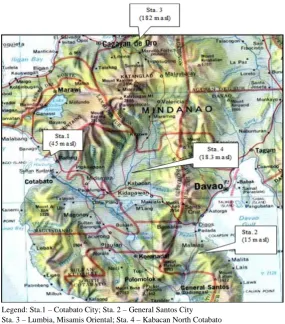
[image:2.595.321.521.357.647.2]Legend: Sta.1 – Cotabato City; Sta. 2 – General Santos City Sta. 3 – Lumbia, Misamis Oriental; Sta. 4 – Kabacan North Cotabato
Figure 2. Study Sites’ geographical location (Photo credits: mseas.mit.edu)
Cotabato City has heavier rainfall during the months of May to November, while General Santos City has no pronounced wet season, but rainfall is evenly distributed throughout the year. Meanwhile, Lumbia Misamis Oriental has its wet months from June to October while Kabacan, has its pronounced rainy season from May to November, otherwise, the rest of the months are dry.
Table 1. Range of rainfall data, altitude, and hydro-climatic type of the weather stations
Station Rainfall Data
Range
Altitude (masl)
Precipitation (mm)
Climatic Type
1 1986 to 2011 45.0 2464.30 3
2 1982 to 2011 15.0 949.70 4
3 1982 to 2011 182.0 1724.50 2
4 1985 to 2011 18.3 1531.80 4
Legend: 1 – Cotabato City; 2 – General Santos City; 3 – Lumbia, Misamis Oriental; 4 – Kabacan North Cotabato
The geographical locations of the four study sites are also shown in Figure 2. Among the four stations, Lumbia is located the highest at 182 meters above sea level while General Santos City is situated the lowest at 15 meters above sea level with the lowest average rainfall level recorded at only 949.70mm. Cotabato City has the highest average precipitation of 2,464.3mm for the period covered in this study (Table 1).
3.4. Distribution Fitting
The data was analyzed using a simulation model to determine the specific theoretical probability distribution that is best fitted to describe the annual and monthly rainfall. Note that the monthly rainfall for each site was treated separately, for example, the rainfall data for the month of January from 1986-2011 for station 1 was processed in the distribution fitting software. As a result, the Chi-Square and K-S GoF tests generated their best fit frequency curves for that month. Either of these curves are the PDFs that can best describe the rainfall pattern of the station for that month (January). The same procedure was done to all stations from January to December; and, to the total annual and average annual rainfall data for the period covered specific in each site.
This software was chosen by the author since it supports sixty (60) probability distribution functions including the Chi-Square and K-S goodness-of-fit tests. This test measures the "distance" between the data and the distribution being tested. The fit is considered good if the distance (or test statistic) is less than the critical value
[image:3.595.58.289.545.626.2]In the study of Tilahun [7], two statistical tools namely Chi-square and kolmogorov-smirnov goodness-of-fit tests were used to identify which theoretical probability distribution function best fits the rainfall data. This technique was used in this study, where two different results were generated. This might confuse the reader to think which is more reliable between the two. In most instances the Chi-square test gave its best fitted theoretical probability distribution based on Gaussian assumption of normality. It must be noted that the Chi square goodness-of-fit test depend only on the set of observed and expected frequencies and degrees of freedom. To be valid, Chi-square relies much on sample size and can be used for any sample population if the assumption on minimum expected cell frequency of not less than five (5) is met. This kind of test is non-parametric in the sense that it does not involve any population parameters or characteristics. In contrast, the K-S test statistic does not depend on the underlying cumulative distribution function being tested. It is an exact test which assumes that the data follow a specified distribution. It is a kind of a parametric statistic that performs well under a wide range of distributional assumptions which in general is more powerful than those of the non-parametric techniques. However, the use of non-parametric tool is preferred if the distributional assumption is not justified.
4. Results
4.1. Best-fitted Theoretical Distribution
The rainfall data of each of the four sites was fitted to determine the distribution that can best describe the monthly and annual rainfall. The model used in distribution fitting supports three types of reliability tests namely Kolmogorov-Smirnov, Anderson-Darling and Chi-Square. In this study, rank results generated from K-S and Chi Square were considered as the best PDF curves to describe the monthly and annual rainfall in each of the four sites. In most instances, each test confirmed different best theoretical distributions for a given data.
4.2. Total Annual and Average Annual Rainfall
Table 2 exhibits two PDF curves which ranked number
are useful for predicting exceedance probabilities and the return periods. The importance of such information is vital for civil engineering works such as design of dams and other flood control structures. The data on average annual rainfall is useful on irrigation projects where estimation of an effective rainfall that will exceed a given percent chance of occurrence can be determined as suggested in the USDA, SCS (1967) based on the study of Nieber [10].
Table 2. Best fitted theoretical probability distributions using Chi- Square and K-S goodness-of-fit (GoF) tests applied to total annual and average annual rainfall
Station Total Annual Average Annual
Cotabato City Weibull 3P / Johnson
SB Johnson SB / Weibull
General Santos City Kumaraswamy / Log
earson 3 Log Pearson 3 / Beta
Kabacan N Cotabato Rice / Weibull Log Logistic /
Weibull 3P Lumbia Misamis
Oriental Error / Log Pearson 3
Pearson 5 (3P) / Log Pearson 3
[image:4.595.308.536.576.719.2]Distribution fitting showed the total annual rainfall of Cotabato City can be fitted to Weibull 3P and Johnson SB (Figure 6). On the other hand, Figure 7 illustrates an Error and Log Pearson 3 distribution to forecast events associated with the total annual rainfall of Lumbia Misamis Oriental. For General Santos City, the software simulated Kumaraswamy and Log Pearson 3 (Figure 8) to be the crucial models to illustrate the total annual data. Finally, Weibull and Rice are the two best fit theoretical distributions for the total annual rainfall of Kabacan North Cotabato (Figure 9).
Figure 7. Best fitted PDF curves of Lumbia Misamis Oriental total annual rainfall
Figure 8. Best fitted PDF curves of General Santos City total annual rainfall
Figure 9. Best fitted PDF curves of Kabacan N. Cotabato total annual rainfall
4.3. Monthly Rainfall
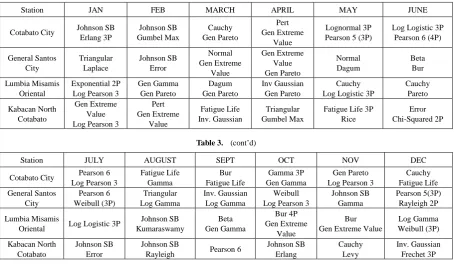
[image:5.595.307.537.80.229.2]Table 3 showed various PDF curves which ranked number one from each statistical test. To cite one, the rainfall data for the month of January for Cotabato City can be best described by a Johnson SB (K-S ranks no.1) or by an Erlang3P distribution (Chi-Square ranks no.1). Each month of the year is fitted to two distribution types which also vary because of the unique rainfall diversity. In other words, the monthly rainfall data of the station for the period of 26 years is best described by up to 19 theoretical probability distribution frequencies. The rest of the three sites can also be described by more than ten probability distributions.
Table 3. Best fitted theoretical probability distributions using Chi-Square & K-S goodness-of-fit (GoF) tests applied to monthly rainfall
Station JAN FEB MARCH APRIL MAY JUNE
Cotabato City Johnson SB
Erlang 3P Johnson SB Gumbel Max Cauchy Gen Pareto Pert Gen Extreme Value Lognormal 3P Pearson 5 (3P)
Log Logistic 3P Pearson 6 (4P)
General Santos City Triangular Laplace Johnson SB Error Normal Gen Extreme Value Gen Extreme Value Gen Pareto Normal Dagum Beta Bur Lumbia Misamis Oriental Exponential 2P Log Pearson 3
Gen Gamma Gen Pareto Dagum Gen Pareto Inv Gaussian Gen Pareto Cauchy Log Logistic 3P
Cauchy Pareto Kabacan North Cotabato Gen Extreme Value Log Pearson 3
Pert Gen Extreme Value Fatigue Life Inv. Gaussian Triangular Gumbel Max
Fatigue Life 3P Rice
[image:5.595.62.293.81.216.2]Error Chi-Squared 2P
Table 3. (cont’d)
Station JULY AUGUST SEPT OCT NOV DEC
Cotabato City Pearson 6
Log Pearson 3
Fatigue Life Gamma Bur Fatigue Life Gamma 3P Gen Gamma Gen Pareto Log Pearson 3
Cauchy Fatigue Life General Santos City Pearson 6 Weibull (3P) Triangular Log Gamma Inv. Gaussian Log Gamma Weibull Log Pearson 3
Johnson SB Gamma
Pearson 5(3P) Rayleigh 2P
Lumbia Misamis
Oriental Log Logistic 3P
Johnson SB Kumaraswamy Beta Gen Gamma Bur 4P Gen Extreme Value Bur Gen Extreme Value
Log Gamma Weibull (3P) Kabacan North Cotabato Johnson SB Error Johnson SB
Rayleigh Pearson 6
[image:5.595.59.290.255.401.2] [image:5.595.71.526.464.728.2]graphs as well as checking the result using the distribution equations available in existing resources. When using the equations, please also note that the parameters are already provided together with the corresponding simulated PDF results given by the distribution fitting software. Results obtained from calculations using the distribution equations (PDF) give the same values when using the CDF graph.
Figure 10. CDF Curve of Cotabato City total annual rainfall
Figure 11. CDF Curve of Kabacan N Cot. total annual rainfall
Figure 12. CDF Curve of Gen San City total annual rainfall
Figure 13. CDF Curve of Lumbia Mis. Or. total annual rainfall
For an illustration, using Log Pearson 3 curve in the cumulative distribution function (CDF) graph of Figure 13, the following probability of events are calculated for Lumbia Misamis Oriental:
P(1800<X<2200) = P(X<2200) - P(X<1800) = F(2200) - F(1800) = 0.93 - 0.60 = 0.33
P(1500<X<1800) = P(X<1800) - P(X<1500) = F (1800) - F(1500)
= 0.60 - 0.26 = 0.34 P(x<1500) = 0.26 P(X>2200) = 1 - P(X<2200)
[image:6.595.306.536.238.371.2] [image:6.595.59.291.300.444.2] [image:6.595.61.290.473.622.2]Computation results mean that for the total annual precipitation of Lumbia, the site will experience a rainfall between 1500mm to 1800mm (34%) and up to 1800 to 2200mm range (33%). A rainfall of less than 1500mm is likely to occur at 26% and an event beyond 2200mm at 7% chance.
4.5. Determination of Exceedance Probability (EP) and the Return Period (RP)
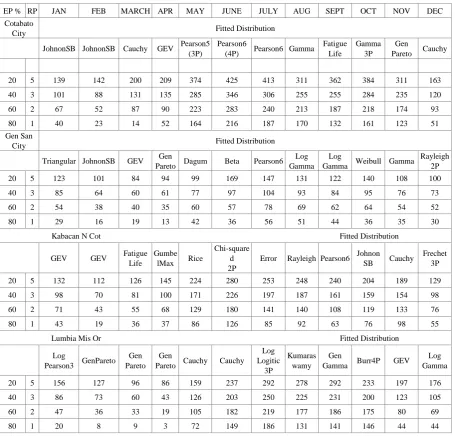
The exceedance probability levels (EP) of the four stations are presented in monthly expected rainfall with the corresponding return periods (RP) in tabular form showing the fitted EP results of the sites (Table 9). One can be optimistic to assume that a given rainfall would be equalled or exceeded at different exceedance probability levels particularly at 60% and 80%. Although at 20% level, one
must be conservative not to rely too much on this rainfall but to plan for a supplemental water source for the water management sectors such as the Local Water Districts whose water source is from spring. Also, a good forecast of monthly rainfall in advance is required for the optimal management of the hydroelectric power production system.
Correspondingly, relevant information can be read from CDFs of average annual rainfall to give a direction in managing the water requirements of the agricultural sector by the National Irrigation Administration (NIA).
[image:7.595.72.528.310.746.2]In addition, it can be noted that the exceedance probability estimates using the total annual rainfall can also be determined using the same procedure (CDF reading) for purposes of designing dams, landfill drainage, rock slopes, bridges and other public safety facilities.
Table 9. Expected monthly rainfall amounts (mm) at different exceedance probability levels and the corresponding return period using fitted distribution
EP % RP JAN FEB MARCH APR MAY JUNE JULY AUG SEPT OCT NOV DEC
Cotabato
City Fitted Distribution
JohnonSB JohnonSB Cauchy GEV Pearson5
(3P)
Pearson6
(4P) Pearson6 Gamma
Fatigue Life
Gamma 3P
Gen
Pareto Cauchy
20 5 139 142 200 209 374 425 413 311 362 384 311 163
40 3 101 88 131 135 285 346 306 255 255 284 235 120
60 2 67 52 87 90 223 283 240 213 187 218 174 93
80 1 40 23 14 52 164 216 187 170 132 161 123 51
Gen San
City Fitted Distribution
Triangular JohnonSB GEV Gen
Pareto Dagum Beta Pearson6
Log Gamma
Log
Gamma Weibull Gamma
Rayleigh 2P
20 5 123 101 84 94 99 169 147 131 122 140 108 100
40 3 85 64 60 61 77 97 104 93 84 95 76 73
60 2 54 38 40 35 60 57 78 69 62 64 54 52
80 1 29 16 19 13 42 36 56 51 44 36 35 30
Kabacan N Cot Fitted Distribution
GEV GEV Fatigue
Life Gumbe
lMax Rice
Chi-square d 2P
Error Rayleigh Pearson6 Johnon
SB Cauchy
Frechet 3P
20 5 132 112 126 145 224 280 253 248 240 204 189 129
40 3 98 70 81 100 171 226 197 187 161 159 154 98
60 2 71 43 55 68 129 180 141 140 108 119 133 76
80 1 43 19 36 37 86 126 85 92 63 76 98 55
Lumbia Mis Or Fitted Distribution
Log
Pearson3 GenPareto
Gen Pareto
Gen
Pareto Cauchy Cauchy
Log Logitic
3P
Kumaras wamy
Gen
Gamma Burr4P GEV
Log Gamma
20 5 156 127 96 86 159 237 292 278 292 233 197 176
40 3 86 73 60 43 126 203 250 225 231 200 123 105
60 2 47 36 33 19 105 182 219 177 186 175 80 69
80 1 20 8 9 3 72 149 186 131 141 146 44 44
The monthly rainfall variables are fitted to several probability density functions. As described above, certain types of variables follow specific distributions that can best describe the data. Since the PDF curves are already fitted for each of the monthly rainfall data of the four study sites, one can therefore use these distribution curves for prediction of events such as maximum rains, or minimum available rainfall occurring within a specific month.
The total annual and average annual rainfall data of the four stations showed different probability distributions in the sense that the data for the total annual rainfall was taken from the sum of the total monthly rainfall of sites in a year. In contrast, the average annual rainfall was taken from the sum of the twelve monthly average rainfall data. There is a variation in the figures for the total and average annual rainfall as evidenced by different frequency curves generated through the simulation process. The results for the total annual rainfall should not be confused with that of the average annual rainfall because the information for the former cannot be applied to the latter. The utilization of information depends upon which data is needed by the end-user, as explained earlier.
The statistical inferences above is crucial to the agricultural sector to be able to plan ahead of time (Pulhin, [11]) particularly now that the Philippines has recorded several typhoons and flash floods, and dry spells (WHO [12]) as a result of climate change also experienced by other countries. Reference [13] recorded famines of long drought in Southern Mindanao and the tropical cyclone which adversely affected the agricultural sector. In fact, reports said that there have been alterations in the farmers’ planting calendar due to changing rainfall pattern as documented by IRIN [14].
5. Conclusions
Based on the above findings, it is often desirable to understand the shape of the underlying distribution of the population for sound predictive purposes. One can draw a conclusion with confidence since the best fitted theoretical distribution for a given data is determined using parametric and non-parametric tools. It can be observed that there are differences in the PDFs generated and this is attributed to the variation of the sample population. There is a specific frequency distribution for each test statistic performed, or
observed and expected frequencies and degrees of freedom while the K-S test does not depend on the cumulative distribution frequencies because it assumes that any test statistic follows a specified distribution function. Using either way is not much of an argument. We can use the best fitted PDFs to forecast rainfall patterns of the sites such as the probability of occurrence of rainfall intensities and these predictions are considered with higher reliability. The argument whether the parametric is better than the non-parametric tool is beyond the scope of this study.
Since research findings revealed that rainfall data follows a specific frequency curve, this data was made available in this study for future hydrological processing of information. It is not just enough to be aware what has taken place in the area for the last three decades. Having just in mind that the place is vulnerable to the effects of extreme rainfall is futile without utilizing a statistical tool to responsibly forecast climatic patterns with greater confidence. The researcher therefore concludes that the findings discussed in this instrument can be used as a guide for development planners, agricultural sectors, water management agencies‚ civil works (design of dams‚ bridges‚ drainage and other related structures), hydroelectric power plants as well as in hydrological planning (flood and drought estimation) and disaster management.
Acknowledgements
This work is dedicated to my family. First and foremost, to our Supreme Creator for His guidance and wisdom, without Him, nothing would be accomplished. My deepest thanks and gratitude goes to my beloved and dearest mother, for her benevolence; to my children Ian Kesniel, Phoevi Anngelli, Ivhan Daryll and Ivy Mayla, who served as my inspirations and to my husband, for his untiring support and understanding.
REFERENCES
[1] South Travels.com, 2012. Weather and climate in Philippines. Online available from
lippines.html
[2] JPL TRMM Team, 2005. Global rainfall patterns. NASA, Earth Observatory Online available from
https://earthobservatory.nasa.gov/IOTD/view.php?id=5275
[3] Melville, Kate, 2010. Study finds alarming changes in rainfall patterns. Science a GoGo, the latest science news, research tidbits and science discussion. Online available from
http://www.scienceagogo.com/news/20100904173710data _trunc_sys.shtml
[4] David M. Hillis, Rainfall patterns at the Fly Gap Division of the Double Helix Ranch, Mason County, Texas. Online available from
http://doublehelixranch.com/FlyGapRainTrends.html
[5] Bureau of Meteorology, 2010 Australian rainfall patterns during La Niña events, Bureau of Meteorology, Australian Government, IDCKGEERL0. Online available from http://www.bom.gov.au/climate/enso/ninacomp.shtml
[6] Kumar, S., et. al., 2012. Spatial and Temporal Changes in Rainfall Patterns in Coffee Landscape of Kodagu, India. International Journal of Environmental Sciences, Vol. 1 No. 3. pp. 168-172. 2277-1948. 2012. ISSN 2277 – 1948.
[7] Tilahun, K., (2006). The characterisation of rainfall in the arid and semi-arid regions of Ethiopia. Online available from
http://www.wrc.org.za/Knowledge%20Hub%20Document s/Water%20SA%20Journals/Manuscripts/2006/03/WaterS A_2006_03_1946.pdf
[8] Persson, K., Rydén, J. (2010). Exponentiated Gumbel distribution for estimation of return levels of significant wave height. Journal of Environmental Statistics 1: 1–12. [Google Scholar].
[9] Wikipedia. Online available from
https://en.wikipedia.org/wiki/Kabacan,_Cotabato#Climate
[10] Nieber, J. L., and Patwardhan, A. S. (1988). "Estimation of effective rainfall." Research project completion report, Contract No. USDI-5-CR-81-07420, U.S. Dept. of Interior, Bureau of Reclamation, Feb., Denver, Colo.
[11] Pulhin, J., Peras, R., Pulhin, F., 2009. Farmers’ Adaptation to Climate Variability: Assessment of Effectiveness and Barriers Based on Local Experience in Southern Philippines. Journal of Environmental Science and Management. ISSN 0119-1144.
[12] World Health Organization, 2012. Climate change country profile: Philippines. Online available from http://www.wpro.who.int/environmental_health/documents /docs/PHL_92EC.pdf
[13] Climate Change Philippines, 2009. Philippines loses billions to climate change. Online available from http://climatechangephilippines.blogspot.com/2009/08/phil ippines-loses-billions-to-climate.html
[14] IRIN, 2009. Philippines: Farmers hit by changing rainfall patterns. IRIN, Humanitarian news and analysis,a service of the UN Office for the Coordination of Humanitarian Affairs. Online available from