Natural Resources and Conservation 2(2): 25-32, 2014 http://www.hrpub.org DOI: 10.13189/nrc.2014.020202
Regionalization Approach for Modeling of Monthly
Evaporation Based on Cluster Analysis
Hossein Malekinezhad
Yazd University, Yazd, Iran
*Corresponding Author: [email protected]
Copyright © 2014 Horizon Research Publishing All rights reserved.
Abstract
Among interesting Climatic Parameters (CPs) of different climates, it may be asserted that evaporation has received a particular attention. The present study, by considering 14 stations in arid central and southern parts of Iran, has tried to determine the most important factors affecting evaporation through using Factor Analysis (FA). At first, by conducting Cluster Analysis (CA) through Minitab software, Homogeneous Regions (HRs) separated at the investigating areas. Then, the relation between climatic factors and evaporation on the basis of monthly routine was obtained in each region. Finally, by the help of accomplished regression equations, evaporation was calculated and MAE or RMSE statistics were applied to determine the precision of each relation. The results show that, firstly, factor analysis is an appropriate method for determining climatic parameters affecting evaporation in the regions. Secondly, as far as the relation between independent parameters and evaporation and priority of the main factors has been proved previously, multiple regressions may be used with great confidence to calculate evaporation and consequently evapotranspiration. The results also indicate that the difference between maximum and minimum temperatures (Tmax – Tmin), Tmax and the difference between maximum and minimum relative humidity (Hmax – Hmin) are, respectively, the main factors which influence the evaporation value at the Homogeneous Region (HR1) which is spread along Iran's water borders having a warm and humid climate. Generally, the Temperature Related Parameters (TPR) including Tmax – Tmin, Tmax, Tmin and Tmean at the HR1 are found as the main factors affecting evaporation. At the HR2 and HR3, wind speed, Tmax and Hmax – Hmin are identified as the main parameters and cloudiness as the second one. The results show that the wind speed and the cloudy times of day have a more effective role in the amount of evaporation rather than the temperature related factors.Keywords
Evaporation, Cluster Analysis, Multipleregression, Evapotranspiration, Factor Analysis
1. Introduction
Evaporation is among complicated yet effective factors in the climate of each region. It is absolutely affected by different climatic parameters. Evaporation is a key factor to calculate hydrologic balance or drought severity. It is one of the hydro-climatic phenomena that due to its dependence on many different variables, is considered as a multidimensional phenomenon. As a whole, variables affecting evaporation are as follows: precipitation, wind speed, solar radiation, humidity, amount of sunny hours, cloudiness, plant coverage, soil characteristics, available water quality, and so on. However, since all of these data may not be available for a certain region, determining relative importance of effective variables and factors on evaporation plays a prominent role with respect to crop water requirement and irrigation water need in specified regions. Moreover, it is worthy to note that the main structure of data playing an important role in the quantity of evaporation is consisted of several parts and factors. The main point is that the share and the effectiveness quantity of each of these factors is very important and also each one is in close relation with any other physical parameters controlling evaporation. Investigation of this parameter seems necessary especially for arid and semi-arid regions confronting with water deficiency.
Pan Evaporation measurements have been used worldwide as a means of estimating evapotranspiration and free water surface evaporation. The availability of Pan Evaporation measurements is critical to many applications including irrigation scheduling, hydrologic modeling, and irrigation system design. The ability to predict daily pan evaporation based on limited meteorological observations is highly desirable. In many situations it is advantageous to calculate, rather than measure, pan evaporation. This is often the case in developing countries or remote locations where costs are prohibitive. Unfortunately, it is rather difficult to directly measure evaporation (e.g. Brutsaert, 1982) and indirect approaches are used to estimate it from variables directly related to evaporation (Huntington 2006; Dewi et al., 2009).
and et al, 1991). Evaporation is an element of hydrologic cycle, which can be generally estimated by the indirect methods such as mass transfer, energy budget, and water budget methods. One of the direct methods for evaporation measurements is the pan evaporation, which is used as an indicator of evapotranspiration. Many researchers have tried to estimate the evaporation through the indirect methods using the climatic variables, but some of these methods require the data which can not be easily obtained (Kim et al. 2008), and (Rosenberry et al, 2007).
Mohan and Arumugam (1996) investigated the relative importance of different variables involved in evapotranspiration through a multivariate technique, namely factor analysis. Monthly data pertaining to eight meteorological stations located in two tropical states of India were used in the analysis. Factor analysis was applied to determine the relative effect of rainfall, temperature (maximum and minimum), wind speed, relative humidity, and sunshine duration on evapotranspiration. The principal components were obtained and a set of factors was derived using varimax factor rotation. The results of the study revealed that the variables, relative humidity, temperature, and wind speed, are those with the most influence in the evapotranspiration process.
In a wide country like Iran, with mostly arid and semi-arid weather, and existence of highly annual evapotranspiration, conducting such an investigation seems necessary and vital. Since it does not seem easy to calculate potential evaporation, this article tries to analyze evaporation and its affecting factors respectively. Hence, the introduction of factor analysis as a method used in this study is firstly attempted and then the goal and different steps of the present study are briefly covered. However, since simple statistical & univariate methods are not able to represent theses relations, taking advantages of multivariate statistical methods should be taken into consideration. Principal Component Analysis (PCA) and Factor Analysis (FA) are among the most famous and most applicable multivariate data analysis methods. These techniques are capable of describing observed relationship between several variables, in the form of some relatively simple relations, as well as presenting an idea based on the relative importance of different affecting factors on the phenomenon under study (Matalas and Reiher, 1967). In addition, this method is applied for making judgment on the basis of eigenvectors and vertical empirical functions (Rao, 1990). Some accomplished past studies showed that factor analysis statistical method might be used to investigate hydrologic phenomena. Iyengar (1991) and Gadgil and Iyengar (1980) used PCA method to determine temporal variations pattern of precipitation within an area in India. Moreover, Gadgil and Joshi (1983) used monthly precipitation, temperature, and humidity index data to classify Indian climates by the help of PCA. In addition, researchers like Bedi and Binderam (1980), and Goosen (1985) used this technique to analyze rainfall statistics. Molina et al. (2006) developed and validated a simulation model of the evaporation rate of a Class A evaporimeter pan.
Raziei and Azizi (2007) addressed this issue and classified western parts of Iran’s precipitation regime by the help of PCA and clustering methods. In the present investigation 10 parameters used to study principal component analysis were scaled down to 4 items and then Varimax Rotation was applied. Next, considering Ward’s Hierarchical Clustering method and based on the standard score amounts of acquired components; applied stations in grouping analysis and western parts of Iran were divided into 5 homogeneous sub-regions.
This investigation attempted to study the relations between evaporation and other climatic parameters within the template of different factors. Moreover, through reviewing these relations, the most important climatic parameters affecting evaporation of central and southern parts of the country were determined. Then, through cluster analysis, investigating regions were divided into smaller homogeneous parts and the most important climatic parameters affecting evaporation and the relating regression equations were determined for each month and at each homogeneous region.
2. Materials and Methods
Figure 1 shows different steps in conducting the present study. These stations have been located at main agricultural plains in central and southern Iran. It should be noted that climatic data of different synoptic weather stations like Bam, Bandar-Abass, Bushehr, Chabahar, Esfahan, Fasa, Jiroft, Kashan, Kerman, Shiraz, Tabas, Yazd, Zabol, and Zahedan were used here. Maximum statistical period for these stations was from 1953 to 2003 and minimum time period of available data was from 1966 to 2003. All of the monthly evaporation data and other climatic parameters influencing on evaporation, available at statistical period of each station, were used for the analysis processes.
As shown in Figure 1, at first the long-term statistics of selected stations were provided. These data were related to climatic parameters (CA) affecting evaporation (E) including cloudiness, max, min and mean temperature, max and min temperature difference, mean relative humidity, max and min humidity, and difference between max and min humidity and wind speed. Then, the most important factors affecting on evaporation were identified using factor analysis techniques.
Natural Resources and Conservation 2(2): 25-32, 2014 27
after defining parameters affecting evaporation phenomenon on the monthly basis, homogeneous regions, considering these parameters, were identified. This was accomplished by CA. Next, after accomplishment of CA over long-term data of investigated meteorological stations (14 stations), three homogeneous regions (HR) were defined according to climatic parameters. By sorting data on the basis of 3 HR, the most important factors affecting E were evaluated again. It was accomplished through FA. Revealing 3 superior factors in each region through multiple regressions, the existing relation between evaporation (as dependent variable) and detected factors (as independent variables) was distinguished monthly. Having realized mathematical relation between evaporation and climatic factors, calculation of evaporation based on monthly reported regression equations was carried out. Hence, the calculated monthly evaporation amounts for each investigating station were provided from Iran Weather Organization.
Figure 1. The study algorithm
3. Results
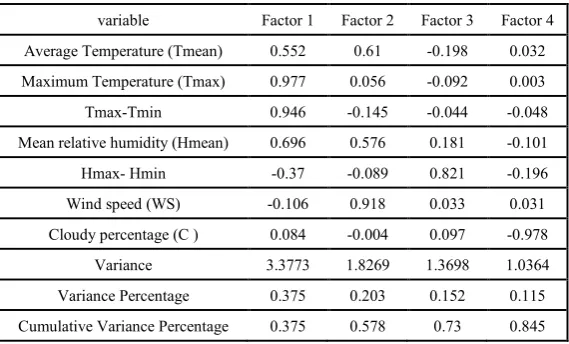
Since the nine climatic parameters had different units, all data sets were standardized. This rescaling effectively gives equal weight to each site characteristics in determining main variables and clusters. The 14×9 matrix of standardized selected variables was subjected to factor analysis. The first four factors, accounting for 85.8% of total variance, were selected and subjected to Varimax Normalized Rotation. This method of rotation is widely accepted as the most appropriate type of orthogonal rotation and for climate data. Loadings greater than 0.7 (Dinpashoh, 2004) were considered as important loadings. Factor scores for each of the 14 stations were calculated from the standardized variables and the associated factor loadings. Factor analysis technique was utilized to analyze variables in 14 stations in each month. It was identified that the variables are summarized to 4 factors. For instance, the result of FA in April was shown in Table 1. In this table, the variable which has biggest value (weight) is the main variable affecting evaporation in each factor. The first four more effective variables on E contain 84.8 percent of the variations. The method of principal components and Varimax Rotation was used to extract the factors loading matrix.
Where the Tmax, Tmin and Tmean are maximum, minimum and mean monthly temperature, Hmax and Hmin are maximum and minimum of monthly relative humidity, respectively. C represents the cloudiness and WS is the mean monthly wind speed.
As it is shown in the Table 1, temperature plays a prominent role in evaporation of all months of a year and it is determined as the most important parameter in the first factor. Temperature parameter also plays a role in the form of temperature min and max variation (Tmax - Tmin) and in some months maximum temperature (Tmax) imposes the highest effect. Then, considering climatic factors affecting evaporation, homogeneous regions were categorized and results were achieved in the form of a dendrogram. Figure 2 shows this dendrogram.
[image:3.595.57.294.299.508.2] [image:3.595.163.448.565.737.2]Figure 2. Dendrogram related to categorization of investigating stations to homogeneous regions, considering climatic parameters affecting
evaporation
The number of station grouping to homogeneous groups depends on the similarity value in ward cluster approach. Therefore, three homogeneous regions can be defined with the similarity value of about 25. Obviously, considering the larger value of similarity causes less number of stations to be located at a homogeneous area.
Next, through factor analysis the most important
parameters affecting evaporation in every month were determined and finally regression equations of evaporation calculation are set based on determinant climatic factors (tables 2 to 4). On the basis of these equations monthly evapotranspiration of total stations were calculated. The results showed that not only the three main factors affecting E but also the priority of them are not the same at different months of a year at each homogeneous region.
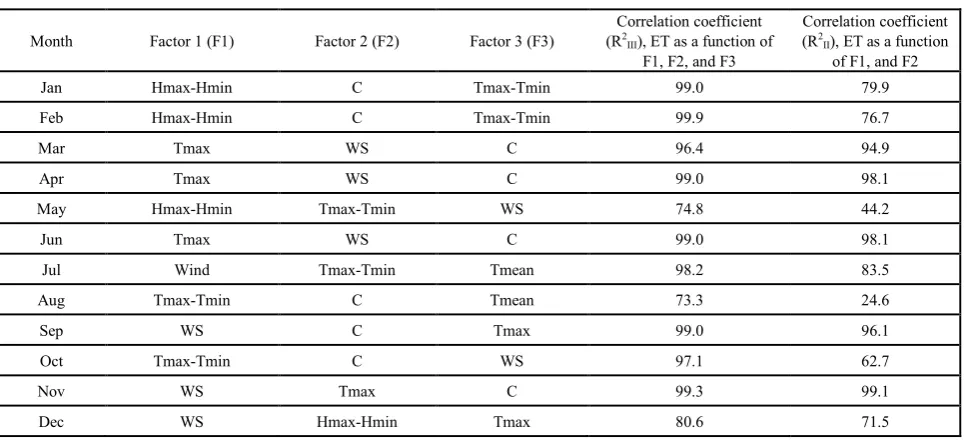
Tables 5 to 7 show the factor analysis results for determining the three main climatic parameters affecting evaporation at the 3 HRs. Thus, the correlation between evaporation as a dependent variable and first (F1) and second (F2), and also, first, second and third (F3) more effective independent variables, R2
II and R2III, respectively, were
calculated at each HR (tables 5 to 7). The high correlation between E and the first three more effective variables indicates that the derived equations can be applied for sites with low or no recorded evaporation data located at three identified HRs.
Table 2. Correlation between evaporation and affecting climatic factors at the homogeneous region no 1.
Month Regression equations
Jan. Log (E)= 6.1 - 0.18 Log (Tmax-Tmin) - 3.47 Log (Hmax-Hmin) + 1.13 Log (C) Feb. Log (E)= 2.3 + 1.10 Log (Tmax-Tmin) + 0.3 Log (Hmax-Hmin) - 2.04 log (C) Mar. Log (E)= 1.86 + 0.291 Log (Tmax)+ 0.0675 Log (WS) - 0.128 Log (C) Apr. Log (E)= 2.28 + 0.00388 Log (Tmax)+ 0.0222 Log (WS) + 0.0298 Log (C) May Log (E)= 2.51 + 0.0584 Log (Tmax-Tmin)- 0.148 Log (Hmax-Hmin)- 0.0108 Log (WS) Jun. Log (E)= 2.28 + 0.00388 Log (Tmax) + 0.0222 Log (WS) + 0.0298 Log (C) Jul. Log (E)= 6.78 - 2.52 Log (Tmean)- 0.312 Log (Tmax-Tmin) - 0.085 Log (WS) Aug. Log (E)= 0.476 + 1.31 Log (Tmean)- 0.00470 Log (Tmax-Tmin)+ 0.0132 Log(C) Sep. Log (E)= 5.54 - 2.01 Log (Tmax)+ 0.91 Log (WS)- 0.19 Log (C) Oct. Log (E)= 0.21 + 0.761 Log (Tmax-Tmin)- 0.171 Log (WS)+ 0.264 Log (C) Nov. Log (E)= 1.62 + 0.247 Log (Tmax) + 0.0850 Log (WS)+ 0.0811 Log (C) Dec. Log (E)= 0.956 + 0.178 Log (Hmax-Hmin) + 0.497 Log (Tmax) + 0.0784 Log (WS)
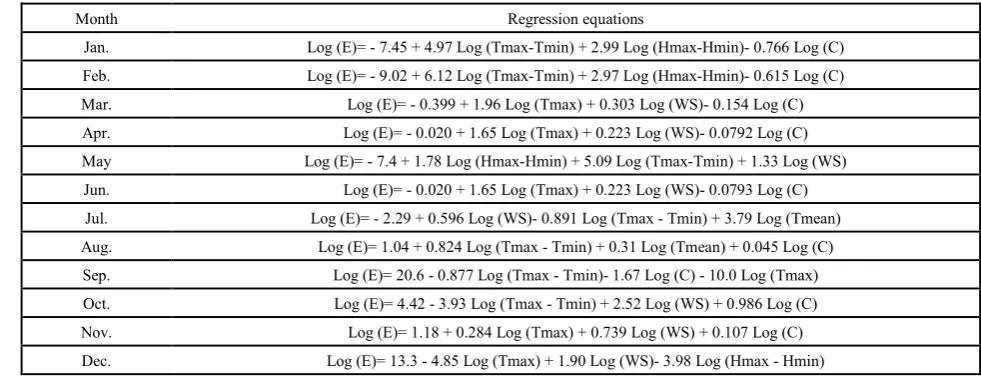
Table 3. Correlation between evaporation and affecting climatic factors at the homogeneous region no 2.
Month Regression equations
Jan. Log (E)= - 7.45 + 4.97 Log (Tmax-Tmin) + 2.99 Log (Hmax-Hmin)- 0.766 Log (C) Feb. Log (E)= - 9.02 + 6.12 Log (Tmax-Tmin) + 2.97 Log (Hmax-Hmin)- 0.615 Log (C) Mar. Log (E)= - 0.399 + 1.96 Log (Tmax) + 0.303 Log (WS)- 0.154 Log (C) Apr. Log (E)= - 0.020 + 1.65 Log (Tmax) + 0.223 Log (WS)- 0.0792 Log (C) May Log (E)= - 7.4 + 1.78 Log (Hmax-Hmin) + 5.09 Log (Tmax-Tmin) + 1.33 Log (WS)
[image:4.595.62.298.76.200.2] [image:4.595.61.546.352.540.2] [image:4.595.54.545.558.746.2]Natural Resources and Conservation 2(2): 25-32, 2014 29
Table 4. Correlation between evaporation and affecting climatic factors at the homogeneous region no 3.
Month Regression equations
Jan. Log (E)= 1.65 - 0.76 Log (C) - 4.92 Log (Hmax - Hmin) + 8.14 Log (Tmax - Tmin) Feb. Log (E)= - 5.28 + 7.35 Log (Tmax-Tmin) + 2.58 Log (C) - 2.48 Log (Hmax - Hmin) Mar. Log (E)= - 0.166 + 2.56 Log (C) + 0.705 Log (WS) - 0.750 Log (Tmax) Apr. Log (E)= - 4.66 - 0.657 Log (C) + 0.643 Log (WS) + 5.05 Log (Tmax) May Log (E)= 0.668 - 0.415 Log (WS) - 4.33 Log (Hmax - Hmin) + 6.91 Log (Tmax-Tmin) Jun. Log (E)= 0.097 + 1.60 Log (C) + 0.396 Log (Tmax) + 0.211 Log (WS) Jul. Log (E)= 5.26 + 0.067 Log (WS) -1.07 Log (Tmax - Tmin)-0.94 Log (Tmean) Aug. Log (E)= - 2.4 + 0.117 Log (WS) + 5.0 Log (C) - 1.5 Log (Tmax) Sep. Log (E)= 15.4 + 5.64 Log (Tmax) - 14.8 Log (C) + 0.061 Log (WS) Oct. Log (E)= - 3.20 - 0.279 Log (WS) - 0.187 Log (Tmax - Tmin) + 4.21 Log (C) Nov. Log (E)= - 0.348 + 2.63 Log (Tmax) - 0.110 Log (WS)- 0.670 Log (C) Dec. Log (E)= 3.25 - 0.875 Log (Hmax - Hmin) + 0.106 Log (WS) + 0.071 Log (Tmax)
Table 5. Factor analysis results for the homogeneous region 1
Month Factor 1 (F1) Factor 2 (F2) Factor (F3) Correlation coefficient (R2III), ET as a
function of F1, F2, and F3 Correlation coefficient (R
2
II), ET as a
function of F1, and F2
Jan Tmax-Tmin C Hmax-Hmin 98.8 97.7
Feb Tmax-Tmin Hmax-Hmin C 98.7 79.3
Mar Tmax C WS 99.7 96.3
Apr WS C Tmax 99.7 89.3
May Tmax-Tmin Hmax-Hmin WS 99.5 56.8
Jun WS C Tmax 99.7 79.4
Jul Tmean Tmax-Tmin WS 97.9 97.5
Aug Tmean Tmax-Tmin C 98.8 41.5
Sep Tmax WS WS 96.7 52.1
Oct Tmax-Tmin WS Tmax-Tmin 99.0 45.0
Nov Tmax WS C 96.3 93.7
Dec Tmax Hmax-Hmin WS 99.7 86.4
Table 6. Factor analysis results for the homogeneous region 2
Month Factor 1 (F1) Factor 2 (F2) Factor 3 (F3) (RCorrelation coefficient 2 III), ET as a function of
F1, F2, and F3
Correlation coefficient (R2
II), ET as a function
of F1, and F2
Jan Hmax-Hmin C Tmax-Tmin 99.0 79.9
Feb Hmax-Hmin C Tmax-Tmin 99.9 76.7
Mar Tmax WS C 96.4 94.9
Apr Tmax WS C 99.0 98.1
May Hmax-Hmin Tmax-Tmin WS 74.8 44.2
Jun Tmax WS C 99.0 98.1
Jul Wind Tmax-Tmin Tmean 98.2 83.5
Aug Tmax-Tmin C Tmean 73.3 24.6
Sep WS C Tmax 99.0 96.1
Oct Tmax-Tmin C WS 97.1 62.7
Nov WS Tmax C 99.3 99.1
[image:5.595.62.547.87.289.2] [image:5.595.72.545.310.517.2] [image:5.595.65.549.534.755.2]Table 7. Factor analysis results for the homogeneous region 3
Month Factor 1 (F1) Factor 2 (F2) Factor 3 (F3) Correlation coefficient (R2III), ET
as a function of F1, F2, and F3 Correlation coefficient (R
2 II),
ET as a function of F1, and F2
Jan C Hmax-Hmin Tmax-Tmin 99.5 98.4
Feb Tmax-Tmin C Hmax-Hmin 97.7 85.3
Mar C WS Tmax 69.9 25.7
Apr WS C Tmax 68 67.3
May WS C Tmax-Tmin 96.5 80.1
Jun Tmax C WS 30.8 81
Jul WS Tmax-Tmin Tmean 94.8 31
Aug WS C Tmax 81.5 81
Sep WS Tmax C 83.1 30.8
Oct WS Tmax C 99.3 27.1
Nov Tmax WS C 83.1 73.6
[image:6.595.64.546.87.484.2]Dec WS Hmax-Hmin Tmax 96.9 37.4
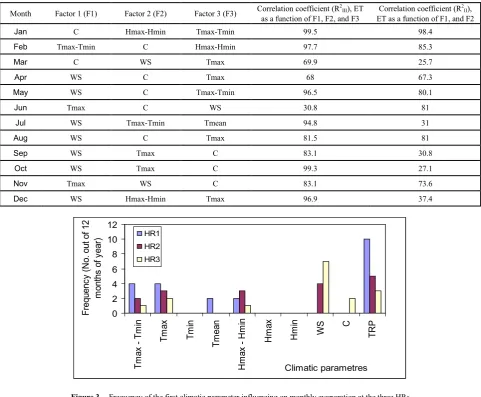
Figure 3. Frequency of the first climatic parameter influencing on monthly evaporation at the three HRs
Figure 4. Frequency of the second climatic parameter influencing on monthly evaporation at the three HRs 0
2 4 6 8 10 12
Tm
ax
- Tm
in
Tm
ax
Tm
in
Tm
ean
Hm
ax
- Hm
in
H
m
ax
H
m
in
W
S C
TR
P
Climatic parametres
Fr
equenc
y (
N
o.
out
of
12
m
ont
hs
of
y
ear
) HR1
HR2 HR3
0 2 4 6 8 10 12
Tm
ax
- T
m
in
Tm
ax
Tm
in
Tm
ean
Hm
ax
- Hm
in
Hm
ax
Hm
in
WS C TRP
Climatic parameter
Fr
equenc
y (
N
o.
out
of
12 m
ont
hs
of
year
)
[image:6.595.62.551.89.509.2] [image:6.595.137.473.496.692.2]Natural Resources and Conservation 2(2): 25-32, 2014 31
Figure 5. Frequency of the third climatic parameter influencing on monthly evaporation at the three HRs Fig. 3 shows that the difference between maximum and
minimum temperatures (Tmax – Tmin), Tmax and the difference between maximum and minimum relative humidity (Hmax – Hmin) are the main factors which influence the evaporation value, respectively. This homogeneous region (HR1) is spread along Iran's water borders having a warm and humid climate. Generally, the temperature related parameters (TPR) including Tmax – Tmin, Tmax, Tmin and Tmean at the HR1 are found as the main factors affecting evaporation. At the HR2 and HR3, wind speed, Tmax and Hmax – Hmin are identified as the main parameters and cloudiness as the second one (Fig. 4 and 5). These two regions are spread at the central and southeastern Iran, the most portions of which are located at desert and arid climate. The results showed that the wind speed and cloudy times of day have a more effective role on the amount of evaporation rather than the temperature related factors.
It was shown that the most evaporation occurred at homogeneous regions 3, 2, and 1 respectively. This is not only related to the above mentioned parameters affecting evaporation but also may be related to topographical conditions and the altitude of region.
Being situated near the sea is the main reason of homogeneous region 1 for having lower potential evaporation than others. Higher relative humidity, among affecting factors, is an important reason for lowering evaporation of this region. As it is shown in figure 3 wind speed in region 1 can not increase the evaporation as well as the other two dry regions. Results of factor analysis have also pointed out this issue. However, in the homogeneous region 3, in addition to the positive and prominent role of climatic parameters in evaporation, topographical shape of the region and the low lying feature with no high lands may be considered as other affecting factors in high evaporation of these regions.
4. Statistical Analyses
Table 8 shows the amount of RMSE and MAE statistics related to the comparison of observed and predicted evaporation by regression equation for each month at any homogeneous region. As it is shown by this table, the amount of error statistics is a bit more in some months than others. This is derived from climatic parameters affecting prediction of the evaporation amount. In these months, it seems that selected parameters in regression model are not able alone to predict the real amount of evaporation and therefore more important parameters should be sought.
Table 8. Diversified monthly RMSE and MAE amounts at each of the homogeneous regions
Month
HR1 HR2 HR3
RMSE MAE RMSE MAE RMSE MAE
Jan. 0.23 15.95 0.12 12.79 0.13 8.72
Feb. 0.52 47.74 0.09 9.42 0.05 3.69
Mar. 0.11 1.67 0.05 6.60 0.21 1.82
Apr. 0.21 1.44 0.02 3.95 0.11 3.06
May 0.24 3.48 0.26 62.21 0.04 11.41
Jun. 0.14 1.44 0.02 3.97 0.23 5.44
Jul. 0.17 46.57 0.21 2.27 0.15 47.84
Aug. 0.21 3.09 0.04 11.54 0.18 66.77
Sep. 0.41 77.87 0.16 24.86 0.11 27.49
Oct. 0.35 79.99 0.22 4.11 0.06 14.08
Nov. 0.13 0.34 0.12 2.14 0.13 4.97
Dec. 0.1 0.03 0.48 57.18 0.15 4.62
5. Conclusions
Statistical analysis results achieved from present investigation show that, firstly, the load of climatic
0 2 4 6 8 10 12
Tm
ax
- T
m
in
Tm
ax
Tm
in
Tm
ean
Hm
ax
- Hm
in
Hm
ax
Hm
in
WS C TRP
Climatic parameter
Fr
equenc
y (
N
o.
out
of
12 m
ont
hs
of
year
)
[image:7.595.140.471.77.253.2] [image:7.595.311.552.432.687.2]parameters at all factors is extremely high and appropriate, and secondly, a set of determined items through factor analysis may have the ability to express the high percentage of variance that existed between data. In addition, regression correlation coefficient between the selected factors and evaporation amount in each month is very high. All these evidences indicate the prominent role of factor analysis method in investigating the relations between evaporation and climatic parameters. The study area at central and southern Iran involves the main agricultural plains and the selected weather stations are located at these plains. The results of this research are suitable for water resources and agricultural management at the plains located at the study area. There are some single mountainous regions at this area and it is obvious these areas don't belong with these three humongous regions.
Due to the results of the present investigation it was found that, in each month, one of the climatic parameters has a more prominent role on the amount of evaporation and among them the temperature related parameters (Tmax – Tmin, Tmax, and Tmean), wind speed and cloudiness’ role are more distinguished than the others. The knowledge of the most important factors affecting monthly evaporation in each region, especially, in arid and semi-arid regions can be used for a better management of water resources and agriculture.
REFERENCES
[1] Anaydike R.N.C, .1987. Multivariate classification and regionalization of West African climate. Journal of Climatology 7:157-164.
[2] Brutsaert W. 1982. Evaporation into the Atmosphere. Reidel: Dordrecht.
[3] Bedi H.S, Binderam MS.1980. Principle components of monsoon rain fall. Tellus 32: 296-298.
[4] Cahoon JE, Costello TA, Ferguson JA. (1991). Estimating pan evaporation using limited meteorological observations. Agricultural and Forest Meteorology 55(3-4):181-190. [5] Dewi GC, Kirono Roger N. Jones, Helen A. Cleugh. (2009).
Pan-evaporation measurements and Morton-point potential evaporation estimates in Australia: are their trends the same? International Journal of Climatology 29: 711–718.
[6] Dinpashoh YA, Fakheri-Fard M, Moghaddam S,
Jahanbakhsh and Mirnia M. (2004). Selection of variables for the purpose of regionalization of Iran's precipitation climate using multivariate methods. Journal of hydrology 297(1-4):109 - 123.
[7] Gadgil S, Iyengar RN. 1980. Cluster analysis of rainfall stations of India peninsula. Quarterly Journal of the Royal Meteorological Society. 106(450): 873-896.
[8] Gadgil S, Joshi NV. 1983. Climate Cluster of the India origin. Journal of Climatology 3:47-63.
[9] Goossen C. 1985. Principal component analysis of Mediterranean rainfall. Journal of Climatology 5:379-388. [10] Gray BM. 1981. On the stability of temperature eigenvectors.
Journal of Climatology: 273-281.
[11] Huntington TG. 2006. Evidence for intensification of the global water cycle: review and synthesis. Journal of Hydrology 319: 83–95.
[12] Kidson JW. 1975. Eigen Vector analysis of monthly mean surface data. Monthly Weather Rev 103:639-649.
[13] Kim S, Kim SH. 2008. Neural networks and genetic algorithm approach for nonlinear evaporation and evapotranspiration modeling. Journal of hydrology 35(3 -4): 299-317.
[14] Iyengar RN. 1991. Application of principal component and factor analysis variability of rain fall .proc. Indian Acad. Sc. 100(2): 105-126.
[15] Masoudian SA. 2004. Geographical distribution of precipitation in Iran using factor analysis. Journal of Geography and Development. Fall-Winter issue. 184-171, (in Persian).
[16] Matalas D, Feyen J, 1990. Defining homogenous precipitation regions means of principal component analysis. Journal of Applied Meteorology 29: 892-910.
[17] Matalas NC, Reiher BG. 1967. Some comments analysis. Water resources research 13(1): 213-223.
[18] Mohan S. and Arumugam N. 1996. Relative Importance of Meteorological Variables in Evapotranspiration: Factor Analysis Approach. Water Resources Management 10: l-20.
[19] Molina Martı´nez J.M, Martı´nez Alvarez V,
Gonza´lez-Real, M.M, Baille, A. 2006. A simulation model
for predicting hourly pan evaporation from meteorological data. Journal of Hydrology 318 (2006) 250–261
[20] Rao AR. 1990. Empirical orthogonal function analysis of rainfall and run off series. Water Resources Management 4: 235-250.
[21] Raziei T. Saghafian B, Paulo AA, Pereira LS, Bordi I. 2009. Spatial Patterns and Temporal Variability of Drought in Western Iran. Water Resources Management 23: 439 – 455. [22] Rosenberry DO, Winter TC, Buso DC, Likens G.E. 2007.
Comparison of 15 evaporation methods applied to a small mountain lake in the northeastern USA, Journal of hydrology 340: 149–166.