Journal of Chemical and Pharmaceutical Research, 2015, 7(1):56-61
Research Article
ISSN : 0975-7384
CODEN(USA) : JCPRC5
Detection and segmentation of oil slick environment hazards in ocean using
modified K-means clustering
Ganesan P.
Dept. of Electronics and Control Engg., Sathyabama University, Sozhinganallur, Chennai, Tamilnadu, India
_____________________________________________________________________________________________
ABSTRACT
In this work, a comprehensive review of the use of the satellite images for the detection of oil spill is provided. Oil spills are not only affect the marine system but also cause social, economical, political and scientific concern since they seriously affect the coastal ecosystem. It is very difficult to continuous monitoring and inspecting the entire ocean for oil spill detection. The images gathered from satellites provide solution to this hectic problem. A satellite image covers large areas and offers an easier way of monitoring the marine areas. This paper presents automatic detection of oil spills in a satellite image using clustering. Our approach for the detection and extraction of oil spill is based on modified k-means clustering. Finally we conclude with discussion of suggestions for further research.
Keywords: Oil slick, Oil Spill, Segmentation, satellite image, Environment, K-Means clustering
_____________________________________________________________________________________________
INTRODUCTION
According to the American Heritage dictionary of the English language, oil slick is a layer of oil floating on the surface of water. Collins English Dictionary defines oil slick as a thin film of floating oil covering an area of water, especially oil that has spilled or leaked from a ship. The requirement of oil is gradually increasing. It is very difficult to imagine the world without oil products. After exploration, oil has to be transported in water sources (ocean or sea).
The oil spill is a form of pollution due to human activity in which huge amount of crude oil is leakaged or released into the ocean. The recovery and cleaning process is very difficult and take more times. Some oil spills may take even years to clean up. This process depends upon various factors such as the type of oil spilled and the temperature of the water.
This oil spill is mainly due to illegal discharges hydrocarbons released by ships and rarely by collision of ships, damage in pipelines. When oil is spilled in the ocean, it rapidly stretch to form a thin layer on the ocean water surface, known as an oil slick. According to surveys and reports, nearly 45 % of the marine oil pollution is due to the operative discharges from ships. The accident or collision contributes only less than 5% for oil pollution. It is very difficult to differentiate oil slicks from the short waves and dark patches on the surface.
Ecuador. These environmental hazards also have an economic impact on fishing, marine resource extraction industries and tourism.
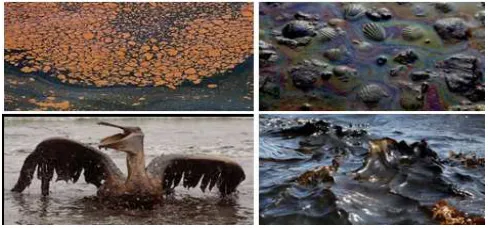
The effects of oil slick are listed as follows:
1. The immediate effect is fire hazard- deepwater horizon killed eleven workers. 2. Air pollution that caused respiratory problems
3. Contaminate drinking water supply.
4. Severely affect tourism and marine resource extraction (fishing) resources. 5. Severely affects marine environment – birds and animals.
The Deepwater Horizon oil spill in the Gulf of Mexico is considered as the one of the worst in world history and the biggest in U.S. history for the following reasons:
1. 25,750 kilometers of coastline affected. 2. 757 million liters of oil drained into the ocean.
3. 11 workers were killed and 17 other people were injured. 4. Long term damage to inhabitants and environment.
Aerial surveillance is used for monitoring ocean pollution. But it can’t provide a regular, continuous monitoring and early detection of oil spill at ocean. The segmentation is the process of partitioning or dividing data (image) into number of meaningful classes or clusters [12-14]. Satellite image processing can play vital role for continuous monitoring and early detection of oil spill discharges at sea. In our work, the use of the satellite images for the detection of oil spill is presented. This paper present automatic detection of oil spills in a satellite image using clustering. Our approach for the detection and extraction of oil spill is based on modified k-means clustering. It is very difficult to continuous monitoring and inspecting the entire ocean for oil spill detection. The images gathered from satellites provide solution to this hectic problem. A satellite image covers large areas and offers an easier way of monitoring the marine areas.
The advantages of satellite image based detection and segmentation of oil slick is listed as follows. 1. Economical
2. Easy way of continuous coastal patrolling
3. Satellite remote sensing gives early warning of oil spills
4. More coverage area. For example a single Landsat satellite image can cover 185 X 185 km2. 5. In most cases, continuous communication irrespective of weather conditions
[image:2.595.177.421.531.645.2]6. Greater range and resolution
Fig 1. shows the hazardous environmental effect of oil slick in ocean.
Fig 1. Effects of Oil Slick in Ocean
2. Literature Survey
Satellite-based oil slick monitoring by using images received from the ERS-1 satellite is presented in [1][2][3][4].Nowadays, Landsat, RADARSAT-1 and ENVISAT are the providers of satellite SAR images for oil spill monitoring. Landsat-5 and RADARSAT-1 were used to collect imagery of the Guanabara Bay, Brazil, after an oil spill emergency where a pipeline damaged [5]. Emanuele Angiuli et al. explained a method based on artificial neural networks for the discrimination, starting from SAR imagery, between oil spills and objects which look-alikes on SAR satellite imagery. This method consists of three basic steps: (i) detection of dark spots over the ocean, (ii) computing features or parameters for each dark spot (oil slick) and (iii) using neural network, classification of the oil spill [6].
Kolokoussis Polychronis et al. demonstrated the detection of oil spills and underwater natural oil outflows using very high resolution multispectral remote sensing images such as Quick Bird, Rapid Eye, WorldView2 and IKONOS, as well as Landsat TM (high resolution satellite images [7]. Alaa Sheta et al., proposed the oil spill detection in SAR satellite imagery based on threshold segmentation algorithm. In this work, the task of oil spill detection consists of four processes as (i) image enhancement (ii) image segmentation (iii) feature extraction and (iv) identification of the segmented objects as oil spills or look-likes [8].
Alli et al., illustrated a system for the detection of oil spill in ocean based on based on a fuzzy control filtering approach. In this approach, membership functions and fuzzy associative memory (FAM) with conventional multilevel median filter (MLMF) is applied to detect the oil spills in Synthetic Aperture Radar (SAR) images [9]. Guo Yue and Wang Xiao Feng presented a oil spill detection method based on feature space shape Recognition. The image is initially segmented to extract two type regions of oil spill and looks-like. Then these two regions were analyzed by using different shape characters and grouping the characters into a new feature space. As a final point, the oil spill area is recognized by Artificial Neural Networks [10]. Olga Nickolaevna Gershenzon et al., explained a method to improve the existing oil spill monitoring and surveillance, to make certain SAR data acquisition and processing and to build up geographic information systems in support of spill response decision making [11].
3. Modified K-means clustering for Oil Slick
Unsupervised K-means clustering is an iterative algorithm used for the clustering of data into number (K) of cluster based on some characteristics such as color or texture. In this simple approach, the clustering is carried out by decreasing the distance between the data and its corresponding centroid (cluster center). This clustering algorithm works at minimizing an objective function which is shown in (1)
= ∑ ∑ ( )− (1)
The distance calculated between a data point ( )and the cluster centre is ( )− and is the indicator of the distance of the n data points from their respective cluster centers.
Step 1: Determine the number of clusters and assume the center of these clusters. Step 2: choose any random data or the first K object as the initial centroid.
Step 3: Estimate the distance of each object to the centroid by using Euclidean squared distance measure. Step 4: Allocate every object to the cluster group that has the least distance i.e., closest centroid
Step 5: Again compute the locations of the K centroids after all objects were assigned. Step 6: Repeat the steps 2-4 till centroids no longer move i.e., convergence.
It is essential to bring in a number of changes in the classical k-means clustering algorithm to prevail over the weaknesses i.e., sensitive to the initial randomly selected cluster centers and improve the segmentation performance. Now consider an image which has N data that have to be clustered into n centers. Let be the ith data and be the jth center with predetermined initial value where i = 1,2,...,N and j = 1,2,..., n . In the modified clustering, the basic idea of fuzzy logic is incorporated. This modification can be accomplished using the membership function as given in (2)
M = ∑
(2)
where d distance from point k to current cluster is center i, d# is distance from point k to other cluster centers j and
q is the fuzziness exponent where the typical value is 1. After specifying the membership for each data, the fitness
calculation process is performed using (3)
F%c#' = ∑ %x − cℇ* #' (3)
The new location for every center is computed using (4)
c#= 1 n- ∑ x# ℇ* (4)
RESULTS AND DISCUSSION
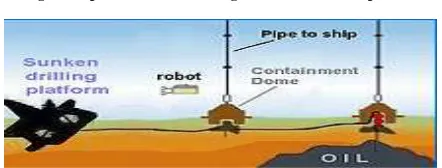
[image:4.595.181.418.321.389.2]The Deepwater Horizon oil spill or the Gulf of Mexico oil spill (explosion and sinking of the Deepwater Horizon oil rig), began on 20 April 2010 in the Gulf of Mexico, which claimed eleven lives is considered as the largest accidental marine oil spill in the history of the petroleum industry. The Deepwater Horizon oil rigs before and after explosion is illustrated in fig 2. Underwater oil containment domes originally planned for the Deepwater Horizon oil spill is depicted in fig 3.
[image:4.595.181.415.322.488.2]Fig 2. Deepwater Horizon oil rig before and after explosion
Fig 3. Underwater oil containment domes originally planned for the Deepwater Horizon oil spill
In our approach, the detection and extraction of oil spill is based on modified k-means clustering. Some preprocessing operations i.e., image enhancement processes are performed on the original satellite oil spill image prior to segmentation. These operations include sharpening and smoothening of image details and the removal or filtering of noise information. Then, the modified k-means clustering is performed on the preprocessed image to identify the segmented objects as oil spills or look-likes. So, in our work, the task of oil spill detection consists of four processes as (i) image enhancement such as sharpening, smoothening and filtering (ii) image segmentation using modified K-Means clustering algorithm (iii) feature or region of interest extraction and (iv) the classification of the segmented objects as oil spills or look-likes.
[image:4.595.188.409.404.488.2][image:5.595.165.410.335.572.2]
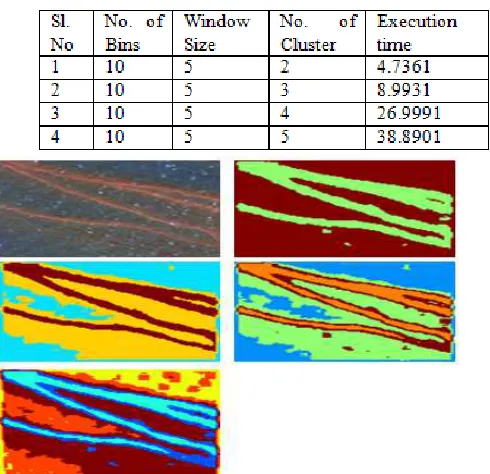
Fig 4. The original satellite image of deepwater horizon oil spill and the segmentation result for various numbers of clusters. Number of bins are 10
Table 1.The simulation result of figure 4
[image:5.595.184.413.629.700.2]
Fig 5. The original satellite image of deepwater horizon oil spill and the segmentation result for various numbers of clusters. Number of bins are 5
CONCLUSION
The automatic detection of oil spills in a satellite image using clustering is proposed. This new approach for the detection and extraction of oil spill is based on the modified k-means clustering algorithm. This color based algorithm produced very good results for classification of the segmented objects as oil spills or look-likes. The computational cost (execution time) also very less as compared to other methods. The result of the proposed work can be improved by the combination of hill climbing algorithm and modified k-means clustering algorithm. In this combined approach, the hill climbing algorithm identifies the initial number of clusters or seeds. These seeds are given to the modified K-Means clustering algorithm for the segmentation.
REFERENCES
[1] Bern, T. I., Wahl, T., Anderssen, T., and Olsen, R. Oil spill detection using satellite based SAR: Experience from a field experiment. Proc. 1st ERS-1 Symposium, Cannes, France. 1992, 829– 834.
[2] Skbelv, A., Wahl, T. Oil spill detection using satellite based SAR,Phase 1B competition report. Tech. rep., Norwegian Defence Research Establishment. 1993.
[3] Wahl, T., Anderssen, T., Skbelv, A. Oil spill detection using satellite based SAR, Pilot Operation Phase, final report. Tech. rep. Norwegian Defence Research Establishment. 1994
[4] Martinez, A., & Moreno, V. Spill Science and Technology Bulletin, 3(1/2), 1996. 65–71.
[5] Bentz, C., & de Miranda, F. P. Application of remote sensing data for oil spill monitoring in the Guanabara Bay, Rio de Janeiro, Brazil.Proc. IGARSS’01, vol. 1.2001, 333– 335.
[6] Emanuele Angiuli, Fabio Del Frate, Luca Salvatori. Neural Networks For Oil Spill Detection Using ERS And Envisat Imagery Proceedings of SEASAR 2006, 23-26 January 2006, Frascati, Italy, (ESA SP-613).
[7] Kolokoussis Polychronis, Karathanassi Vassilia. International Journal of Remote Sensing Applications, 3-3,
2013,145.
[8] Alaa Sheta,Mouhammd Alkasassbeh,Malik Braik and Hafsa Abu Ayyash. International Journal of Computer
Applications,57-7, 2012.
[9] P.Alli, P.Ramasubramanian and V. Sureshkumar. International Journal of Advanced Science and Technology. Vol. 25, December, 2010
[10] Guo Yue and Wang XiaoFeng. Oil Spill Detection by SAR Images Based on Shape Feature Space. 2011 2nd International Conference on Networking and Information Technology. IPCSIT vol.17. 2011
[11] Olga Nickolaevna Gershenzon, Vladimir Eugenyevich Gershenzon and Sergey Vladimirovich Osheyko. Integral solution for oil spill detection using SAR data. Anais XIII Simpósio Brasileiro de Sensoriamento Remoto, Florianópolis, Brasil, , INPE, 21-26 abril 2007,. 4873-4878.
[12] Ganesan, P.; Rajini, V., "YIQ color space based satellite image segmentation using modified FCM clustering and histogramequalization," Advances in Electrical Engineering (ICAEE), 2014 International Conference on , pp.1,5, 9-11 Jan. 2014. doi: 10.1109/ICAEE.2014.6838440
[13] Ganesan, P.; Rajini, V., "Assessment of satellite image segmentation in RGB and HSV color space using image quality measures," Advances in Electrical Engineering (ICAEE), 2014 International Conference on , pp.1,5, 9-11 Jan. 2014 doi: 10.1109/ICAEE.2014.6838441.
[14] Ganesan, P.; Rajini, V., "Value based semi automatic segmentation of satellite images using HSV color space, histogram equalization and modified FCM clustering algorithm," Green Computing, Communication and Conservation of Energy (ICGCE), 2013International Conference on , pp.77,82, 12-14 Dec. 2013. doi: 10.1109/ICGCE.2013.6823403
[15] Simecek-Beatty, D., & Clemente-Colo´n, P. (2004). International Journal of Remote Sensing, 25(11), 2004, 2233– 2241.
[16] Solberg, T. Dokken, and R. Solberg. IEEE Geoscience and Remote Sensing Symposium,4(3),2003,2747–2749. [17] A. H. Solberg, G. Storvik, R. Solberg, and E. Volden. IEEE Transactions on Geoscience and Remote Sensing, volume 37, 1999, 1916 – 1924.