Journal of Chemical and Pharmaceutical Research, 2017, 9(7):105-110
Research Article
CODEN(USA) : JCPRC5
ISSN : 0975-7384
105
Development and Validation of RP-HPLC Method for the Estimation of
Duloxetine Hydrochloride in Bulk and Pharmaceutical Dosage Forms
Sowjanya P, Vijaya Lakshmi M
*, Lakshmi Prasanna M and Buchi N Nalluri
Department of Pharmaceutical Analysis, KVSR Siddhartha College of Pharmaceutical Sciences, Vijayawada, Andhra Pradesh, India
_____________________________________________________________________________
ABSTRACT
A Simple and precise RP-HPLC method has been developed and validated for the estimation of Duloxetine hydrochloride (DLX) in bulk and pharmaceutical dosage forms. Chromatography is carried out on an inertsil column (250×4.6, 5 µm) using a mobile phase containing 0.02% formic acid: acetonitrile (72:28% v/v) at a flow rate of 1 ml/min. The analyte was monitored using UV detector at 230 nm. The retention time is found to be 5.243 min for Duloxetine hydrochloride. The proposed method was found to be linear in the concentration range of 2-10 µg/ml with a correlation coefficient of 0.999. The mean recoveries obtained for Duloxetine hydrochloride were in the range of 98.77-102.05%. The limit of detection (LOD) and limit of quantification (LOQ) were found to be 0.0206 and 0.062 µg/ml respectively. The developed method has been statistically validated according to ICH guidelines and found to be LC-MS compatible, simple, precise, and accurate with the prescribed values. Thus the proposed method was successfully applied for the estimation of Duloxetine hydrochloride in routine quality control analysis in bulk and formulations.
Keywords: RP-HPLC; Duloxetine hydrochloride; Method validation
_____________________________________________________________________________
INTRODUCTION
[image:1.612.249.362.618.703.2]Duloxetine hydrochloride, a selective serotonin and nor epinephrine reuptake inhibitor [SSNRI] is used for the treatment of major depressive disorder and anxiety and stress urinary incontinence. Its chemical designation is [+]-[S]-N-methyl-y-[1-naphthyloxy]-2-thiophenepropylamine hydrochloride [1,2]. The empirical formula is C18H19NOS.HCL and having a molecular weight of 333.88. The structure is shown in the Figure 1. Duloxetine is also used to treat pain and tingling in diabetic neuropathy. Various analytical methods have been reported namely, HPLC [3-9], high-performance thin-layered chromatography [10,11], ultra-performance liquid chromatography [12] and liquid chromatography-tandem mass spectrometry [13-15], and in these methods phosphate buffer is used as mobile phase which reduces the column efficiency. Hence the present work is aimed to develop a LC- MS compatible sensitive, novel, rapid, accurate and precise RP-HPLC method for the estimation of DLX in bulk and tablet dosage form and the method were validated as per ICH guidelines [16,17].
106
MATERIALS AND METHODS
Chemicals and Reagents
Duloxetine hydrochloride and its marketed tablets with a labeled amount of 30 mg, DULYN-30(B-No: DU30T5), were procured from lifeline formulations Pvt Ltd., Vijayawada, Andhra Pradesh. Methanol, water, formic acid, other chemicals and reagents used were of HPLC grade.
Equipment
The HPLC used is a shimadzu’s prominence HPLC with LC-10AT VP series binary pump, SIL-20AHT Auto sampler, and SPD-10A VP UV detector was used. Data acquisition was carried out using LC solutions software.
Chromatographic Conditions
Chromatographic separation is achieved at an ambient temperature on a reversed phase column using a mobile phase consisting of a mixture of 0.02% Formic acid: acetonitrile in the ratio of (72:28% V/V). Flow rate of 1ml/min was maintained and the detection was carried out at 230 nm. Separation was achieved on Inertsil ODS (250×4.6 mm, 5 µm) column with an injection volume of 10 µl with a run time of 8 minutes.
Preparation of Stock and Standard
10 mg of Duloxetine hydrochloride is accurately weighed and transferred into a 10 ml clean, dry volumetric flask, few ml of methanol is added to dissolve completely and then the volume is made up to the mark with methanol to obtain the concentration of 1 mg/ml. Further dilutions were carried out with 0.02% formic acid to get a series of standard concentrations of 2-10 µg/ml.
Method Validation Specificity:
The specificity of the method is established by comparing the chromatograms of drug substance and drug product with that of the blank and placebo and absence of peaks other than the drug peak such as impurities or excipients which ascertain the specificity of the method.
Linearity:
Calibration curves were plotted to establish linearity of the method by employing five standard solutions in the concentration range of 2-10 µg/ml each in triplicate using an injection volume of 10 µl. Statistical analysis of the resultant data was performed and parameters such as slope, intercept, and regression equation were calculated.
Precision:
System precision: It is measured in terms of repeatability of application of a homogenous solution by injecting six replicates of standard solution (30 µg/ml) of drug substance.
Method precision: It is measured in terms of repeatability of application by giving six replicates of sample solution of drug product, 6 µg/ml. In each case, standard deviation and percentage relative standard deviation were evaluated to ascertain the repeatability of the method.
Accuracy:
Accuracy of the developed method is confirmed by performing standard addition and recovery studies. In this method, the sample solution was spiked with known concentrations of standard solutions within the linearity range at three different levels, 80, 100 and 120% of test concentration each in triplicate and analyzed. The percentage recovery and percentage relative standard deviation were tabulated at each level.
Limit of detection (LOD), Limit of quantification (LOQ):
They were established by ratio of average slope and standard deviation method in which LOD and LOQ were determined from the calibration curve. According to this method, LOD=3.3×σ/Sand LOQ=10×σ/S, Where, σ = standard deviation of the y-intercepts and S = mean of slopes obtained in the calibration plots.
107
Robustness of the developed method is determined by making small deliberate changes in flow rate (±0.2 ml/min) and mobile phase (±2%) of the developed method. The deviation in parameters such as retention time, tailing factor, theoretical plates at each condition was tabulated.
System suitability:
System suitability of the method is established by injecting increasing volumes (10-50 µl) of the same homogenous standard solution, (6 µg/ml). The percentages relative standard deviation of retention time, tailing factor and theoretical plate number with respect to change in volume were evaluated.
Stability of stock solution:
Stability of stock solution is determination at a temperature of 2-8ºC by analyzing the stock solution at regular time intervals over a period of 24 hrs.
Assay:
Twenty tablets (DULYN-30) were taken, coating is removed, and tablets were weighed individually to determine the average tablet weight. Tablets are then powdered using mortar and pestle, the powder equivalent to 10 mg of Duloxetine hydrochloride was accurately weighed and transferred into a 10 ml volumetric flask containing 5 ml methanol. The solution was sonicated for 1 min to ensure solubility of drug. The solution was centrifuged for 2 min and supernatant was collected, adequate dilution was done using 0.02% formic acid to obtain a sample solution with a final concentration of 6 µg/ml. The amount present in the blend was quantified by comparing the peak area of standard DLX with that of the tablet formulation and the data presented in Table 1. The percentage assay of DLX was calculated by using the following formula:
Where, AT = Peak Area of DLX obtained with test preparation; AS = Peak Area of DLX obtained with standard preparation; DS = Dilution factor of standard solution; DT = Dilution factor of sample solution; WS = Weight of working standard (mg); WT = Weight of working standard (mg).
RESULTS AND DISCUSSIONS
Method Development
[image:3.612.158.457.550.658.2]Different trails were performed with various columns, mobile phase combinations and diluents for optimum elution of Duloxetine hydrochloride. Initial trail was carried out with PHENOMENEX C18 column (250×4.6 mm, 5 µ) using a mobile phase of 0.02% formic acid and methanol in the ratio 50:50(v/v) at a flow rate of 1 ml/min. With these LC conditions, Duloxetine hydrochloride peak was eluted preceding the solvent front with a tailing factor (4.35). The mobile phase is changed to 0.02% formic acid and acetonitrile in the ratio of 75:25(v/v) at a flow rate 1ml/min. The peak was eluted with a tailing factor (1.381) without proper peak resolution. The mobile phase composition is changed to 72:28(v/v) with the flow rate 1 ml/min. With these LC conditions the DLX was eluted as a sharp peak at 5.243 min which showed ideal peak properties. The standard chromatogram of Duloxetine hydrochloride was shown in Figure 2. The developed method was validated as per ICH guidelines.
Figure 2: Chromatogram of DLX (10 µg/ml)
0.0 1.0 2.0 3.0 4.0 5.0 6.0 7.0 8.0 9.0 m in 0
10 20 30 40 50 m V
Detector A Ch1:230nm
5
.2
4
108
Method Validation Specificity:
[image:4.612.147.467.122.228.2]Specificity of the method was ascertained from the overlay of the standard, sample, blank, placebo chromatograms as shown in Figure 3.
Figure 3: Overlay of the chromatograms of standard, sample, blank, placebo samples
No interference by the matrix, excipients or any other impurities was observed at the elution time of Duloxetine hydrochloride implying the specificity of the method for detection of Duloxetine hydrochloride.
Linearity:
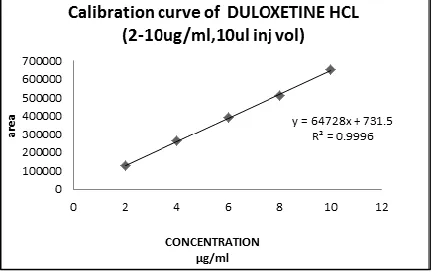
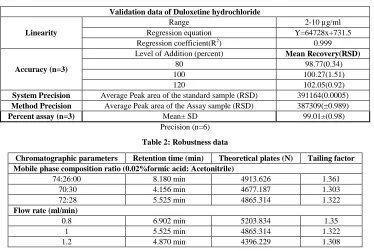
Linearity was established over a concentration range of 2-10 µg/ml by plotting a graph of concentration versus respective peak areas. Regression analysis of the data thus obtained showed a good regression coefficient of 0.999 with a regression equation Y=64728x+731.6. The standard deviation and percentage relative standard deviation values were calculated at each concentration which was found to be within limits i.e., less than 2. The data obtained was shown in Table 1 (Figure 4).
Figure 4: Calibration curve of duloxetine HCL
Precision:
System and method precision studies were carried out by giving six replicate injections of 6µg/ml standard solution of drug and sample solution of drug product respectively. The data obtained was shown in Table 1. The percentage relative standard deviation obtained was found to be less than 2% for peak areas as per specifications.
Accuracy:
Accuracy of the method was determined by employing standard addition method. The amount of recovery and percentage relative standard deviation at each level i.e., 80, 100 and 120% of test concentration was calculated and it was found to be less than 2 percent. The accuracy data was represented in Table 1.
LOD and LOQ:
Limit of detection and limit of quantification values were calculated employing the average slope and standard deviation ratio method. The LOD and LOQ values obtained were 0.0206 µg/ml and 0.0624 µg/ml respectively.
Robustness:
Robustness studies were carried out by making small deliberate changes in the flow rate, (±0.2 ml/min) and mobile phase composition (±2%) and %RSD was calculated for parameters such as number of theoretical plates, tailing
0.0 0.5 1.0 1.5 2.0 2.5 3.0 3.5 4.0 4.5 5.0 5.5 6.0 6.5 min
[image:4.612.198.416.348.486.2]109
[image:5.612.121.495.110.361.2]factor with respect to the changes were tabulated. Retention times were significantly changed with flow rate and mobile phase compositions. The results obtained were satisfactory and shown in Table 2.
Table 1: Linearity, precision and accuracy data of DLX
Validation data of Duloxetine hydrochloride
Linearity
Range 2-10 µg/ml
Regression equation Y=64728x+731.5 Regression coefficient(R2) 0.999
Accuracy (n=3)
Level of Addition (percent) Mean Recovery(RSD)
80 98.77(0.34)
100 100.27(1.51)
120 102.05(0.92)
System Precision Average Peak area of the standard sample (RSD) 391164(0.0005)
Method Precision Average Peak area of the Assay sample (RSD) 387309(±0.989)
Percent assay (n=3) Mean± SD 99.01±(0.98) Precision (n=6)
Table 2: Robustness data
Chromatographic parameters Retention time (min) Theoretical plates (N) Tailing factor Mobile phase composition ratio (0.02%formic acid: Acetonitrile)
74:26:00 8.180 min 4913.626 1.361
70:30 4.156 min 4677.187 1.303
72:28 5.525 min 4865.314 1.322
Flow rate (ml/min)
0.8 6.902 min 5203.834 1.35
1 5.525 min 4865.314 1.322
1.2 4.870 min 4396.229 1.308
System suitability:
System suitability studies were carried out by injecting five times a 6 µg/ml standard concentration of DLX at different injection volumes ranging from 10 µl-50 µl. The system suitability test parameters like retention time, tailing factor, theoretical plate number were less than 2 indicating the present conditions were suitable for the analysis of DLX.
Assay:
The percentage assay of the drug in the formulation was obtained by comparing the peak areas of the sample with that of the standard and they were found to be 99.01% respectively.
Stability of the analytical stock:
[image:5.612.171.443.542.642.2]The stability of the stock and standard solution were determined by analysis of the samples under refrigeration (8 ± 1ºC) at different time intervals up to 24 hours. The percent variation in assay values at different time intervals were found to be less than 2 when compared with the initial zero time interval solution, thus indicating that the solution was stable for a period of 24 hours when stored at 8ºC (Figure 5).
Figure 5: Stability of the analytical stock
CONCLUSION
Duloxetine hydrochloride is a potent inhibitor of serotonin and norepinephrine reuptake and thus it is used for major depressive disorders. Furthermore, it provides evidence of an effect on pain in case of urinary incontinence. A
0.0 0.5 1.0 1.5 2.0 2.5 3.0 3.5 4.0 4.5 5.0 5.5 6.0 6.5 m in 0
10 20 30 40 50
60m VDetector A Ch1:230nm
5
.6
5
110
sensitive RP-HPLC-PDA method was developed for the determination of DLX in bulk, pharmaceutical dosage form with economical mobile phase composition and shorter run time. The developed method is validated as per ICH guidelines.
ACKNOWLEDGEMENT
The authors are thankful to Lifeline Formulations Pvt Ltd., Vijayawada for providing the gift sample of DLX and also to the Siddhartha Academy of General and Technical Education, Vijayawada for providing the necessary facilities to carry out the research work.
REFERENCES
[1] JO Maryadele. The Merck Index, 14th edition, Whitehouse Station, NJ: Merck and Co.Inc, 2006. 3465. [2] ASC Sweet Man. In: Martindale, The complete drug reference, 34th edition, London: Pharmaceutical Press;
2005, 291.
[3] JT Johnson; SW Oldham; RJ Lantz; AF Delong. J Liq.Chromatogr Relat Technol. 1996, 19, 1631-1641. [4] BA Olsen; MD Argentine. J Liq Chromatogr Relat Technol. 1996, 19, 1993-2007.
[5] L Mercoline; R Mandrioli; R Cazzolla; M Amore; MA Raggi. J Chromatogr B. 2007, 856, 81-87. [6] C Waldschmitt; F Vogel; C Maurer; C Hiemke. Ther Drug Monit. 2007, 29, 767-772.
[7] S Dasari; RK Viriyala; K Santosh; A Kumari; BVV Ravi Kumar; SPS Bisht. Phar Glob (IJCP). 2010, 1, 1-3.
[8] PS Lakshmana; M Srinivasan; S Thiyagarajan; Q Marina. Int J Chem Technol Res. 2010, 2, 1441-1444. [9] PP Dahivelkar; VK Redasani; SB Bari. J Global Pharma Technol. 2010, 2, 19-23.
[10] SS Dhaneshwar; P Deshpande; M Patil; G Vadnerkar; SR Dhaneshwar. Indian J Pharma Sci. 2008, 70, 233-236.
[11] S Sheikh; AW Siddiqui; MT Masroor; V Arora. Chromatogr Res Int. 2011, 2011, 1-5. [12] UK Chhalotiya; KK Bhatt; DA Shah; SL Baldania. Sci Pharm. 2010, 78, 857-868.
[13] N Ma; BK Zhang; HD Li; BM Chen; P Xu; F Wang; RH Zhu; S Feng; DX Xiang; YG Zhu. Clin Chim Acta. 2007, 380, 100-105.
[14] SP Senthamil; KV Gowda; U Mandal; SWD Sam; TK Pal. J Chromatogr B Analyt Technol Biomed Life Sci. 2007, 858, 269-275.
[15] DC Reddy; AT Bapuji; VS Rao; V Himabindu; RD Rama; S Syedba; HLV Ravikiran. E-J Chem. 2011, 9, 899-911.
[16] International Conference on Harmonization Q1A (R2), Stability testing of new drug substances and products, Geneva, 2003.