International Journal of Emerging Technology and Advanced Engineering
Website: www.ijetae.com (ISSN 2250-2459, Volume 2, Issue 8, August 2012)13
A model for optimizing time and costs of collection pallets
Eduardo Gutiérrez González
1, Olga Vladimirovna Panteleeva
2, Víctor Manuel Córdoba Lobo
3 1 National Polytechnic Institute, Section of graduate studies and research, Av. Te 950, 08400, Mexico2Colegio de Postgraduados, Posgrado en Socioeconomía, Estadística e informática Campus Montecillo México-Texcoco56230
Montecillo, México
3 National Polytechnic Institute, math academies, Av. Te 950, 08400, Mexico
Abstract - This paper combines a linear optimization model, the Traveling Salesman Problem and economic evaluation projected to 5 years that minimizes the collection time and the costs for a pallet leasing company when the pallets are empty in supermarkets. The model is based on optimizing an adequate fleet to collect the pallets. The plan is to verify the model and compare the collection times used with the current company work scheme, and that obtained with the proposed solution to collect 357,687 pallets located at 55 institutions located in 46 cities, municipalities and delegations of central, south, and western Mexico, which should supply the Metropolitan area reservoir. With the proposed model the pallet time collection is reduced by 27%. So the proposal would result in a 5 years saving of $781,195.1 usd.
Mathematics Subject Classification (2010): 90B06, 90C10
Keywords - Model optimization, Traveling Salesman Problem, NP hard time, tour
I. INTRODUCTION
The routing of vehicles on road transportation networks is an area of great importance to transportation planners within scientific literature. This field includes well known and studied problems like those of traveling salesman or TSP (Rodriguez & Ruiz, 2012). This problem has been extensively studied since its processing time is NP hard and different metaheuristics algorithms have been proposed (Erdogan et al., 2012), heuristics for the TSP (Rego et al., 2011), the parallelized genetic ant colony system (Chen & Chien, 2011), the Lin-Kernighan heuristic (Karapetyan & Gutin, 2011), the genetic algorithm for the one-commodity pickup-and-delivery TSP (Zhao et al., 2009), etc..
The TSP is that it has large logistic applications in companies that deliver or collect their products, e.g. Bonomo et al. propose a TSP method to optimize vehicles routes to collect trash bins all over the south of Buenos Aires, Argentina. With this application there were real reductions in travel distances ranging from 10% to 40% with savings of $200,000 per year (Bonomo et al., 2012).
Mladenovic et al. present another application of TSP characterized by a set of customers such that each customer either supplies (pickup customers) or demands (delivery customers) a given amount of a single product (Mladenovic et al., 2012). Laporte et al. showed a generalization of the TSP problems (Laporte et al., 1996). These problems include location-routing, material flow system design, post-box collection, stochastic and vehicle routing. The TSP applications can be in different media tours, e.g. Rakke et at. show a maritime problem to determine an optimal sequence of visits of the cargo ships to ports (Rakke et at., 2012). There are also generalizations of the TSP where it is not necessary to visit all nodes, as shown by (Feillet et al., 2005) or the work of (Baldacci et al., 2003). They described new integer programming formulation for the TSP with mixed deliveries and collections based on a two-commodity network flow approach. Butler et al. described a new extension to the Symmetric Travelling Salesman Problem in which some nodes are visited in 2 periods and the remaining nodes visited in 1 period (Butler et al., 1997).
The generalized traveling salesman problem (GTSP) is a well-known combinatorial optimization problem with a host of applications. It is an extension of the TSP where the set of cities is partitioned into so-called clusters, and the salesman has to visit every cluster only once. This article applies the GTSP (Bontoux, Artigues & Feillet, 2010), (Karapetyan & Gutin, 2012) to the strategic supply chain company CHEP Mexico, because it has presented problems in recent years of a shortage of pallets to fill orders for its customers during the year, mainly in the last quarter. The season of the year-end cost to the company is very high, so that some clients choose to go with the competition as a result of incurred delivery delays. This situation is exacerbated mainly in the central region of the country and is due to the following:
International Journal of Emerging Technology and Advanced Engineering
Website: www.ijetae.com (ISSN 2250-2459, Volume 2, Issue 8, August 2012)14
• Time taken in return to depot.• Time taken for a pallet to be inspected, and / or repaired.
• Unavailability of transport units.
Undoubtedly, this causes an increase in the collection time which has been found to be up to three weeks after the date Mexico CHEP reported the existence of empty pallets. Therefore, the company needs a better method of collection and distribution of pallets to optimize time in peak periods and does not require the purchase or erection of new pallets, making a saving that can be used for the purchase of unit transport, to formalize its own fleet of staff to collect and distribute pallets.
This article will design and evaluate a TSP model for the company to reduce collection times of pallets in 55 supermarket entities located in 12 states of Mexico and Mexico City and taken to the warehouse located in Tultitlan MX16 Mexico State. The evaluation period takes place during the year-end collection (covering the months October, November and December), considered as one of the most critical seasons.
The solution of the linear programming model includes: 1. The optimal number of truck types collecting the
weekly volumes of pallets.
2. The assignment of each of these trucks in the collection of the 46 locations, based on the number of trips taken per week.
3. Planning optimal routes provided by the GTSP. II. MATERIALS AND METHODS
Finding the optimal quantity of pallets to collect and organize a typical Traveling Salesman Problem to optimize the collection time.
2.1 Model for calculating the optimum number of transport units to collect pallets
Suppose we have m types of collection trucks of pallets with capacitiesc1,c2,,cm, such thatc1c2cm
.
On the other hand, CT is the total number of pallets to collect on the net per week denoted by x1,x2,,xm decision variables are defined as: xj decision variables are definedas cj to collect CT pallets, with j1,2,3,,m.
Namely, T
m
j j jx C c
1
, then the problem is:
m j x c C x c C x c x Z j T m j j j T m j j j m j j , , 2 , 1 integer negative -non 1 min 1 1 1 1
This model indicates the number of trips each truck required to make with capacities c1,c2,,cm, so that they can carry all CT network pallets. In the case of n tours a model is applied to each, for the number of trucks that are required for each type. To this we must know how many trips each truck can make a week.
Let q1,q2,,qm be the number of trips a week that the truck can make with capacity c1,c2,,cm respectively. In case of necessity to restrict the number of trucks used for
each type, the constraint added is j j n
i
ij q r x
1
, where, rj
represents the availability of trucks type j.
Objective function for the entire network:
n i m j ij x Z 1 1 min . With restrictions m j n i j i x r q x c C x c C x c ij j j n i ij T m j ij j T m j ij j i i , , 2 , 1 ; , , 2 , 1 ; , integer negative -non 1 1 1 1 1
Where cj Truck capacity j, xij Number of truck trips j in tour i,
i T
C Number of pallets to collect on the
tour I and rj Availability of trucks j for collection.
2.2 Calculation of the optimal number of trucks
International Journal of Emerging Technology and Advanced Engineering
Website: www.ijetae.com (ISSN 2250-2459, Volume 2, Issue 8, August 2012)15
3 ½ pickup (collection capacity:c
1
72
pallets)Torton 24 feet (collection capacity:
c
2
252
pallets)Platform 40 feet (collection capacity:
c
3
432
pallets)Platform 48 feet (collection capacity:
c
4
504
pallets)Platform 53 feet (collection capacity:
c
5
540
pallets)The network of pallet collection by the company is bounded by a storage center that caters to 55 institutions in 12 states and Federal District. The geographical network position is decomposed into n=8 tours, denoted by the letters A, B,…, H.
Tour A:Neza (AN), Ixtapaluca (AI), Puebla (AP), San Martín Texmelucan (AS), Tehuacán (ATH), Teziutlan (ATZ) y Oaxaca (AO).
Tour B: Metepec (BM), Toluca (BT), Zinacantepec (BZ), Morelia (BMO), Uruapan (BU), Guadalajara (BG), Tlaquepaque (BTL), Tonalá (BTO) y Zapopan (BZA).
Tour C (Metropolitan zone): Atizapán (CA), Cuautitlán (CC), Ecatepec (CE), Huixquilucan (CH), Tecamac (CT), Tlalnepantla (CTL) y Naucalpan de Juárez (CN).
Tour D (Federal District): Álvaro Obregón (DA), Benito Juárez (DB), Coyoacán (DC), Gustavo A. Madero (DG), Miguel Hidalgo (DM), Tlalpan (DT), y Venustiano Carranza (DV).
Tour E: Querétaro (EQ) y San Juan del Río (ES).
Tour F:Ciudad Valles (FC), San Luis Potosí (FS), Fresnillo (FF) y Zacatecas (FZ).
Tour G:Celaya (GC), Irapuato (GI), León (GL) y Aguascalientes (GA).
Tour H:Cuernavaca (HC), Jiutepec (HJ), Acapulco de Juárez (HA), Iguala de la Independencia (HI) y Zihuatanejo (HZ).
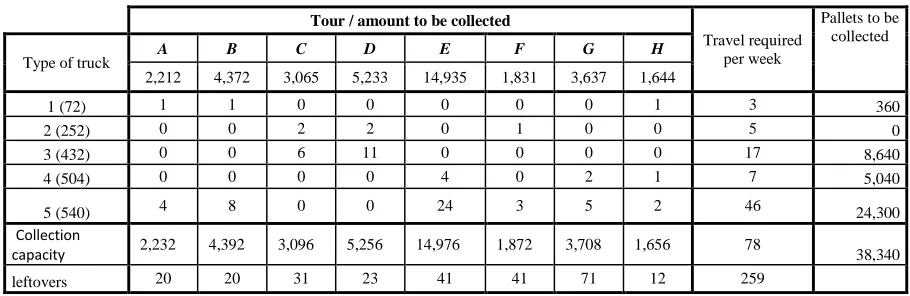
To collect the weekly demand for two years, the maximum value is chosen, being spread over 36.929 pallets tours set, see Table 2.1. Gutierrez et al 2012.
For tours C and D larger capacity trucks (48 and 53 feet) are excluded because these tours only involve locations within the Metropolitan area and Federal District, by the type of large trucks moving with traffic on Metropolitan area avenues which will be extremely slow and in some cases impossible.
Then the model:
5 4 3 2 1 5 4 3 2 1 5 4 3 2 1 5 4 3 2 1 3 2 1 3 2 1 5 4 3 2 1 5 4 3 2 1 min xh xh xh xh xh xg xg xg xg xg xf xf xf xf xf xe xe xe xe xe xd xd xd xc xc xc xb xb xb xb xb xa xa xa xa xa z Subject to 5233 432 252 72 3136 432 252 72 4372 540 504 432 252 72 2212 540 504 432 252 72 1715 540 504 432 252 72 3708 540 504 432 252 72 1902 540 504 432 252 72 15006 540 504 432 252 72 5304 432 252 72 3136 432 252 72 4443 540 504 432 252 72 2283 540 504 432 252 72 3 2 1 3 2 1 5 4 3 2 1 5 4 3 2 1 5 4 3 2 1 5 4 3 2 1 5 4 3 2 1 5 4 3 2 1 3 2 1 3 2 1 5 4 3 2 1 5 4 3 2 1 xd xd xd xc xc xc xb xb xb xb xb xa xa xa xa xa xh xh xh xh xh xg xg xg xg xg xf xf xf xf xf xe xe xe xe xe xd xd xd xc xc xc xb xb xb xb xb xa xa xa xa xa 1644 540 504 432 252 72 3637 540 504 432 252 72 1831 540 504 432 252 72 14935 540 504 432 252 72 5 4 3 2 1 5 4 3 2 1 5 4 3 2 1 5 4 3 2 1 xh xh xh xh xh xg xg xg xg xg xf xf xf xf xf xe xe xe xe xe
International Journal of Emerging Technology and Advanced Engineering
Website: www.ijetae.com (ISSN 2250-2459, Volume 2, Issue 8, August 2012) [image:4.612.74.529.157.305.2]16
Table 1Preliminary amount of trips required for each type of truck on tours
Tour / amount to be collected
Travel required per week
Pallets to be collected
Type of truck A B C D E F G H
2,212 4,372 3,065 5,233 14,935 1,831 3,637 1,644
1 (72) 1 1 0 0 0 0 0 1 3 360
2 (252) 0 0 2 2 0 1 0 0 5 0
3 (432) 0 0 6 11 0 0 0 0 17 8,640
4 (504) 0 0 0 0 4 0 2 1 7 5,040
5 (540) 4 8 0 0 24 3 5 2 46 24,300
Collection
capacity 2,232 4,392 3,096 5,256 14,976 1,872 3,708 1,656 78 38,340
leftovers 20 20 31 23 41 41 71 12 259
There are a total of 78 collecting trips: 3 trips of truck type-1, 5 type-2 trips, 17 trips of type-3, 7 trips of 4 and 46 type 5. Contemplating 5 days a week of work and assuming that each truck can make one trip per day on each tour, with the exception of tours C and D, where it can take up to two trips per day times because the shop receiving time is 06:00 to 19:00. The optimum amount of trucks that are recommended is 14, distributed as follows: One type 1, two type 3, two type 4 and nine type 5.
In the last column to the right of Table 1 can be seen the maximum amount collected from truck types 1 and 3 is 9.000 pallets. Then the maximum amount a week tours C and D is bounded by 9.000 pallets.
2.3 Weekly collection pallets
After determining the optimal quantity of trucks types the company intends to require a trial period in which the model is verified and the collection of pallets made during this period.
For the routes of the proposed truck fleet in the collection of pallets the Traveling Salesman Problem (TSP) is used. Thus, from a starting node called in this case depot,
1
n sites in cij distance between nodes i, j must be visited. The aim therefore is to create a program for the minimum route distance.
Variables: For each possible distance the graph defines a variable,
otherwise ,
0
, , 2 , 1 , cycle in the this ) , ( distance the
if ,
1 i j i j n
xij
The objective function is to minimize travel distances:
1 1
min i
i j j
ij ijx c
Z .
Restrictions: It is necessary to visit all the locations where there are pallets and this requires two types of restrictions, arrival and departure, respectively
n j
x
j i i
ij 1, 1,2,... 1
,
n j
x
j i
j
ij 1, 1,2,... 1
III. RESULTS
For verification, the model is applied for a 13 week period of pallet collection.
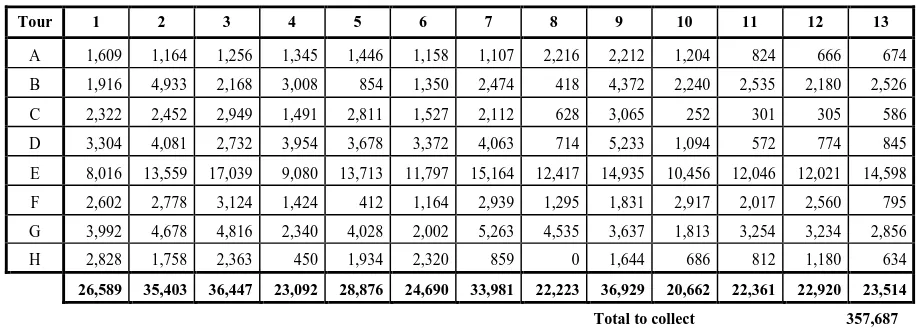
3.1 Weekly collection of pallets with the model proposed With the use of 14 trucks 357.687 pallets are to be collected distributed in 8 tours during the 13 weeks, see Table 2.
International Journal of Emerging Technology and Advanced Engineering
Website: www.ijetae.com (ISSN 2250-2459, Volume 2, Issue 8, August 2012) [image:5.612.72.531.157.321.2]17
Table 2Pallet volumes to collect on each tour for 13-week trial
Tour 1 2 3 4 5 6 7 8 9 10 11 12 13
A 1,609 1,164 1,256 1,345 1,446 1,158 1,107 2,216 2,212 1,204 824 666 674 B 1,916 4,933 2,168 3,008 854 1,350 2,474 418 4,372 2,240 2,535 2,180 2,526 C 2,322 2,452 2,949 1,491 2,811 1,527 2,112 628 3,065 252 301 305 586 D 3,304 4,081 2,732 3,954 3,678 3,372 4,063 714 5,233 1,094 572 774 845 E 8,016 13,559 17,039 9,080 13,713 11,797 15,164 12,417 14,935 10,456 12,046 12,021 14,598 F 2,602 2,778 3,124 1,424 412 1,164 2,939 1,295 1,831 2,917 2,017 2,560 795 G 3,992 4,678 4,816 2,340 4,028 2,002 5,263 4,535 3,637 1,813 3,254 3,234 2,856 H 2,828 1,758 2,363 450 1,934 2,320 859 0 1,644 686 812 1,180 634
26,589 35,403 36,447 23,092 28,876 24,690 33,981 22,223 36,929 20,662 22,361 22,920 23,514
Total to collect 357,687
3.2 Design of the route
Tables A.2 show the distances between each site and collection depot for each of the eight tours. To determine the routes that transport units will make assuming that demand is available prior to the allocation of collection, the TSP algorithm is using.
Finally, the collection is done in reverse, i.e. the truck starts at the most distant store until arriving at the depot.
Tables A.3 show the routes taken during the thirteen weeks analyzed for each of the seven constructed tours. They also show the distance per week and the total. How to interpret tables A.4 is very easy, each row shows the week and a sequence of numbers shows the route, which begins in the depot and ends in the same denoted by D. Tour E is very easy and shows separately their optimal tours.
Tour E: In weeks 1-5, 7 and 9-13 the tour is from Queretaro depot then to San Juan del Rio depot for a total of 346 km. For weeks 6 and 8, the tour is Queretaro depot and return with a distance of 346 km also. The total in thirteen weeks is 4.498 Km.
IV. DISCUSSIONS
Collection with this model requires 57 days in total to collect 357,687 pallets, the amount collected by carriers engaged in 78 days, working 6 days a week for 13 weeks. Then, there is a saving of 21 days, with respect to the number of days employed by external carriers. This proposal would have to initially invest in the purchase of trucks, but making an economic study, after several years it is more profitable to invest in the purchase of fourteen trucks.
a. Costs with external transport: $675,943.93usd
The approximate annual cost of collections with external transport during the year is calculated by extrapolating the three months that were taken as the study period, resulting in:
Average number of pallet collection : 27,514 Average amount per day of collection: 4,586 Approximate cost per pallet collection: $0.47 US Annual cost of collection is $675,943.93 US b.Costs with the proposed improvements: $1,017,952.75
USD
The act of acquiring transport units involves a very strong initial outlay for the company. However we must take into account that the company must acquire them without losing capital.
Breakdown of approximate annual costs:
1.- Purchase of trucks: $584,251.96usd
Type of truck Collection
capacity amount
Cost Approx.
per unit (US) Total cost Truck 3 1/2 72 1 $20,472.44 $20,472.44 Platform 40 feet 432 2 $31,496.06 $62,992.12 platform 48 feet 504 2 $37,795.27 $75,590.55 Platform 53 feet 540 9 $47,244.09 $425,196.85
International Journal of Emerging Technology and Advanced Engineering
Website: www.ijetae.com (ISSN 2250-2459, Volume 2, Issue 8, August 2012)18
2.- Salaries: $173,858.26usdPost Staff Monthly
Salary Total Monthly Salary
Annual Salary drivers 14 $866.14 $12,125.98 $145,511.81 supervisors 2 $1,181.10 $2,362.20 $28,346.45
$173,858.26
3.- Annual fixed costs: $259.84 usd
Parts and Maintenance: $55,118.11 usd. Booths: $47,244.09 usd.
Communication: $7,874.01 usd.
Insurance and Holdings: $39,370.07 usd. Fuel: $47,244.09 usd.
Other costs: $62,992.12 usd.
Without the purchase of trucks the cost would be $433,700.78usd representing a saving of $242,243.15 usd.
The purchase of trucks shows that the proposed improvement would be spending $342,008.82usd more than that spent on external transport. To actually measure the economic impact that the current work scheme is costing the company an economic assessment of 5 years must be made.
c. Economic evaluation
To compare the money adequately Present Value (PV) is used. To evaluate both options a minimum acceptable rate of 30% return annually will be handled.
With external transport:
if i30%; CT $675,905.51 usd; n5years
58 . 308 , 646 , 1 ) 30 . 1 ( 51 . 951 , 675 ) 30 . 1 ( 51 . 951 , 675 ) 30 . 1 ( 51 . 951 , 675 ) 30 . 1 ( 51 . 951 , 675 ) 30 . 1 ( 51 . 951 , 675 5 4 3 2 1 PV
Proposal for improvement:
5 5 2 4 2 3 2 2 2 1 2 1 ) 1 ( . . ) 1 ( ) 1 ( ) 1 ( ) . 1 ( ) 1 ( i V S i C i C i C i C i C C PV
Where i 30%; C1$584,251.96 usd ; CT $1,017,952.75 usd, n5years.
Other costs = $433,700.78 usd Depreciation = 25% annual
Depreciation recovery = $584,251.96 usd. times 0.25= $146,063 usd.
2
C other costs -depreciation recovery = $287,637.8usd.
. .V
S Salvage value of vehicles = C150%C1
= $292,125.98 usd (the vehicles to be sold at the end of fifth year) 85 . 135 , 206 , 1 ) 30 . 1 ( 98 . 292125 ) 30 . 1 ( 80 . 287637 ) 30 . 1 ( 80 . 287637 ) 30 . 1 ( 80 . 287637 ) 30 . 1 ( 80 . 287637 ) 30 . 1 ( 80 . 287637 96 . 584251 5 5 4 3 2 1 PV
The option to be selected is the least cost incurred in present value. Therefore the best choice of costs is the proposed improvement.
Finally, in 5 years the approximate cost for collection in the Metropolitan area, assuming a 6% annual work scheme, the approximate cost would be $3,810,358.82usd in the same period. So the proposal would result in a 5 years saving of $781,295.2 usd.
V. CONCLUSIONS AND FUTURE WORK
The proposed model allows in the first instance, establishing the optimum number of trucks needed in terms of the existing collection volumes. To this was considered the collection volume of 13 weeks (3 months). Based on this, it was determined that the fleet should consist of: one 3 ½ pickup, two trucks of 40 feet, two trucks of 48 feet and nine trucks of 53 feet.
The results showed that while foreign carriers took 78 days to collect 357.687 pallets and supply them to MX16 depot located in the Metropolitan area, that same volume fleet consisting of 14 trucks would take 57 days. The collection area to cater to this depot included shops and/or distribution centers located in 46 cities, municipalities and/or delegations from 13 central, south and west Federal states.
To achieve such a time reduction the collection area was segmented into 8 tours, where transport units had to make the tours every week. To design the routes it was necessary to plan them based on the Traveling Salesman Algorithm, making them always represent the shortest path.
International Journal of Emerging Technology and Advanced Engineering
Website: www.ijetae.com (ISSN 2250-2459, Volume 2, Issue 8, August 2012)19
ACKNOWLEDGMENTSThe authors thank the company Voltran S.A. of C.V. for
their support in obtaining the information used in development work, and we thank the anonymous referees whose comments led to an improved presentation of our work.
REFERENCES
[1] Baldacci, R., Hadjiconstantinou, E., & Mingozzi, A. (2003). An exact algorithm for the traveling salesman problem with deliveries and collections. Networks, 42(1), 26-41.
[2] Bonomo, F., Duran, G., & Larumbe, F. (2012). A method for optimizing waste collection using mathematical programming: a Buenos Aires case study. Waste Management & Research, 30(3), 311-324.
[3] Bountox, B., Artiques, C., & Feillet, D. (2010). A Memetic Algorithm with a large neighborhood crossover operator for the Generalized Traveling Salesman Problem,. Computers & Operations Research, 37(11 Special Issue: SI), 1844-1852. [4] Butler, M., Williams, H., & Yarrow, L. (1997). The two-period
travelling salesman problem applied to milk collection in Ireland. Computational Optimization and Applications, 7(3), 291-306. [5] Chen, S.-M., & Chien, C.-Y. (2011). Parallelized genetic ant colony
systems for solving the traveling salesman problem. Expert Systems with Applications, 38(4), 3873-3883.
[6] Erdogan, G., Battarra, M., & Laporte, G. (2012). Metaheuristics for the traveling salesman problem with pickups, deliveries and handling costs,. Computers & Operations Research, 39(5), 1074-1086.
[7] Feillet, D., Dejax, P., & Genderau, M. (2005). Traveling salesman problems with profits. Transportation Science, 39(2), 188-205. [8] Glomvik, R. J., Christiansen, M., & Fagerholt, K. (2012). The
Traveling Salesman Problem with Draft Limits,. Computers & Operations Research, 39(9), 2161-2167.
[9] Gutiérrez G.E., Cordoba L.V.M & Panteleeva O.V. (2012). A method for optimizing the collection of pallets using the Traveling Salesman Problem, Advances and Applications in Discrete Mathematics, pp. (0)
[10] Karapetyan, D., & Gutin, G. (2011). Lin-Kernighan heuristic adaptations for the generalized traveling salesman problem,. European journal of Operation Research, 208(3), 221-232. [11] Karapetyan, D., & Gutin, G. (2012). Efficient local search
algorithms for known and new neighborhoods for the generalized traveling salesman problem,. European journal of Operation Research, 219(2), 234-251.
[12] Laporte, G., AsefVaziri, A., & Sriskandarajah, C. (1996). Some applications of the generalized travelling salesman problem,. Journal of The Operational Research Society, 47(12), 1461-1467. [13] M, B., HP, W., & LA., Y. (1997). The two-period travelling
salesman problem applied to milk collection in Ireland,. Computational Optimization and Applications, 7(3), 291-306. [14] Mladenovic, N., Urosevic, D., & Hanafi, S. (2012). A general
variable neighborhood search for the one-commodity pickup-and-delivery travelling salesman problem,. European Journal of Operational Research, 220(1), 270-285.
[15] Rakke, J. G., Christiansen, M., & Fagerholt, K. (2012). The Traveling Salesman Problem with Draft Limits. Computers & Operations Research, 39(9), 2161-2167.
[16] Rego, C., Gamboa, D., & Glover, F. (2011). Traveling salesman problem heuristics: Leading methods, implementations and latest advances,. European journal of Operation Research, 211(3), 427-441.
[17] Rodriguez, A., & Ruiz, R. (2012). The effect of the asymmetry of road transportation networks on the traveling salesman problem. Computers & Operations Research, 39(7), 1566-1576.
[18] Shyi-Ming, C., & Chih-Yao, C. (2011). Parallelized genetic ant colony systems for solving the traveling salesman problem,. Expert Systems with Applications, 38(4), 3873-3883.
[19] Shyi-Ming, C., & Chih-Yao, C. (2011). Parallelized genetic ant colony systems for solving the traveling salesman problem,. Expert Systems with Applications, 38(4), 3873-3883.
International Journal of Emerging Technology and Advanced Engineering
Website: www.ijetae.com (ISSN 2250-2459, Volume 2, Issue 8, August 2012) [image:8.612.66.548.173.695.2]20
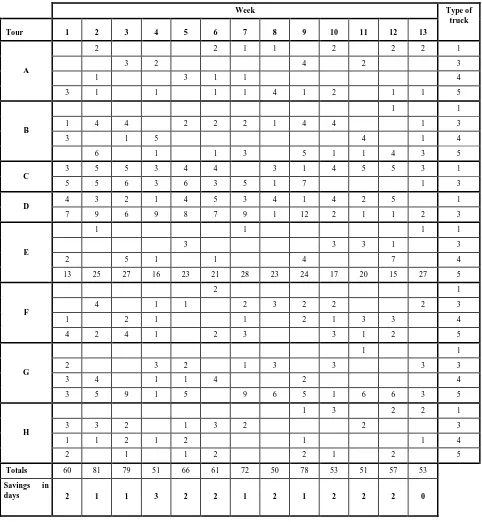
VI. APPENDIXTable A.1
Number of trips required for collection by tour for each of the 4 trucks types.
Week Type of
truck
Tour 1 2 3 4 5 6 7 8 9 10 11 12 13
A
2 2 1 1 2 2 2 1
3 2 4 2 3
1 3 1 1 4
3 1 1 1 1 4 1 2 1 1 5
B
1 1
1 4 4 2 2 2 1 4 4 1 3
3 1 5 4 1 4
6 1 1 3 5 1 1 4 3 5
C 3 5 5 3 4 4 3 1 4 5 5 3 1
5 5 6 3 6 3 5 1 7 1 3
D 4 3 2 1 4 5 3 4 1 4 2 5 1
7 9 6 9 8 7 9 1 12 2 1 1 2 3
E
1 1 1 1
3 3 3 1 3
2 5 1 1 4 7 4
13 25 27 16 23 21 28 23 24 17 20 15 27 5
F
2 1
4 1 1 2 3 2 2 2 3
1 2 1 1 2 1 3 3 4
4 2 4 1 2 3 3 1 2 5
G
1 1
2 3 2 1 3 3 3 3
3 4 1 1 4 2 4
3 5 9 1 5 9 6 5 1 6 6 3 5
H
1 3 2 2 1
3 3 2 1 3 2 2 3
1 1 2 1 2 1 1 4
2 1 1 2 2 1 2 5
Totals 60 81 79 51 66 61 72 50 78 53 51 57 53
Savings in
International Journal of Emerging Technology and Advanced Engineering
Website: www.ijetae.com (ISSN 2250-2459, Volume 2, Issue 8, August 2012)21
Tables A.2Distances in kilometers between the depot and each tour location.
Tour A Depot AN AI AP AS ATH ATZ AO
Depot 64 66 149 111 263 296 482
AN 64 22 110 72 224 257 443
AI 66 22 94 56 208 241 427
AP 149 110 94 38 114 147 333
AS 111 72 56 38 152 185 371
ATH 263 224 208 114 152 261 283
ATZ 296 257 241 147 185 261 480
AO 482 443 427 333 371 283 480
Tour B Depot BM BT BZ BMO BU BG BTL BTO BZA
Depot 80 78 88 329 438 565 552 569 570
BM 80 11 21 249 358 498 485 502 503
BT 78 11 10 238 347 487 474 491 492
BZ 88 21 10 248 357 497 484 501 502
BMO 329 249 238 248 109 276 263 280 281
BU 438 358 347 357 109 303 290 299 308
BG 565 498 487 497 276 303 13 4 5
BTL 552 485 474 484 263 290 13 7 18
BTO 569 502 491 501 280 299 4 7 9
BZA 570 503 492 502 281 308 5 18 9
Tour C Depot CA CC CE CH CT CTL CN
Depot 20 13 22 42 30 16 32
CA 20 13 26 33 41 7 17
CC 13 13 30 38 40 20 27
CE 22 26 30 50 15 23 38
CH 42 33 38 50 65 28 13
CT 30 41 40 15 65 38 53
CTL 16 7 20 23 28 38 16
CN 32 17 27 38 13 53 16
Tour D Depot DA DB DC DG DM DT DV Tour E Dep EQ ES
Depot 43 36 45 31 29 56 40 Depot 173 131
DA 43 14 20 18 16 31 27 EQ 173 42
DB 36 14 12 13 16 22 18 ES 131 42
DC 45 20 12 26 21 15 19
DG 31 18 13 26 16 31 11
DM 29 16 16 21 16 30 16
DT 56 31 22 15 31 30 40
DV 40 27 18 19 11 16 40
Tour F Depot FS FC FF FZ Tour G Depot GC GI GL GA
Depot 418 461 654 594 Depot 236 283 353 501
FS 418 297 278 218 GC 236 49 119 267
FC 461 297 547 489 GI 283 49 70 218
FF 654 278 547 60 GL 353 119 70 148
FZ 594 218 489 60 GA 501 267 218 148
Tour H Depot HC HJ HA HI HZ
Depot 127 138 413 230 655
HC 127 11 286 103 528
HJ 138 11 297 114 539
HA 413 286 297 183 242
HI 230 103 114 183 436
International Journal of Emerging Technology and Advanced Engineering
Website: www.ijetae.com (ISSN 2250-2459, Volume 2, Issue 8, August 2012)22
Tables A.3.Seven routes for tours during the 13 weeks analyzed, with the distance traveled.
A AO ATZ ATH AP AS AI AN D Totals BZA BTO BTL BG BU BMO BZ BT BM D Totals
1 1 2 3 4 5 820 1 2 4 3 6 7 5 8 1190
2 1 2 3 4 5 617 1 3 2 4 6 7 5 8 1209
3 1 2 3 4 5 6 557 1 3 2 5 6 4 7 1182
4 1 2 3 4 5 617 1 3 2 5 6 4 7 1182
5 1 2 3 4 5 551 1 3 2 4 667
6 1 2 3 4 5 551 1 2 3 176
7 1 2 3 4 5 6 584 2 1 4 5 3 6 1172
8 1 2 3 4 1258 1 2 3 4 1167
9 1 2 3 4 526 1 2 3 4 5 1190
10 1 2 3 4 5 617 1 2 4 5 3 6 1173
11 1 2 3 4 526 1 2 4 5 3 6 1173
12 1 2 3 323 1 2 3 5 4 6 1325
13 1 2 3 323 1 2 3 4 665
Totalkm traveledtour A 7870 Total km traveled tour B 13471
C CN CTL CT CH CE CC CA D Total DV DT DM DG DC DB DA D Total
1 3 4 2 1 6 5 7 134 1 4 7 2 5 6 3 8 172
2 4 5 1 3 2 6 7 157 3 1 6 4 2 5 7 164
3 4 5 1 3 2 7 6 8 157 3 6 1 4 5 2 7 152
4 4 5 1 3 2 6 7 157 3 1 6 4 2 5 7 164
5 3 4 2 1 5 6 84 3 1 5 4 2 6 188
6 4 5 1 3 2 7 6 8 157 3 1 6 4 2 5 7 164
7 3 5 2 1 4 6 125 2 1 5 4 3 6 182
8 2 1 3 43 1 2 86
9 4 6 1 3 2 5 7 148 3 1 5 2 4 6 164
10 1 2 3 68 1 2 5 3 4 6 152
11 2 1 3 137 3 1 2 4 130
12 1 3 2 4 5 148 1 4 2 3 5 109
13 4 1 3 2 5 139 1 4 2 3 5 116
Totalkm traveledtour C 1654 Totalkm traveledtour D 1943
F FZ FF FC FS D Total GA GL GI GC D Total HZ HI HA HJ HC D Total
1 3 2 1 4 5 1704 1 2 3 4 5 1004 1 3 2 4 5 1310
2 2 1 3 4 1350 1 2 3 4 5 1004 1 3 2 4 5 6 1332
3 1 2 836 1 2 3 4 5 1004 1 3 2 4 5 6 1332
4 2 1 3 4 1350 1 2 3 4 1004 1 2 3 826
5 1 2 3 1176 1 2 3 4 708 1 2 3 4 5 1343
6 1 2 3 1176 1 2 3 4 5 1004 1 3 2 4 5 6 1332
7 1 2 3 1230 1 2 3 4 5 1004 1 2 3 4 482
8 2 1 3 4 1586 1 2 3 4 5 1004 0
9 1 2 836 1 2 3 4 5 1004 2 1 3 4 5 848
10 2 1 3 4 1350 1 2 3 706 2 1 3 826
11 2 1 3 4 1586 1 2 3 706 1 2 3 4 482
12 1 2 3 1230 1 2 3 4 1002 1 3 2 4 5 1332
13 2 1 3 4 1586 1 2 3 706 1 2 3 460