Universal Journal of Mechanical Engineering 3(3): 83-93, 2015 http://www.hrpub.org DOI: 10.13189/ujme.2015.030303
Graphical User Interface (GUI) for Vibration Analysis of
Quarter Car Suspension System Using Random and
Step-Function Road Profiles
Ameen Ahmed Nassar
Department of Mechanical Engineering, College of Engineering, University of Basrah, Iraq
Copyright © 2015 Horizon Research Publishing All rights reserved.
Abstract
In this paper, a successful approach for the vibration analysis of quarter car suspension system using random and step function road profiles, by developing a new graphical user interface (GUI), has been introduced. The main objective of the paper is to show the usefulness and power of Malab GUI in modeling and analyzing dynamic behavior of quarter car suspension system. The second purpose of this paper is to carry out an analysis of using the developed GUI to simulate this system. Illustrated problems in the field of analysis of suspension responses for the quarter car models are carried out. The results show that the developed GUI is very useful for engineers, designers, and analysts of car suspension systems.Keywords
GUI, Vibration, Quarter Car Model, Suspension System1. Introduction
Modeling and analysis of car suspension system are an essential part of automotive engineering. Passive suspension systems are widely used in passenger vehicles but cannot effectively suppress vehicle vibrations under different road conditions without the aid of a computer tool for the analysis of such systems. The suspension systems with two or more degrees of freedom require considerable analytical and computational effort. In order to prepare engineers to completely solve these systems numerically, the engineers must master a suitable programming environment. A proper analysis, design and control of mechanical systems can be handled by the use of software like Matlab. MATLAB (Matrix Laboratory) is a commercially available software package originally developed in the seventies by Cleve Moler, [1], for convenient numerical computations, especially matrix manipulations. Now a day, it has grown to a high-level technical computing language and interactive developing environment, for algorithm development, data visualization, data analysis, and numerical computation, widely used in the academic world and in industry [2].
The combination of analysis capabilities, flexibilities, reliability, and powerful graphics makes Matlab the most suitable software package for engineers and scientists [3]. Matlab provides an interactive environment with a lot off reliable and accurate built-in mathematical functions. These functions provide solutions to a wide range of mathematical and engineering problems such as matrix algebra, linear and nonlinear systems, etc.
In this paper, the need for Matlab as a programming tool to design and build a graphical user interface (GUI) for the analysis of car suspension system can be done using MATLAB/GUIDE environment [6].
2. Mathematical Model of Quarter Car
Suspension System
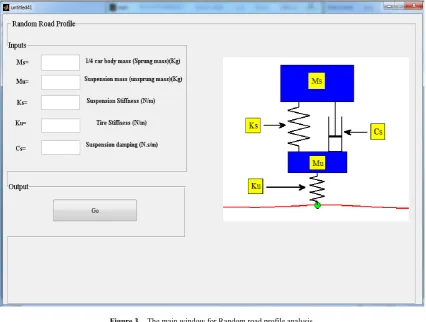
[image:1.595.340.517.595.738.2]Car suspension systems are often modeled as ideal linear system despite that real systems have nonlinear characteristics. A two degree of freedom quarter car suspension model, which is shown in Figure (1), is considered for this study. The model consists of a quarter car body and a wheel which are connected with a suspension system. The suspension system is consisted of spring and damper elements, and a wheel spring which is in contact with the road profile.
The dynamical differential equations of this model can be written as follows:
𝑚𝑚𝑠𝑠 𝑥𝑥𝑠𝑠 .. + 𝐶𝐶𝑠𝑠 (𝑥𝑥𝑠𝑠. − 𝑥𝑥𝑢𝑢.) + 𝐾𝐾𝑠𝑠 (𝑥𝑥𝑠𝑠− 𝑥𝑥𝑢𝑢) = 0
𝑚𝑚𝑢𝑢 𝑥𝑥𝑢𝑢 .. − 𝐶𝐶𝑠𝑠 (𝑥𝑥𝑠𝑠. − 𝑥𝑥𝑢𝑢.) − 𝐾𝐾𝑠𝑠 (𝑥𝑥𝑠𝑠− 𝑥𝑥𝑢𝑢) + 𝐾𝐾𝑢𝑢 (𝑥𝑥𝑢𝑢− 𝑥𝑥𝑟𝑟) = 0 (1) Where, ms represent 1/4 car body mass, and mu is the wheel mass. Ks and Ku are the linear stiffness of the suspension car body and the car tire respectively. Cs is the linear damping constant. xs, xu, and xr are the vertical displacements of the car body, wheel displacement, and road profile displacement respectively.
3. Time Response Analysis Using Matlab
The time response analysis of quarter car suspension system is carried out by using Matlab software through direct solution of the model given in equation (1). The road surfaces vary from one place to another, the road surface is sometime bumpy and some time there are ramps in it. When a car passes through these bumps and ramps the excitation input is either "step response" or "random" which leads to vertical vibration in car. The damping coefficient, the body stiffness, and the wheel stiffness can be varied from initial values to up to an optimum value to suggest the range for an optimized response.The analysis to the car suspension system described above is obtained by developing a Matlab GUI. The GUI can be used to design and study the sensitivity of the suspension system to the variation of the parameters. The GUI plot the position, velocity, and acceleration of the car and the wheel after the car hits a random or step road profiles, as well as animating the response of the suspension system.
4. Case Study and Results
An important problem is to find the value of the damping coefficient CS so that the car passengers have maximum of comfort. Passengers are sensitive to sprung mass acceleration and to frequency oscillations. In this paper, a quarter car suspension system of a Peugeot 206 passenger has been considered to the analysis using the developed GUI. The information required for the analysis is obtained from reference [7] as follows:
Ms = 1360/4 Kg Mu = 25 kg Ks = 24000 N/m Ku = 192000 N/m
Cs = 850 N.m/s
The analysis start by running a matlab script file called
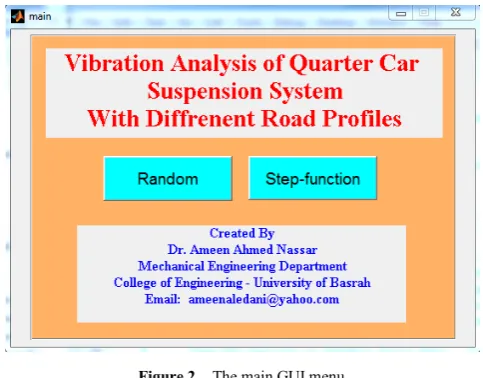
[image:2.595.310.552.111.300.2]main a popup menu will be shown as in Figure (2).
Figure 2. The main GUI menu.
The user can choose between the Random and Step-function type of response analysis. For Random analysis, by clicking on the Random push Button, the window shown in Figure (3) will appear, in which the required data for the analysis will be inserted.
Universal Journal of Mechanical Engineering 3(3): 83-93, 2015 85
[image:3.595.92.519.79.401.2]Figure 3. The main window for Random road profile analysis.
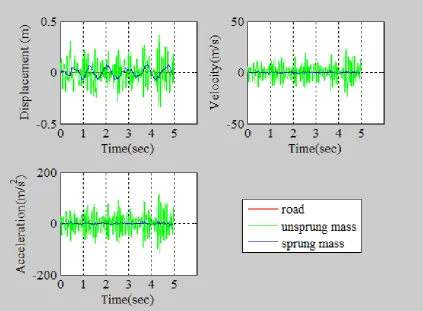
[image:3.595.91.519.341.696.2]Figure 5. Displacement, Velocity, and Acceleration Response of different points of movements of the suspension system due to Random road profile.
[image:4.595.89.510.416.732.2]Universal Journal of Mechanical Engineering 3(3): 83-93, 2015 87
Figure 5. Displacement, Velocity, and Acceleration Response of different points of movements of the suspension system due to Random road profile.
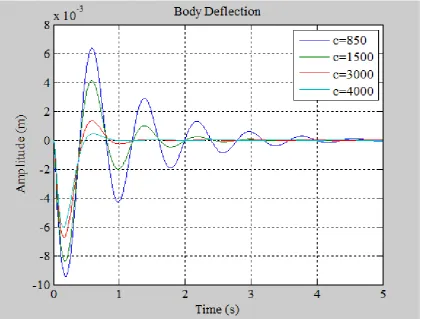
[image:5.595.84.513.419.741.2]Figure 7. Body deflection of the suspension system at different values of damping coefficient for Random road profile.
[image:6.595.93.516.423.707.2]Universal Journal of Mechanical Engineering 3(3): 83-93, 2015 89
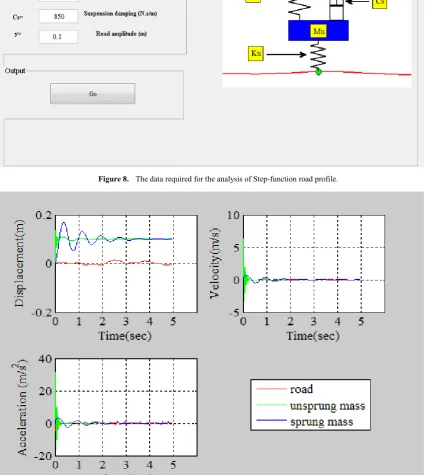
Figure 9. Displacement, Velocity, and Acceleration Response of different points of movements of the suspension system due to Step-function road profile.
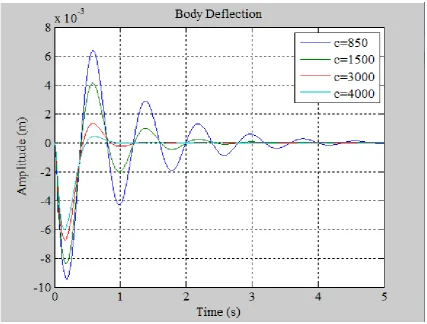
[image:7.595.88.513.407.720.2]Figure 11. Body deflection of the suspension system at different values of damping coefficient for Step-function road profile.
[image:8.595.85.513.418.742.2]Universal Journal of Mechanical Engineering 3(3): 83-93, 2015 91
Figure 8. The data required for the analysis of Step-function road profile.
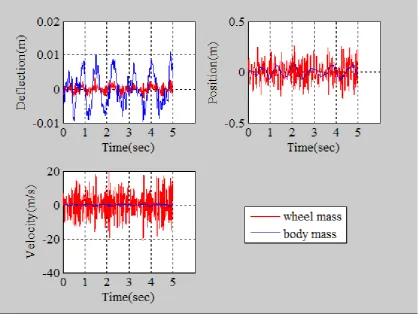
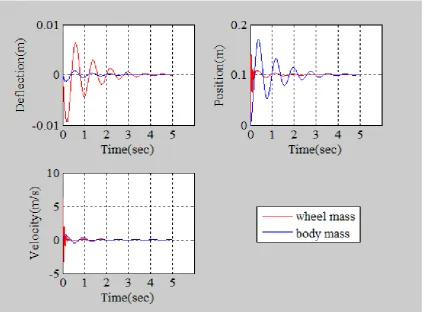
[image:9.595.86.515.191.667.2]Figure 10. Deflection, Position, and Velocity of the Wheel and Sprung masses due to Step-function road profile.
[image:10.595.91.520.412.732.2]Universal Journal of Mechanical Engineering 3(3): 83-93, 2015 93
Carrying out the same analysis using step-function road profile by clicking on the Step-function button in the main menu, Figure (2), generates a window for this analysis, similar to the window shown in Figure (3). By inserting the required data as shown in Figure (8), and hitting the Go
button, the analysis will start and the results are shown in Figures (9) and (10) respectively. These Figures shows different behaviors for the suspension system comparing with Figures (5) and (6) for random road profile. It is clear from them that the behavior of parameters such as velocity, acceleration, and deflection, which affects the comfort of the passengers, was improved for this type of road profile which is the most road profile used for the analysis and control of car suspension systems. Carrying a similar analysis by changing the damping coefficient values will produce the results shown in Figure (11). It is clear from this figure that changing the damping coefficient will change the behavior of the body deflection and a similar conclusion to figure (7) can be considered.
5. Conclusions
The main objective of this paper is to show how helpful the developed Matlab GUI to automotive engineers and designers has been achieved. The analysis of the quarter car suspension model considered in this paper simulated using displacement, velocity and acceleration response of car body
and wheel masses with different damping values are obtained. The damping characteristic of the suspension damper has to be optimized in accordance with other parameters like sprung mass, unsprung mass, tire stiffness, suspension stiffness and road input. Finally, the case study presented in this paper shows the simplicity, efficiency, reliability, of the developed GUI as an analysis tool for car suspension design.
REFERENCES
Mathworks, Inc,"Matlab User's Guide", (1991). [1]
Hingham, D. J.,"Matlab Guide", Philadelphia Society for [2]
Industrial and Applied Mathematics, (2005).
Mathworks, Inc,"MATLAB, the Language of Technical [3]
Computing", (2002).
Palm, W.J., "Concise Introduction to MATLAB", [4]
McGraw-Hill, (2008).
Sticklen, J. Taner Eskil, M., "An Introduction to Technical [5]
Problem Solving with MATLAB v. 7", 2e, Great Lakes Press,(2006).
Mathworks, Inc,"Building GUI's with MATLAB", Version 5, [6]
(1996).