© Associated Asia Research Foundation (AARF)
A Monthly Double-Blind Peer Reviewed Refereed Open Access International e-Journal - Included in the International Serial Directories.
Page | 40
APPLICATION OF BAYESIAN ESTIMATION IN ANALYZING
CONFIRMATORY FACTOR ANALYSIS MODEL OF PHYSICS
CLASSROOM PSYCHO-SOCIAL COVARIATES
Fidelis O. Nnadi (Ph.D) and Rose C Anamezie Ph.D)
Department of Science & Computer Education, Enugu State University of Science and Technology, Enugu-Nigeria.
ABSTRACT
The problem of poor achievement of students in Physics warranted the study. Researchers have linked poor Physics achievement to poor quality of instrument and Physics classroom psycho-social covariates (PCSC). The gap which this study filled was to use Bayesian estimation to reaffirm the result of exploratory factor analysis of PCSC and achievement through confirmatory factor analysis. The study adopted an instrumentation design.. The sample for the study comprised 420 SS3 Physics students sampled using random sampling from ten schools in Agbani Education zone. The instrument used to collect data included Physics classroom psycho-social covariates (PCSC) and students’ results. The alpha values of PCSC ranged between .67 to .78 for its clusters and .74 for the overall. The data collected were analyzed using regression weights, correlation and deviance information criterion values. The results indicated that the indicators of each latent construct positively loaded on them. There were moderately positive correlation between the underlying constructs. The sub-models were invariant.
International Research Journal of Human Resources and Social Sciences
ISSN(O): (2349-4085) ISSN(P): (2394-4218) Impact Factor- 5.414, Volume 5, Issue 08, August 2018
Website- www.aarf.asia, Email : [email protected] , [email protected]
© Associated Asia Research Foundation (AARF)
A Monthly Double-Blind Peer Reviewed Refereed Open Access International e-Journal - Included in the International Serial Directories.
Page | 41
KEY WORDS: Confirmatory Factor Analysis, Classroom Psycho-social covariates and Physics achievement.
Introduction
Physics is one of the core science subjects studied in secondary schools. The reason for
inclusion of Physics as a school subject is to be able to make the students adapt to an
ever-changing science and technological age. Living a life in an ever dynamic and complex age
requires the possession and use of specialized skills and tools to be able to paddle through the
turbulent waters orchestrated by the fast changing age. For instance, the knowledge gained
from Atmospheric Physics is used to debunk students’ alternative idiosyncrasies concerning
eclipses and image formation. Such questions on stars including: “Why wouldn’t the sun,
being a burning object decrease in size? and “Why doesn’t the sun fall down to the Earth?”
are provided using Physics concepts and principles. This kind of knowledge which Physics
provides helps the human inhabitants of the Earth to stop living in fear concerning the
presence of heavenly bodies which hang in space. When spotted from the surface of the
vegetative-ground below, the bodies appear as if they are falling down with a very slow
gravitational motion. Thus, their appearances provide a source of worry to the uninformed
space onlooker, in terms of feeling unsafe in the planet. Also, with the advent of spaceship
which after being lunched carries satellites into the weightless orbit of the Earth. What
hitherto was considered impossible: cordless communication became a reality. Consequently,
people are now able to talk or share information over long distances via phones and the
internet respectively. So, the possession of information and communication technology (ICT)
skills is a determinant to living a fulfilled life in a modern age. The ICT objects technically
referred to as Information Technology (IT) which consists of both the hardware and software
all depend on the principles of Physics in their making and working. Electromagnetic data
stored in tapes, flashes or compact–discs rum are used to influence the way a computer
works. In addition, transistors, diodes, capacitors, resistors, transformers, logic gates to
mention a few, whose workings obey the principles of Physics are used to make IT devices.
In fact, the principles of Physics run across the length and breadth of everyday real
© Associated Asia Research Foundation (AARF)
A Monthly Double-Blind Peer Reviewed Refereed Open Access International e-Journal - Included in the International Serial Directories.
Page | 42
experimenter to determine physical constants including mass, length of an object, the
electromotive force of a cell, focal length of a lens/mirror and the resistivity of constantan
wire without directly weighing or measuring them. The technique of indirect measurement of
physical quantities by manipulating their associated ancillary parameters to attain a balance is
alternatively investigated through linear equations, specifically the slope-intercept form to
mention a few benefits of Physics. This technique helps to ensure precision during the
manufacture of IT equipment.
In recognition of the importance of Physics to make individuals adapt to the fast
changing age, the Federal Government of Nigeria, through the Federal Ministry of Education,
FME (2011) has taken the bull by the horn in making sure that Physics is included in the
senior secondary school curriculum. The senior secondary school acts as a gateway between
Basic Science learnt in Junior secondary school and the Physics studied in tertiary institutions
of learning. However, despite the importance of Physics for the well being of individuals and
the society, the Nigerian secondary school Physics students have consistently achieved poorly
in Physics external examinations. The National Examinations Council, NECO (2014) and
West African Examinations Council, WAEC (2016) Chief Examiners’ reports in both
examination bodies attest to this claim in Physics. Physics Education researchers in a bid to
solve the problem of poor achievement in Physics examination, indicated that part of the
problem of poor achievement was attributed to the poor quality of the Physics classroom
environment (Abuh, 2014) and poor instrumentation (Nworgu, 2014).
The psycho-social climate within the Physics classroom relate to those psychological
and socially-related variables within the Physics classroom. Herbert (2004) reported that
psycho-social classroom climate influenced learning outcomes. The psycho-social variables
of Physics classroom environment including involvement, student-student interaction,
teacher-student interaction, satisfaction, task orientation, order and organization, teacher
control and innovation meaningfully influenced achievement in Physics (Abuh, 2017).
Moreover, the extent of involvement of both the students and their Physics teachers in the
classroom activities may go a long way in determining students’ success in Physics
examinations. The same is true for the extent of students’ interactions both within themselves
as well as between students and teachers alike. The satisfaction which both the students and
© Associated Asia Research Foundation (AARF)
A Monthly Double-Blind Peer Reviewed Refereed Open Access International e-Journal - Included in the International Serial Directories.
Page | 43
influencing Physics achievement. Other variables within the family of psycho-social
variables included the orientations which the students or teachers have had prior to entering
the classroom in performing certain Physics tasks in the classroom. This is perceived as the
world view of the students and teachers. The social order in the Physics classroom, and the
way the seats are arranged all contribute to Physics achievement. Teachers’ control refers to
the ability of the Physics teacher to deploy instructional strategies like use of examples
stimulus variation, planned repetition, reinforcement and questioning to make the classroom
lively. Innovations mean the Physics teachers’ ability to introduce new ideas in the
classroom.
The use of instrument with no or defective item banks to collect data is a common
practice in the school system (Nworgu & Nnadi, 2014). This kind of instrument exerts
negative influence on the students’ achievement scores. The use of instruments of poor
psychometric quality does not bring out the truly fair ability of the test takers because the
scores contain higher measurement errors including instrument errors. The few researchers
who understood the need for instrument quality and the rigorous nature of obtaining robust
instrument mainly focused on determining the psychometric quality of cognitive tests prior to
usage (). In addition, the researchers including () utilized the item response theory (IRT) to
determine the item banks of Physics objective tests. The IRT is a modern psychometric
theory which measures the item characteristics including item difficulty, discrimination,
distracter and carelessness indices as well as person or group characteristics (with respect to
the items) like differential item functioning (DIF) and differential distracter functioning
(DDF) with lower measurement error relative to the classical test theory. Under the IRT
framework, both the item and person parameters are measured without one influencing the
other.
There appears to be dearth of studies on measuring the item banks of a four-point
Physics environment scale using the IRT approach in addition to determining how the items
of the scale have clustered as a confirmatory test to exploratory factor analysis using
Bayesian estimation. Bayesian estimation adopts Gibb’s sampler, which uses Markov Chain
Monte Carlo (MCMC) algorithm, specifically Hamiltonian. From the researchers’
experience, Hamiltonian was used because of its robustness in analyzing complex models. It
© Associated Asia Research Foundation (AARF)
A Monthly Double-Blind Peer Reviewed Refereed Open Access International e-Journal - Included in the International Serial Directories.
Page | 44
factor analysis (CFA) model of psycho-social variables nested within the Physics classroom
and Physics achievement using Bayesian estimation. Put in question form, what is the
parsimonious CFA model of Physics classroom psycho-social covariates and achievement?
Purpose of the study
The purpose of the study was to determine the: (i) weights of the indicators of each sub-construct in the model (ii) correlation coefficient among the clusters of Physics
classroom environment scale and Physics achievement and (iii) invariance parameter of the
overall model.
Research Questions
Two research questions guided the study. They included (i) What are the weights of the
indicators of each sub-construct in the model? (ii). What are the correlation coefficients
among the clusters of Physics classroom environment scale and Physics achievement in the
model?
Hypothesis
The study was also guided by one null hypothesis tested at 95% confidence interval:
HO1: There is no significant difference between the constrained and unconstrained models’ deviance information criterion values based on students’ gender.
Research Method
The design of the study was instrumentation. The population for the study comprised
two thousand and twenty two (1223 female and 799 male) senior secondary three Physics
students in Agbani Education zone of Enugu state (Planning, Research & Statistics
Department, Post Primary Schools Management Board, Enugu, 2015). Simple random
sampling, specifically balloting with replacement was used to sample 10 public schools in the
education zone from where students’ sample of four hundred and twenty (420: 189 male &
231 female) was sampled. SS3 Physics students were used because their external
examinations in Physics were set by statutory examination bodies in Nigeria. The
examination bodies provide better examination questions relative to classroom teachers. The
© Associated Asia Research Foundation (AARF)
A Monthly Double-Blind Peer Reviewed Refereed Open Access International e-Journal - Included in the International Serial Directories.
Page | 45
and students results. PCSC was a 4-point rating scale. It consisted of 9 sub-scales and 36
manifest variables. The original instrument, classroom environment scale (CES) was
developed by Rudolf moos at Stanford university (Trickett & Moos, 2003). It consisted of 9
sub-scales with 41 manifest variables. Due to differential location and culture, 5 manifest
variables were dropped on the basis of having poor psychometric qualities during exploratory
factor analysis. The sub-scales included: innovation, student-student interaction,
teacher-student interaction, satisfaction and task orientation. Others included competition, order and
organization, teachers’ control and innovation. The internal consistency of the original
questionnaire (PCSC) ranged between .46 to .72 whereas the Chronbach’s alpha reliability
for the whole questionnaire items was .60. The alpha values of PCSC ranged between .67 to
.78, while the overall alpha was .74 after the trial test. Also, the confirmatory factor analysis
result of the exploratory factor analysis, obtained using maximum likelihood estimation
indicated that the correlation between the sub-scales of PCSC ranged between .119 to .693.
The values indicated that the sub-scales of PCSC positively correlated, indicating that they
measured same underlying construct (Physics classroom environment). The Physics students’
2015/2016 senior secondary school results (WAEC and NECO) formed the achievement part
of the study. Both WAEC and NECO students’ grades which were released as inverse-stenine
grades: A1, B2, B3, C4, C5, C6, D7, E8 and F9 were changed to the following points: 9, 8, 7, 6, 5, 4, 3, 2 and 1 point respectively. To ensure that the dataset had equal scale of measurement,
it was normalized using r 3.5.1 software with the aid of its scale functionality. Normalization
of the dataset set the mean of the variables to zero and their standard deviation values were
used for comparison.
The normalized dataset were exposed to exploratory factor analysis (EFA). The principal component method was adopted in extracting the factors, in addition to the use of
rotated factor solution as the display format to ensure sufficient correlation of the factors.
Factors were extracted based on ten fixed latent factors at 50 iterations. The nine latent
variables originally present in PCSC were extracted. However, only 36 manifest variables
loaded distinctly on one latent variable at a time. So, the 5 manifest variables in PCSC whose
coefficients were either below the set limit of .35 or that loaded on more than one latent
© Associated Asia Research Foundation (AARF)
A Monthly Double-Blind Peer Reviewed Refereed Open Access International e-Journal - Included in the International Serial Directories.
Page | 46
Model specification, evaluation, identification and modification. Model specification
adopted involved the use of symbols, arrows and curves to represent the manifest, latent and
error terms; directional effects and correlation/covariance matrix of the exogenous variables.
The measurement model was specified. Both the means and the variances of each construct in
the model were respectively constrained to zero and one respectively. The mean of each
latent construct was constrained to zero as a necessary pre-condition for Bayesian analysis of
the model’s structures. Also, the variance of each latent construct was constrained to one for
three reasons: (i) so that each weight of the indicator variables could be estimated. (ii) To
avoid outrageous weights, with coefficients above 1.00. (iii) To avoid very low correlation
coefficients occasioned by outrageous weights. Model constraints including configural
invariance (the same factor loading in each sub-group model was equated to 1), metric
invariance (configural invariance + setting all the other factor loadings in each subgroup to be
equal) and structural invariance (metric invariance + setting all the covariance curves to be
equal across the subgroups) testing were done to determine the equivalence of urban and rural
sub-group models in producing a unified model. The data were loaded and the models’
parameters were initially estimated using maximum likelihood (ML) to help diagnose
estimation problems. The model did not run, despite that it was identified. An error massage
(waiting to accept a transition before beginning burn-in) cropped up. Arbuckle (2013) noted
that such an error massage usually cropped up when the maximum likelihood estimate was
inadmissible as a result of having a check mark placed on admissibility test on the prior tab of
the Bayesian structural equation modeling (SEM) options window. The problem was
overcome by unchecking the admissibility test button, so that the computer programme could accept the first MCMC candidate. Then the model ran. So all the coefficients of the
directional effects were reasonable (had linear coefficients ranging from -1 through 0 to 1).
See appendix …….,page…… for the full posterior estimates. The final estimation of the
measurement model was done using Bayesian MCMC algorithm, specifically Hamiltonian.
Hamiltonian algorithm was chosen because it saved computational time relative to random-walk algorithm. During the MCMC sampling process of both the posterior parameter values and the MCMC sample-size, the prior distribution of each parameter was set to normal
probability distribution. The reason was to reduce the model parameters’ computation
© Associated Asia Research Foundation (AARF)
A Monthly Double-Blind Peer Reviewed Refereed Open Access International e-Journal - Included in the International Serial Directories.
Page | 47
the convergence criteria (1.002) was maintained. However, the sampling process was pulsed
when the parameter values appeared to be stable.
Results
The results are presented according to the formulated research questions and hypotheses
that guided the study.
Research question 1 (RQ1) sought information on the weights of the indicators of each
sub-construct in the model. The data presented in Table 1 were used to answer RQ1.
Table1: Regression weights with standard error (SE) of the indicators of each construct in the model
REGRESSION WEIGHTS
MEAN SE
REGRESSION WEIGHTS
MEAN
SE
INVOLV1<--INV 0.25 0.00 TASKOR4<--TAS 0.21 0.00
INVOLV2<--INV 0.37 0.00 COMPET1<--COM 0.39 0.00
INVOLV4<--INV 0.32 0.00 COMPET2<--COM 0.27 0.00
SSINTER1<--SSI 0.16 0.00 COMPET3<--COM 0.26 0.00
SSINTER2<--SSI 0.28 0.00 COMPET4<--COM 0.17 0.00
SSINTER3<--SSI 0.43 0.00 COMPET5<--COM 0.26 0.00
SSINTER5<--SSI 0.17 0.00 ODORGA2<--ODO 0.15 0.00
SSINTER6<--SSI 0.21 0.00 ODORGA3<--ODO 0.23 0.00
TSINTER1<--TSI 0.35 0.00 ODORGA4<--ODO 0.20 0.00
TSINTER3<--TSI 0.14 0.00 ODORGA5<--ODO 0.32 0.00
TSINTER4<--TSI 0.15 0.00 TCONTRL1<--TCO 0.18 0.00
SATISFA1<--SAT 0.29 0.00 TCONTRL2<--TCO 0.23 0.00
SATISFA2<--SAT 0.08 0.00 TCONTRL4<--TCO 0.15 0.00
SATISFA3<--SAT 0.30 0.00 INNOVAT1<--INN 0.28 0.00
SATISFA4<--SAT 0.27 0.00 INNOVAT3<--INN 0.40 0.00
TASKOR1<--TAS 0.23 0.00 INNOVAT4<--INN 0.22 0.00
TASKOR2<--TAS 0.14 0.00 WAEC<--PHYACHV 0.24 0.00
TASKOR3<--TAS 0.19 0.00 NECO<--PHYACHV 0.13 0.00
From Table 1, Involvement (INVOLV) 1, 2 and 4 loaded on the construct involvement
(INV) with the following weights: .25, .37 and .32 respectively. Student-student interaction
(SSINTER) 1, 2, 3, 5 and 6 loaded on student-student interaction (SSI) with the following
weights: .16, .28, .43, .17 and .21 respectively. Teacher-student interaction (TSINTER) 1, 3
© Associated Asia Research Foundation (AARF)
A Monthly Double-Blind Peer Reviewed Refereed Open Access International e-Journal - Included in the International Serial Directories.
Page | 48
of satisfaction (SAT) including SATISFA1, SATISFA2, SATISFA3 and SATISFA4 loaded
on it with the following weights: .29, .08, .30 and .27 respectively. The indicators of task
orientation (TAS) including TASKOR1, TASKOR2, TASKOR3 and TSAKOR4 had .23, .14,
.19 and .21 as their weights on the construct respectively. The indicators of competition
(COM) including COMPET1, COMPET2, COMPET3, COMPET4 and COMPET5 had their
weights as .39, .27, .26, .17 and .26 respectively. Other sub-constructs in the confirmatory
factor analysis model including order and organization (ODO) had its indictor weights
including ODORGA2, ODORGA3, ODORGA4, ODORGA5, loaded as .15, .23, .20 and .32
respectively. While the manifest variables due to the sub-construct- teachers’ control
including TCONTRL1, TCONTRL2 and TCONTRL4 had their weights as .18, .23 and .15
respectively. The indicators of innovations (INN) including INNOVAT1, INNOVAT3 and
INNOVAT4 loaded unto the underlying construct with the following weights: .28, .40 and
.22 respectively. However, WAEC and NECO loaded on Physics achievement (PHYACHV)
with the following weights: .22 and .24 respectively.
Research question 2 (RQ2) sought information on the correlation coefficients among
the clusters of Physics classroom environment scale and Physics achievement in the model.
The trace plots in figure 2 were used to answer RQ2.
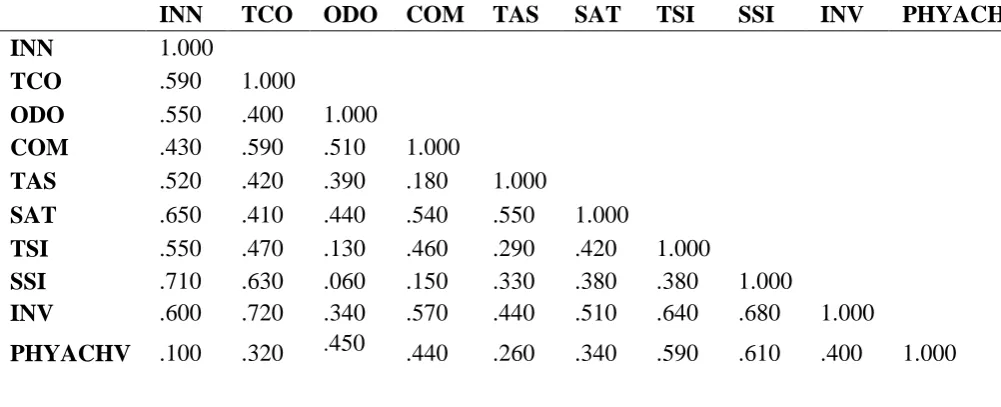
Table 2: Correlation coefficients of the sub-constructs of Physics classroom environment.
INN TCO ODO COM TAS SAT TSI SSI INV PHYACHV
INN 1.000
TCO .590 1.000
ODO .550 .400 1.000
COM .430 .590 .510 1.000
TAS .520 .420 .390 .180 1.000
SAT .650 .410 .440 .540 .550 1.000
TSI .550 .470 .130 .460 .290 .420 1.000
SSI .710 .630 .060 .150 .330 .380 .380 1.000
INV .600 .720 .340 .570 .440 .510 .640 .680 1.000
[image:9.595.67.568.488.691.2]© Associated Asia Research Foundation (AARF)
A Monthly Double-Blind Peer Reviewed Refereed Open Access International e-Journal - Included in the International Serial Directories.
Page | 49
From Table 2, the bi-variate correlation between the sub-constructs of Physics
classroom environment and Physics achievement in the model are reported as follows.
Innovations (INN) had a coefficient of .59 with teacher’s control (TCO), .55 with order and
organization (ODO), .43 with communications (COM). Task orientation (TAS) had .52,
satisfaction (SAT) had .65, teacher-student interaction (TSI) had.55,student-student
interaction (SSI) had .71, involvement (INV) had .60 while Physics achievement
(PHYACHV) had a correlation coefficient of .10 with INN. TCO had a coefficient of .4,
.59,.42, .41, .47, .63, .72 and .32 with ODO, COM, TAS, SAT, TSI, SSI, INV and
PHYACHV respectively. The correlation between ODO and COM, , SAT, TSI, SSI, INV and
PHYACHV included .51, .39, .44, .13, .06, .34 and .45 respectively. COM correlated with
TAS, SAT, TSI, SSI, INV and PHYACHV with coefficients of .18, .54, .46, .15,.57 and .44
respectively. TAS had correlation coefficients of .55,.29, .33, .44 and .26 with SAT, TSI,
SSI, INV and PHYACHV respectively. Also, SAT had coefficients of .42, .38,.51 and .34
with TSI, SSI, INV and PHYACHV respectively. TSI correlated with SSI, INV and
PHYACHV and had .38, .64 and .59 as indices of correlation respectively. SSI had
correlation of .68 and .61 with INV and PHYACHV respectively. In addition, the coefficient
of correlation between INV and PHYACHV was .40.
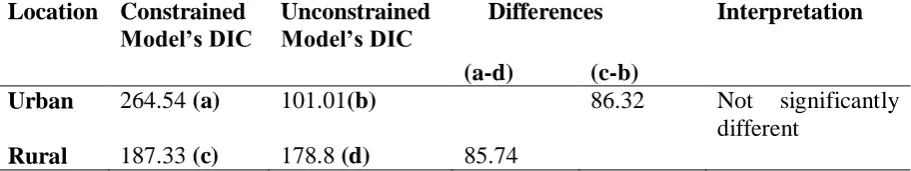
Hypothesis 1 (Ho1) sought to determine if any significant difference existed between the constrained and unconstrained models’ deviance information criterion values based on students’ gender. The data presented in Table 3 were used to test the hypothesis.
Table 3: Deviance information criterion (DIC) values of the constrained and unconstrained urban and rural sub-models tested at 95% confidence interval. Location Constrained
Model’s DIC Unconstrained Model’s DIC Differences Interpretation (a-d) (c-b)
Urban 264.54 (a) 101.01(b) 86.32 Not significantly
[image:10.595.78.534.623.708.2]© Associated Asia Research Foundation (AARF)
A Monthly Double-Blind Peer Reviewed Refereed Open Access International e-Journal - Included in the International Serial Directories.
Page | 50
From Table 3, the sub-model for urban Physics students had a constrained model’s
DIC value of 264.54 while the rural sub-model had a DIC value of 187.33. For the
unconstrained models, the urban model had a DIC value of 101.01 whereas the rural
sub-model had a DIC value of 178.80. The difference between constrained and unconstrained
urban and rural models is 85.74, while the difference between the constrained and
unconstrained rural and urban models is 68.32. This implies that the urban and rural
sub-models are equivalent.
Discussion of Findings
The results in Table 1 provided answer to the research question 1. Out of the nine sub-scales of Physics classroom environment questionnaire, the highest positive direct effect on
the criterion variable was the path from student-student interaction. The next sub-scales in
decreasing magnitude of meaningful paths included order and organization, teacher-student
interaction and competitions. However, teacher satisfaction and task orientation had weak
and positive direct effects on the criterion variable. Other variables including teachers’
control, involvement and innovations had negative direct effects on the criterion variable.
Teachers’ control had the highest negative direct effect on Physics achievement. Involvement
followed and innovation was the least. The weighted path coefficient from involvement and
teachers’ control to Physics achievement varied slightly by -.01 each. All the other weighted
paths did not vary from the estimated path coefficients. The implication for the result is that
MCMC based approach to parameter estimation provides reliable estimates due to the fact
that it records very low standard error of estimates. From the Table 1, it becomes apparent
that the level of students satisfaction and task orientation in the population is low and needs
improvement. Other clusters of Physics classroom environment scale that needs serious
intervention included the ones with negative direct effects in the model. They are paths from
involvement, teachers’ control and innovation. However the statuesque should be maintained
for student-student interaction, teacher-student interaction, communication and order and
organization within the Physics classroom.
From Table 2, the difference between the constrained male and unconstrained
female models was positive. Also, the difference between the constrained female and
unconstrained male models was positive. This shows that the sub-group models were
© Associated Asia Research Foundation (AARF)
A Monthly Double-Blind Peer Reviewed Refereed Open Access International e-Journal - Included in the International Serial Directories.
Page | 51
Nesselroade, and Grimm (2007). The authors noted that sub-group models’ equivalence was
achieved when the DIC of the constrained model was higher than the DIC value of the
unconstrained model.
Recommendation
Based on the findings of this study the following recommendation is made. Researchers in
Physics Education should avail themselves of the opportunity to use Physics classroom
environment rating scale to collect data, since it has been adjudged psychometrically fit to
use.
References
Abuh, P.Y. (2014). Psychosocial factors of classroom environment and cognitive styles as
correlates of students’ achievement in Physics. Unpublished M SCED Dissertation. Department of Science Education, University of Nigeria, Nsukka,
http://repository.unn.edu.ng:8080/jspui/bitstream/123456789/1845/1/Peter%20Yakubu
%20Abuh.pdf
American Statistical Association, ASA (2016). American Statistical Association releases statement on statistical significance and p-values. https://www.amstat.org/asa/files/pdfs/P-ValueStatement.pdf
Australian National Research Council, (2001). Physics in a new era: An overview. Washington, D.C: National Academy of Sciences.
Bayes, T.(Read 1763). An Essay towards solving a Problem in the Doctrine of Chances. By
the late Rev. Mr. Bayes, communicated by Mr. Price, in a letter to John Canton, M. A.
and F. R. S. http://www.stat.ucla.edu/history/essay.pdf
Ben, F. (2010). Students’ uptake of Physics: A study of South Australian and Filipino
Physics students. Unpublished Ph.D Thesis, School of Education, Faculty of the Professions, University of Adelaide, Australia. https://digital.library.adelaide.edu.au
Federal Ministry of Science and Technology, FMS & T (2012). Science, Technology and innovation Policy 2012. https://www.scienceandtech.gov.ng›docs›ST
© Associated Asia Research Foundation (AARF)
A Monthly Double-Blind Peer Reviewed Refereed Open Access International e-Journal - Included in the International Serial Directories.
Page | 52
Herbert, L.R. (2004). Psychological climate: Dimensions and relationships of individual and
aggregated work environment perceptions. Organizational behaviour and human performance 23, 201-250.
National Business and Technical Examinations Board (NABTEB) (2010),
National Examinations Council (NECO) (2017)
Nnadi, F.O. (2017). Application of Bayesian causal modeling estimation technique in
analysis of calibrated non-cognitive variables promoting achievement in Physics.
Unpublished Ph.D Thesis, Department of Science Education, Faculty of Education, University of Nigeria, Nsukka.
Nworgu, B .G. (2016). Averting pedagogical failure in science: Insights from educational measurement and evaluation. 103rd Inaugural Lecture of the University of Nigeria, Nsukka delivered on Thursday, February 25.
Trickett, E.J. and Moos, R.H. (2003). Classroom environment scale manual (2nded) Palo Alto. California: Consultancy psychologist press.
Nworgu, B. G., & Nnadi, F. O. (2017). Path analytic modeling of students’ family
background variables on secondary school students’ academic achievement in Physics
using Bayesian estimation technique. Nigerian Journal of Educational Research and Evaluation, 16 (1), 13-24. www.asseren.org.ng
Sharma, S. (2017). Markov Chain Monte Carlo Methods for Bayesian data analysis in
Astronomy. Annual Review of Astronomy and Astrophysics, 55, 1-49.
The United Kingdom Institute of Physics (2003). The importance of Physics in the UK economy: Summary and highlights. http://www.iop.org/activity./Publications
Weiman, C.,& Perkins, H. (2006). Transforming Physics Education. Physics Today, 58(11), 36-41,
West African Examinations Council, WAEC (2012). Chief Examiner’s Report. Lagos: WAEC
Zang, Z., Hamagami, F.,Wang, L., Nesselroade,J. R.,& Grimm., K. J. (2007). Bayesian
© Associated Asia Research Foundation (AARF)
A Monthly Double-Blind Peer Reviewed Refereed Open Access International e-Journal - Included in the International Serial Directories.
Page | 53
Appendix A: Full Posterior Summaries of Estimates.
Mean S.E. S.D. C.S. Median
95% Lower bound
95% Upper bound
Skewn
ess Kurtosis Min Max Name
Regression weights
© Associated Asia Research Foundation (AARF)
A Monthly Double-Blind Peer Reviewed Refereed Open Access International e-Journal - Included in the International Serial Directories.
Page | 54
ODORGA4<--ODO 0.20 0.00 0.02 1.01 0.20 0.17 0.24 0.09 -0.43 0.15 0.26 ODORGA5<--ODO 0.32 0.00 0.02 1.01 0.32 0.29 0.37 0.28 -0.11 0.27 0.39 TCONTRL1<--TCO 0.18 0.00 0.02 1.00 0.18 0.13 0.23 0.14 -0.10 0.11 0.27 TCONTRL2<--TCO 0.23 0.00 0.02 1.01 0.23 0.19 0.27 0.28 0.07 0.17 0.32 TCONTRL4<--TCO 0.15 0.00 0.02 1.01 0.15 0.12 0.19 0.10 -0.05 0.10 0.23 INNOVAT1<--INN 0.28 0.00 0.02 1.01 0.28 0.24 0.33 0.18 -0.33 0.22 0.35 INNOVAT3<--INN 0.40 0.00 0.02 1.01 0.40 0.35 0.45 0.04 -0.23 0.32 0.48 INNOVAT4<--INN 0.22 0.00 0.02 1.01 0.22 0.18 0.25 0.09 -0.35 0.16 0.28
WAEC<--PHYACHV 0.24 0.00 0.02 1.01 0.24 0.20 0.29 0.77 1.02 0.18 0.33 NECO<--PHYACHV 0.13 0.00 0.01 1.01 0.13 0.11 0.15 0.81 1.47 0.10 0.17
Intercepts
© Associated Asia Research Foundation (AARF)
A Monthly Double-Blind Peer Reviewed Refereed Open Access International e-Journal - Included in the International Serial Directories.
Page | 55
ODORGA3 2.63 0.00 0.02 1.00 2.63 2.59 2.66 -0.02 -0.50 2.57 2.68 ODORGA4 2.41 0.00 0.02 1.01 2.41 2.37 2.44 0.00 -0.32 2.35 2.47 ODORGA5 2.41 0.00 0.03 1.01 2.41 2.36 2.45 -0.05 -0.41 2.32 2.48 TCONTRL1 2.65 0.00 0.03 1.00 2.65 2.60 2.70 0.13 -0.12 2.58 2.76 TCONTRL2 2.61 0.00 0.02 1.01 2.61 2.57 2.66 0.18 -0.36 2.53 2.69 TCONTRL4 2.47 0.00 0.02 1.00 2.47 2.43 2.51 -0.03 -0.01 2.40 2.54 INNOVAT1 2.48 0.00 0.03 1.00 2.48 2.42 2.52 -0.11 -0.28 2.39 2.56 INNOVAT3 2.51 0.00 0.03 1.00 2.51 2.44 2.57 -0.11 0.01 2.40 2.63 INNOVAT4 2.48 0.00 0.02 1.00 2.48 2.43 2.52 -0.28 -0.07 2.41 2.54 WAEC 2.47 0.00 0.02 1.01 2.48 2.43 2.52 -0.18 -0.20 2.39 2.54 NECO 2.30 0.00 0.01 1.01 2.30 2.28 2.32 -0.09 -0.49 2.27 2.34
Covariances
© Associated Asia Research Foundation (AARF)
A Monthly Double-Blind Peer Reviewed Refereed Open Access International e-Journal - Included in the International Serial Directories.
Page | 56
SAT<->INN 0.65 0.01 0.07 1.01 0.66 0.52 0.77 -0.29 -0.14 0.42 0.85 TAS<->COM 0.18 0.01 0.07 1.01 0.18 0.03 0.32 -0.19 0.19 -0.11 0.42 TAS<->ODO 0.39 0.01 0.08 1.00 0.39 0.23 0.55 -0.03 -0.07 0.12 0.62 TAS<->TCO 0.42 0.01 0.08 1.00 0.43 0.26 0.58 -0.15 -0.25 0.14 0.68 TAS<->INN 0.52 0.01 0.06 1.00 0.52 0.40 0.64 0.02 -0.30 0.33 0.71 COM<->ODO 0.51 0.01 0.06 1.01 0.51 0.38 0.63 -0.18 -0.13 0.30 0.68 COM<->TCO 0.59 0.01 0.07 1.01 0.59 0.44 0.72 -0.24 0.11 0.32 0.81 COM<->INN 0.43 0.01 0.07 1.01 0.43 0.27 0.55 -0.35 0.09 0.19 0.62 ODO<->TCO 0.40 0.01 0.08 1.01 0.40 0.25 0.54 -0.22 0.42 0.10 0.64 ODO<->INN 0.50 0.01 0.06 1.01 0.51 0.37 0.62 -0.40 0.59 0.24 0.70 TCO<->INN 0.59 0.01 0.07 1.01 0.59 0.45 0.72 -0.46 0.93 0.24 0.79 PHYACHV<->INV 0.40 0.01 0.08 1.01 0.41 0.23 0.55 -0.29 -0.25 0.16 0.62 PHYACHV<->SSI 0.61 0.01 0.06 1.01 0.62 0.47 0.72 -0.75 1.29 0.34 0.77 PHYACHV<->TSI 0.59 0.01 0.07 1.01 0.59 0.43 0.72 -0.35 0.11 0.33 0.81 PHYACHV<->SAT 0.34 0.01 0.09 1.01 0.34 0.16 0.51 -0.07 -0.01 0.04 0.67 PHYACHV<->TAS 0.26 0.01 0.08 1.01 0.25 0.10 0.42 0.10 -0.01 0.01 0.56 PHYACHV<->COM 0.44 0.01 0.07 1.01 0.44 0.30 0.58 -0.12 -0.24 0.20 0.65 PHYACHV<->ODO 0.45 0.01 0.07 1.01 0.45 0.31 0.59 -0.11 -0.14 0.20 0.67 PHYACHV<->TCO 0.32 0.01 0.10 1.01 0.33 0.11 0.51 -0.39 0.40 -0.09 0.62 PHYACHV<->INN 0.10 0.01 0.09 1.01 0.10 -0.08 0.26 -0.15 -0.22 -0.18 0.35
Variances
e1 0.05 0.00 0.01 1.01 0.05 0.04 0.06 0.28 -0.11 0.04 0.07
e2 0.06 0.00 0.01 1.00 0.06 0.05 0.08 0.55 0.79 0.04 0.09
e4 0.03 0.00 0.00 1.00 0.03 0.03 0.04 0.28 0.10 0.02 0.04
e6 0.26 0.00 0.02 1.00 0.25 0.22 0.30 0.19 -0.04 0.18 0.33
e7 0.03 0.00 0.00 1.00 0.03 0.02 0.03 0.32 -0.18 0.02 0.03
e8 0.06 0.00 0.01 1.01 0.06 0.05 0.07 0.39 0.08 0.04 0.08
e10 0.03 0.00 0.00 1.01 0.03 0.03 0.04 0.53 0.36 0.02 0.05
e11 0.03 0.00 0.00 1.01 0.03 0.02 0.03 0.19 -0.35 0.02 0.03
e12 0.19 0.00 0.02 1.01 0.19 0.15 0.24 0.42 0.06 0.13 0.27
e13 0.02 0.00 0.00 1.01 0.02 0.02 0.02 0.38 -0.37 0.01 0.03
e15 0.13 0.00 0.02 1.01 0.13 0.10 0.16 0.32 0.19 0.08 0.19
e16 0.06 0.00 0.01 1.01 0.06 0.05 0.08 0.40 -0.21 0.04 0.09
e17 0.03 0.00 0.00 1.01 0.03 0.02 0.04 0.34 -0.01 0.02 0.04
e18 0.02 0.00 0.00 1.00 0.02 0.02 0.03 0.32 0.13 0.01 0.03
e19 0.02 0.00 0.00 1.00 0.02 0.02 0.03 0.10 -0.04 0.01 0.04
© Associated Asia Research Foundation (AARF)
A Monthly Double-Blind Peer Reviewed Refereed Open Access International e-Journal - Included in the International Serial Directories.
Page | 57
e21 0.06 0.00 0.01 1.01 0.06 0.05 0.07 0.18 -0.01 0.04 0.08
e22 0.02 0.00 0.00 1.00 0.02 0.02 0.02 0.19 -0.09 0.01 0.03
e23 0.04 0.00 0.00 1.01 0.04 0.03 0.05 0.23 -0.30 0.03 0.05
e24 0.07 0.00 0.01 1.00 0.07 0.06 0.08 0.37 0.18 0.05 0.10
e25 0.06 0.00 0.01 1.01 0.06 0.05 0.07 0.33 0.47 0.04 0.08
e26 0.03 0.00 0.00 1.00 0.03 0.02 0.03 0.41 0.14 0.02 0.04
e27 0.03 0.00 0.00 1.01 0.03 0.02 0.04 0.47 0.19 0.02 0.04
e28 0.02 0.00 0.00 1.00 0.02 0.02 0.03 0.39 -0.09 0.01 0.03
e29 0.11 0.00 0.01 1.00 0.10 0.09 0.13 0.56 0.31 0.08 0.15
e30 0.05 0.00 0.01 1.00 0.05 0.04 0.07 0.22 -0.12 0.04 0.08
e31 0.05 0.00 0.01 1.01 0.05 0.04 0.06 1.15 2.68 0.04 0.08
e32 0.06 0.00 0.01 1.00 0.06 0.05 0.07 0.15 -0.15 0.05 0.08
e33 0.06 0.00 0.01 1.00 0.06 0.05 0.07 0.18 0.23 0.04 0.07
e34 0.05 0.00 0.00 1.00 0.05 0.05 0.06 0.32 0.12 0.04 0.07
e3 0.02 0.00 0.00 1.01 0.02 0.01 0.03 -0.09 0.00 0.01 0.03
e9 0.26 0.00 0.02 1.00 0.26 0.22 0.30 0.18 -0.11 0.20 0.33
e5 0.05 0.00 0.00 1.00 0.05 0.04 0.06 0.42 0.21 0.04 0.06
e14 0.10 0.00 0.01 1.00 0.10 0.07 0.13 0.28 0.31 0.06 0.14
e35 0.05 0.00 0.01 1.01 0.05 0.04 0.06 0.60 0.39 0.03 0.07
e36 0.01 0.00 0.00 1.01 0.01 0.01 0.01 0.54 0.58 0.01 0.01
© Associated Asia Research Foundation (AARF)
A Monthly Double-Blind Peer Reviewed Refereed Open Access International e-Journal - Included in the International Serial Directories.
Page | 58