Factors Affecting the Validity of Self-Reported Data on Health
Services from the Community Health Survey in Korea
Hyeongsu Kim
,
1Kunsei Lee
,
1Sounghoon Chang
,
1Gilwon Kang
,
2Yangju Tak
,
3Minjung Lee
,
1Vitna Kim
,
1Junghyun Lee
,
1and Hyoseon Jeong
11Department of Preventive Medicine, School of Medicine, Konkuk University, Seoul;
2Department of Health Informatics and Management, College of Medicine, Chungbuk National University, Cheongju; 3Department of Paramedic Science, College of Health & Life Science, Korea National University of Transportation, Cheongju, Korea.
Received: August 16, 2012 Revised: September 20, 2012 Accepted: September 27, 2012 Corresponding author: Dr. Kunsei Lee, Department of Preventive Medicine, School of Medicine, Konkuk University, 263 Achasan-ro, Gwangjin-gu, Seoul 143-701, Korea.
Tel: 82-2-2030-7817, Fax: 82-2-2049-6192 E-mail: kunsei.leel@kku.ac.kr
∙ The authors have no financial conflicts of interest.
© Copyright:
Yonsei University College of Medicine 2013 This is an Open Access article distributed under the terms of the Creative Commons Attribution Non-Commercial License (http://creativecommons.org/ licenses/by-nc/3.0) which permits unrestricted non-commercial use, distribution, and reproduction in any medium, provided the original work is properly cited.
Purpose: As a follow-up for the validity study of Community Health Surveys (CHSs), the purpose of this study was to evaluate the factors affecting the accuracy of CHSs by investigating subjects’ characteristics. Materials and Methods: We used data from 11,217 participants (aged 19 years or older) who had participated in the CHS, conducted by a local government in 2008 and analyzed the variables affecting the sensitivity and specificity of hospitalization and outpatient visit. Re-sults: Multivariate logistic regression analysis showed that, factors related with the sensitivity of hospitalization and outpatient visit questions were gender, age, mari-tal status, chronic diseases, medical checkup, the subjective health status and nec-essary medical services. Factors related with the specificity were gender, marital status, educational background, chronic diseases, medical checkup, alcohol con-sumption, necessary medical services and sadness. Conclusion: This study re-vealed the subject-related factors associated with the validity of the CHS. Efforts to improve the sensitivity and the specificity from self-report questionnaires should consider how the characteristics of subjects may affect their responses.
Key Words: Validity, self-reported, healthcare utilization, community health survey
INTRODUCTION
Self-administered questionnaires are among the approaches used to examine the current status of public health, including health behaviors, healthcare utilization, disease prevalence, and so on. Despite the ease with which this method acquires data, especially in situations in which more objective records are inaccessible or unavailable,1 this approach is limited by its dependence on the subjectivity of
re-sponses, which may detract from the accuracy of information collected. Indeed, the accuracy of data obtained via self-report questionnaires is relatively low com-pared with that gathered from either medical records or insurance claims.2-4
the Health Insurance Review and Assessment Service (HIRA) included the reported contacts. When citizens visit a healthcare institution in Korea, the healthcare institution sends claims for insurance benefits to HIRA, unless the pa-tient is covered by workers’ compensation or car insurance or is not insured. Next, using the patient’s resident registra-tion number, the CHS data are merged with those related to the insurance claim submitted to HIRA.
Establishment of variables
Definition of dependent variables
We defined the information contained in the claim for insur-ance benefits submitted to HIRA as the true rates of health-care-services utilization. In terms of dependent variables, it was assumed that healthcare services were utilized when a respondent had been hospitalized within the last year or vis-ited a healthcare institution as outpatient within 2 weeks of completing the questionnaire. We defined the sensitivity of each question as the rate at which individuals with insur-ance claims self-reported utilization of CHS services. The specificity of each question was defined as the rate at which those who claimed not to utilize healthcare services did not use such services according to the HIRA data.
Definition of independent variables
Validity-related variables included personal demographic characteristics, chronic diseases, health behaviors, and sub-jective health assessments. Personal characteristics includ-ed gender, age, includ-educational background, marital status, and type of insurance. Educational background was divided into four categories according to duration of education. Marital status was categorized as “single”, “living with spouse after marriage”, and “living without spouse after marriage”. In-surance was divided into “health inIn-surance” and “public medical aid”. Chronic disease, the actual presence of which was identified by a doctor’s diagnosis, included hyperten-sion, diabetes, myocardial infarction, stroke, and (osteo- or rhematoid) arthritis. Health behavior was categorized as getting a “medical checkup” within 2 years of the date of the survey, smoking, and alcohol consumption. Subjective health assessments were based on the following three ques-tions: 1) “What do you think of your usual health? (Subjec-tive health status)”. Responses included (very) good, fair, and (very) poor. 2) “During the past year, have you ever been unable to obtain medical services when you needed them? (Necessary medical services)”. Respondents provid-year. Now, CHSs’ scale such as subjects, and cost etc. is
bigger than the Korean National Health and Nutrition Ex-amination Survey (KNHANES). In order that the results of CHSs are used as evidence for establishing and evaluating diverse local public health projects, it is necessary for CHSs to achieve a certain level of accuracy and to identify what factors affect the validity.
To-date, the only study of the validity of CHSs was per-formed by Rim, et al.5 Though this research revealed that
CHSs have a certain level of sensitivity and specificity for healthcare utilization, such as rates of hospitalization and outpatient visits, it didn’t show what factors are related with the sensitivity and the specificity. The sensitivity and speci-ficity of questionnaires on healthcare utilization depend on subjects’ knowledge and understanding of the relevant in-formation, their ability to recall this inin-formation, and their willingness to report it.6 As a follow-up for the validity study
of CHSs with the same data, we evaluated the factors af-fecting the accuracy of CHSs by investigating subjects’ characteristics.
MATERIALS AND METHODS
Study data and subjects
This study included 11,217 Korean citizens. Of an initial sample consisting of the 12,449 respondents (aged 19 or older) who had participated in the CHS conducted by a lo-cal government in 2008, we excluded 1,206 individuals who refused to allow inclusion of their data in the relevant national statistics (e.g., health insurance, mortality data, etc.) maintained by other organizations and 26 individuals with problems with resident registration numbers who did allow their data to be used for these purposes. The 2008 CHS was conducted from August to October.
Methods
Reconfiguration of data for evaluation of accuracy
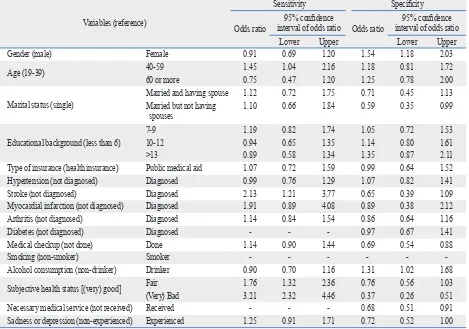
the OR for the sensitivity of the hospitalization in 40-59 years of age, compared to 19-39 years of age, was 1.45 (95% CI, 1.04-2.16). The OR for respondents who had suf-fered a stroke, compared to those who had not, was 2.13 (95% CI, 1.21-3.77). Compared to those who rated their health as (very) good, respondents who rated their health as fair or (very) bad showed an OR for the sensitivity of the hospitalization of 1.76 (95% CI, 1.32-2.36) or 3.21 (95% CI, 2.32-4.46) (Table 2). The OR for the specificity of the hospitalization in females compared to males was 1.54 (95% CI, 1.18-2.03), and the OR of those living without their spouse to single respondents was 0.59 (95% CI, 0.35-0.99). Additionally, the OR of those who had received a medical checkup to those who had not was 0.69 (95% CI, 0.54-0.88) and the OR for the specificity of the hospitaliza-tion in those who consumed alcohol compared to those who did not was 1.31 (95% CI, 1.02-1.68). Furthermore, the OR of those who had received necessary medical ser-vices to those who had not was 0.68 (95% CI, 0.51-0.91).
Factors related to the sensitivity and specificity of the outpatient visit
The sensitivity and specificity of the outpatient visit and the factors related to the sensitivity and the specificity of the outpatient visit are shown in Table 3. The sensitivity and specificity were 52.1% and 85.6%, respectively. In the uni-variate analysis on the factors related to the sensitivity of the outpatient visit, gender, age group, marital status, education-al background, type of insurance, hypertension, stroke, myocardial infarction, arthritis, diabetes, medical checkup, alcoholic consumption, subjective health status, necessary medical service and sadness had the statistical significance with p values <0.20. And in the univariate analysis on the factors related to the specificity of the outpatient visit, gen-der, age group, marital status, educational background, type of insurance, hypertension, stroke, myocardial infarction, arthritis, diabetes, medical checkup, smoking, alcoholic consumption, subjective health status, necessary medical service and sadness had the statistical significance with p values <0.20.
According to the multivariate logistic regression analysis, the OR for the sensitivity of outpatient visits in females compared to males was 1.21 (95% CI, 1.03-1.43) and the OR of those living without their spouse to single dents was 1.41 (95% CI, 1.02-1.95). The OR for respon-dents who had suffered arthritis or diabetes compared to those who had not was 1.61 (95% CI, 1.35-1.94) or 1.49 ed yes/no answers to this question. 3) “Have you ever
expe-rienced a sad or depressed mood that was serious enough to cause problems in your daily routine that lasted more than 2 consecutive weeks during the past year? (Sadness)”. This question was also answered “yes” or “no”.
Data analysis
SAS, version 9.2 (SAS Institute Inc., Cary, NC, USA), was used to analyze the data, and significance was set at a value of p<0.05. We performed a frequency analysis to ascertain the relationship between dependent and independent vari-ables. Next, the initial logistic regression model comprised all variables which showed a p value at least <0.20 in the chi-square test, so that all possibly significantly contribut-ing variables will not be missed. The results yielded the odds ratios (ORs) of variables associated with sensitivity and specificity at the 95% confidence interval (CI).
Ethics statement
This study was reviewed and approved by the Institutional Review Boards of Konkuk University Hospital (approval number: KUH1230005). We received informed consents from all the participants in the interview survey.
RESULTS
Factors related to the sensitivity and specificity of the hospitalization
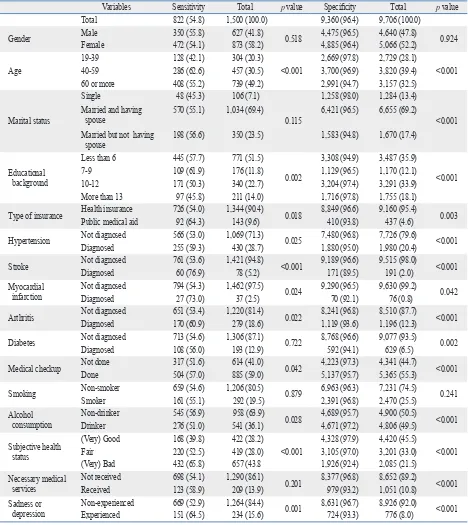
The sensitivity and specificity of the hospitalization and the factors related to the sensitivity and the specificity of the hospitalization are shown in Table 1. The sensitivity and specificity were 54.8% and 96.4%, respectively. In the uni-variate analysis on the factors related to the sensitivity of the hospitalization, age group, marital status, educational back-ground, type of insurance, hypertension, stroke, myocardial infarction, arthritis, medical checkup, alcoholic consump-tion, subjective health status, and sadness had the statistical significance with p values <0.20. And in the univariate anal-ysis on the factors related to the specificity of the hospital-ization, age group, marital status, educational background, type of insurance, hypertension, stroke, myocardial infarc-tion, arthritis, diabetes, medical checkup, alcoholic con-sumption, subjective health status, necessary medical ser-vice and sadness had the statistical significance with p values <0.20.
1.23-1.71) or 2.35 (95% CI, 1.94-2.85). The OR of those who did not obtain necessary medical services compared to those who did was 1.36 (95% CI, 1.10-1.68) (Table 4). The OR for the specificity of outpatient visits for education with 10-12 years or more than 13 ones compared to that with less than 6 years was 1.33 (95% CI, 1.06-1.66). The OR for respondents who had suffered hypertension, myocardial in-farction, arthritis, or diabetes compared to those who had (95% CI, 1.20-1.84). The OR of those who had received a
[image:4.595.71.539.80.605.2]medical checkup to those who had not was 1.40 (95% CI, 1.22-1.62) and the OR for the specificity of the outpatient visits in those who consumed alcohol compared to those who did not was 1.17 (95% CI, 1.01-1.36). Compared to those who rated their health as (very) good, respondents who rated their health as fair or (very) bad showed an OR for the sensitivity of the outpatient visit of 1.45 (95% CI,
Table 1. Sensitivity and Specificity of Hospitalization by Variables
Variables Sensitivity Total p value Specificity Total p value
Total 822 (54.8) 1,500 (100.0) 9,360 (96.4) 9,706 (100.0)
Gender MaleFemale 350 (55.8)472 (54.1) 627 (41.8) 873 (58.2) 0.518 4,475 (96.5)4,885 (96.4) 4,640 (47.8)5,066 (52.2) 0.924
Age
19-39 128 (42.1) 304 (20.3)
<0.001
2,669 (97.8) 2,729 (28.1)
<0.001
40-59 286 (62.6) 457 (30.5) 3,700 (96.9) 3,820 (39.4)
60 or more 408 (55.2) 739 (49.2) 2,991 (94.7) 3,157 (32.5)
Marital status
Single 48 (45.3) 106 (7.1)
0.115
1,258 (98.0) 1,284 (13.4)
<0.001 Married and having
spouse 570 (55.1) 1,034 (69.4) 6,421 (96.5) 6,655 (69.2)
Married but not having
spouse 198 (56.6) 350 (23.5) 1,583 (94.8) 1,670 (17.4)
Educational background
Less than 6 445 (57.7) 771 (51.5)
0.002
3,308 (94.9) 3,487 (35.9)
<0.001
7-9 109 (61.9) 176 (11.8) 1,129 (96.5) 1,170 (12.1)
10-12 171 (50.3) 340 (22.7) 3,204 (97.4) 3,291 (33.9)
More than 13 97 (45.8) 211 (14.0) 1,716 (97.8) 1,755 (18.1)
Type of insurance Health insurancePublic medical aid 726 (54.0) 92 (64.3) 1,344 (90.4) 143 (9.6) 0.018 8,849 (96.6) 410 (93.8) 9,160 (95.4) 437 (4.6) 0.003
Hypertension Not diagnosed 566 (53.0) 1,069 (71.3) 0.025 7,480 (96.8) 7,726 (79.6) <0.001
Diagnosed 255 (59.3) 430 (28.7) 1,880 (95.0) 1,980 (20.4)
Stroke Not diagnosed 761 (53.6) 1,421 (94.8) <0.001 9,189 (96.6) 9,515 (98.0) <0.001
Diagnosed 60 (76.9) 78 (5.2) 171 (89.5) 191 (2.0)
Myocardial
infarction Not diagnosedDiagnosed 794 (54.3) 27 (73.0) 1,462 (97.5) 37 (2.5) 0.024 9,290 (96.5) 70 (92.1) 9,630 (99.2) 76 (0.8) 0.042
Arthritis Not diagnosed 651 (53.4) 1,220 (81.4) 0.022 8,241 (96.8) 8,510 (87.7) <0.001
Diagnosed 170 (60.9) 279 (18.6) 1,119 (93.6) 1,196 (12.3)
Diabetes Not diagnosed 713 (54.6) 1,306 (87.1) 0.722 8,768 (96.6) 9,077 (93.5) 0.002
Diagnosed 108 (56.0) 193 (12.9) 592 (94.1) 629 (6.5)
Medical checkup Not doneDone 317 (51.6)504 (57.0) 614 (41.0) 885 (59.0) 0.042 4,223 (97.3)5,137 (95.7) 4,341 (44.7)5,365 (55.3) <0.001
Smoking Non-smokerSmoker 659 (54.6)161 (55.1) 292 (19.5)1,206 (80.5) 0.879 6,963 (96.3)2,391 (96.8) 7,231 (74.5)2,470 (25.5) 0.241
Alcohol
consumption Non-drinkerDrinker 545 (56.9)276 (51.0) 958 (63.9) 541 (36.1) 0.028 4,689 (95.7)4,671 (97.2) 4,900 (50.5)4,806 (49.5) <0.001
Subjective health status
(Very) Good 168 (39.8) 422 (28.2)
<0.001
4,328 (97.9) 4,420 (45.5)
<0.001
Fair 220 (52.5) 419 (28.0) 3,105 (97.0) 3,201 (33.0)
(Very) Bad 432 (65.8) 657 (43.8 1,926 (92.4) 2,085 (21.5)
Necessary medical
services Not receivedReceived 698 (54.1)123 (58.9) 1,290 (86.1) 209 (13.9) 0.201 8,377 (96.8) 979 (93.2) 8,652 (89.2)1,051 (10.8) <0.001 Sadness or
which has only national health indices. As a result, informa-tion obtained by the CHS from respondents and data on time-series changes can be used to establish agendas for public health programs or to evaluate the results of such pro-grams. However, none of the questions, with the exception of those about rates of diseases and healthcare utilization, produces information that can be compared with objective data. Although rates of disease and healthcare utilization can be examined by reference to data (e.g., insurance claims, medical records, etc.) that are relatively more objective than those obtained via self-report surveys, these issues have been investigated via questionnaires due to the easier ac-cess to data, efficiency, and lower cost associated with this method. Thus, research on the degree to which data ob-tained via self-report surveys are accurate and on the fac-tors associated with accuracy will enhance the usefulness of information regarding rates of diseases and healthcare utili-zation gathered by such methods.
This study that is the follow-up study for the validity of CHS was to identify subject characteristics related to sensi-tivity and specificity for purposes of evaluating the validity of the CHS. In this study, the sensitivity of hospitalization not was 0.54 (95% CI, 0.46-0.65), 0.52 (95% CI, 0.29-0.92),
0.71 (95% CI: 0.57-0.87), or 0.56 (95% CI: 0.43-0.72), re-spectively. The OR of those who had received a medical checkup to those who had not was 0.73 (95% CI, 0.63-0.85). Compared to those who rated their health as (very) good, respondents who rated their health as fair and (very) bad showed an OR for the specificity of the outpatient visit of 0.67 (95% CI, 0.56-0.80) or 0.43 (95% CI, 0.34-0.53). The OR of those who did not obtain necessary medical ser-vices compared to those who did was 0.65 (95% CI, 0.53-0.79) and the OR of those who did not experience sadness compared to those who did was 0.72 (95% CI, 0.56-0.91).
DISCUSSION
[image:5.595.58.527.83.412.2]The CHS that addresses demographic characteristics, rates of disease and healthcare utilization, vaccination and health behavior, quality of life, and socio-physical environment is now becoming the main data source on the health of 253 jurisdictions of public health center. This point is the dis-tinctive advantage of CHSs compared with KNHANES
Table 2. Multivariate Logistic Regression Analysis on Sensitivity and Specificity for Hospitalization
Variables (reference)
Sensitivity Specificity
Odds ratio interval of odds ratio Odds ratio95% confidence interval of odds ratio95% confidence
Lower Upper Lower Upper
Gender (male) Female 0.91 0.69 1.20 1.54 1.18 2.03
Age (19-39) 40-5960 or more 1.450.75 1.040.47 2.161.20 1.181.25 0.810.78 1.722.00
Marital status (single)
Married and having spouse 1.12 0.72 1.75 0.71 0.45 1.13
Married but not having
spouses 1.10 0.66 1.84 0.59 0.35 0.99
Educational background (less than 6)
7-9 1.19 0.82 1.74 1.05 0.72 1.53
10-12 0.94 0.65 1.35 1.14 0.80 1.61
>13 0.89 0.58 1.34 1.35 0.87 2.11
Type of insurance (health insurance) Public medical aid 1.07 0.72 1.59 0.99 0.64 1.52
Hypertension (not diagnosed) Diagnosed 0.99 0.76 1.29 1.07 0.82 1.41
Stroke (not diagnosed) Diagnosed 2.13 1.21 3.77 0.65 0.39 1.09
Myocardial infarction (not diagnosed) Diagnosed 1.91 0.89 4.08 0.89 0.38 2.12
Arthritis (not diagnosed) Diagnosed 1.14 0.84 1.54 0.86 0.64 1.16
Diabetes (not diagnosed) Diagnosed - - - 0.97 0.67 1.41
Medical checkup (not done) Done 1.14 0.90 1.44 0.69 0.54 0.88
Smoking (non-smoker) Smoker - - -
-Alcohol consumption (non-drinker) Drinker 0.90 0.70 1.16 1.31 1.02 1.68
Subjective health status [(very) good] Fair(Very) Bad 1.763.21 1.322.32 2.364.46 0.760.37 0.560.26 1.030.51
Necessary medical service (not received) Received - - - 0.68 0.51 0.91
those with poor health, whether judged objectively or sub-jectively, have higher sensitivity and lower specificity. Con-versely, those with good health, judged either objectively or subjectively, have lower sensitivity and higher specificity.
This study tried to identify factors related to validity of some variables, but existing relevant literature suggests that kappa values represent the extent of the fit between ob-tained and true values and have presented findings concern-ing reliability in terms of comparisons with objective data. and outpatient visit questions was highest among married
[image:6.595.73.540.81.593.2]individuals living without their spouse, those with chronic diseases, those with poor health behavior, those who recent-ly received medical checkups, and those with less favorable assessments of their health status. In contrast, specificity was highest in single individuals, those with more educa-tion, those without chronic diseases, those who had not re-ceived a medical checkup recently, and those with a more favorable assessment of their health status. In other words,
Table 3. Sensitivity and Specificity of Outpatient Visit by Variables
Variables Sensitivity Total p value Specificity Total p value
Total 2,133 (52.1) 4,096 (100.0) 6,083 (85.6) 7,105 (100.0)
Gender MaleFemale 1,362 (54.8) 771 (47.8) 1,612 (39.4)2,484 (60.6) <0.001 3,205 (87.7)2,878 (83.4) 3,654 (51.4)3,451 (48.6) <0.001
Age
19-39 261 (39.2) 666 (16.2)
<0.001
2,203 (92.9) 2,225 (31.9)
<0.001
40-59 648 (46.4) 1,395 (34.1) 2,525 (87.5) 2,886 (41.3)
60 or more 1,224 (60.1) 2,035 (49.7) 1,355 (72.5) 1,869 (26.8)
Marital status
Single 89 (35.7) 249 (6.1)
<0.001
1,066 (93.4) 1,141 (16.2)
<0.001 Married and having spouse 1,444 (50.6) 2,854 (70.3) 4,116 (85.2) 4,831 (68.7)
Married but not having
spouse 584 (61.0) 957 (23.6) 836 (78.9) 1,060 (15.1)
Educational background
Less than 6 1,251 (59.2) 2,113 (51.6)
<0.001
1,615 (75.4) 2,142 (30.2)
<0.001
7-9 280 (56.3) 497 (12.2) 709 (83.6) 848 (11.9)
10-12 410 (42.4) 967 (23.6) 2,425 (91.1) 2,662 (37.5)
More than 13 191 (37.0) 516 (12.6) 1,332 (91.8) 1,451 (20.4)
Type of insurance Health insurance 1,909 (51.2) 3,729 (91.9) <0.001 5,834 (86.1) 6,776 (96.4) <0.001 Public medical aid 212 (64.2) 330 (8.1) 176 (70.4) 250 (3.6)
Hypertension Not diagnosed 1,300 (48.3) 2,693 (66.4) <0.001 5,368 (88.5) 6,066 (85.4) <0.001
Diagnosed 807 (59.2) 1,363 (33.6) 694 (66.8) 1,039 (14.6)
Stroke Not diagnosedDiagnosed 2,006 (51.5) 101 (63.9) 3,898 (96.1) 158 (3.9) 0.002 5,996 (85.7) 65 (60.6) 6,997 (98.5) 108 (1.5) <0.001
Myocardial
infarction Not diagnosedDiagnosed 2,066 (51.7) 41 (73.2) 4,000 (98.6) 56 (1.4) 0.001 6,034 (85.6) 29 (50.9) 7,049 (99.2) 56 (0.8) <0.001
Arthritis Not diagnosed 1,534 (47.5) 3,228 (79.6) <0.001 5,644 (87.3) 6,466 (91.0) <0.001
Diagnosed 573 (69.2) 828 (20.4) 418 (65.5) 639 (9.0)
Diabetes Not diagnosed 1,786 (49.9) 3,576 (88.2) <0.001 5,859 (86.6) 6,766 (95.2) <0.001
Diagnosed 321 (66.9) 480 (11.8) 203 (60.1) 339 (4.8)
Medical checkup Not doneDone 1,433 (55.9) 674 (45.1) 1,494 (36.8)2,562 (63.2) <0.001 3,060 (88.9)3,003 (82.0) 3,442 (48.4)3,663 (51.6) <0.001
Smoking Non-smokerSmoker 1,719 (51.9) 388 (52.1) 3,310 (81.6) 745 (18.4) 0.942 4,302 (84.4)1,754 (87.6) 5,098 (71.8)2,003 (28.2) 0.001
Alcohol
consumption Non-drinkerDrinker 1,349 (53.7) 758 (49.1) 2,512 (61.9)1,544 (38.1) 0.004 2,751 (82.8)3,313 (87.6) 3,323 (46.8)3,782 (53.2) <0.001
Subjective health status
(Very) Good 446 (36.5) 1,222 (30.1)
<0.001
3,312 (92.0) 3,601 (50.7)
<0.001
Fair 648 (49.2) 1,318 (32.5) 1,943 (84.9) 2,289 (32.2)
(Very) Bad 1,013 (66.9) 1,514 (37.4) 808 (66.5) 1,215 (17.1)
Necessary medical
services Not receivedReceived 1,762 (49.9) 345 (65.7) 3,531 (87.1) 525 (12.9) <0.001 5,526 (86.7) 534 (73.1) 6,374 (89.7) 731 (10.3) <0.001 Sadness or
fered as a function of whether subjects had been diagnosed with chronic diseases. Sensitivity for both hospitalization and outpatient visits was higher in those with chronic diseas-es, whereas specificity was higher in those without chronic diseases. According to a comparative study reviewing self-reports and doctors’ claim records for hypertension, the kappa value reflecting the concordance rate in those with diabetes was 0.42, which was significantly lower than that (0.56) among those without diabetes.14 In this study,
how-ever, the kappa value reflecting agreement between self-re-port and insurance claims data was higher in those with hy-pertension (0.58) than in those without this condition (0.55) with respect to hospitalization, and higher in those without hypertension (0.50) than in those with hypertension (0.25) in terms of outpatient visits. This difference between the concordance rates for hospitalization and outpatient visits can be explained as follows. Because hospitalization does not occur often, those with hypertension who were highly interested in health would be expected to remember with greater accuracy whether they had been hospitalized. On the other hand, because outpatient visits are common among those who suffer from hypertension, it is possible that pa-That is, kappa is an index of reproducibility or reliability,
and can exclude the degree of agreement of two data by chance. If kappa is more than 0.75, then reliability between two data is interpreted as excellent; if kappa is more than 0.40 and under 0.75, it is fair or good; and if kappa is under 0.40, then it is poor.7 One of them showed the concordance
between subjective and objective reports on healthcare uti-lization (hospitauti-lization, outpatient visits), and was higher among those with frequent healthcare utilization than among those with infrequent utilization.8 Some studies suggest that
age, gender, educational background, and ethnicity are as-sociated with the accuracy of self-reports.9,10 In this study,
specificity was higher in single individuals and in those with more education, whereas sensitivity was higher among mar-ried individuals living without their spouse. Additionally, some studies have reported that older age is the only demo-graphic factor significantly associated with inaccurate and under-reported healthcare utilization.11,12 Indeed, other
stud-ies have reported that the accuracy of self-reports was not related to demographic factors such as education, gender, health status, socioeconomic status, and so on.3,13
Moreover, we found that sensitivity and specificity
dif-Table 4. Multivariate Logistic Regression Analysis on Sensitivity and Specificity for Outpatient Visit
Variables (reference)
Sensitivity Specificity
Odds ratio interval of odds ratio Odds ratio95% confidence interval of odds ratio95% confidence
Lower Upper Lower Upper
Gender (male) Female 1.21 1.03 1.43 0.84 0.70 1.01
Age (19-39) 40-5960 or more 0.830.90 0.660.68 1.051.19 1.000.88 0.790.65 1.271.19
Marital status (single)
Married and having spouse 1.26 0.95 1.68 0.84 0.64 1.11
Married but not having
spouses 1.41 1.02 1.95 0.99 0.72 1.37
Educational background (less than 6)
7-9 1.23 0.98 1.53 0.88 0.70 1.11
10-12 0.93 0.76 1.15 1.33 1.06 1.66
>13 0.88 0.69 1.14 1.37 1.04 1.80
Type of insurance (health insurance) Public medical aid 1.13 0.87 1.46 0.79 0.58 1.08
Hypertension (not diagnosed) Diagnosed 1.02 0.88 1.19 0.54 0.46 0.65
Stroke (not diagnosed) Diagnosed 1.09 0.76 1.55 0.94 0.61 1.45
Myocardial infarction (not diagnosed) Diagnosed 1.59 0.85 2.97 0.52 0.29 0.92
Arthritis (not diagnosed) Diagnosed 1.61 1.35 1.94 0.71 0.57 0.87
Diabetes (not diagnosed) Diagnosed 1.49 1.20 1.84 0.56 0.43 0.72
Medical checkup (not done) Done 1.40 1.22 1.62 0.73 0.63 0.85
Smoking (non-smoker) Smoker - - - 0.90 0.74 1.09
Alcohol consumption (non-drinker) Drinker 1.17 1.01 1.36 0.93 0.80 1.10
Subjective health status [(very) good] Fair(Very) Bad 1.452.35 1.231.94 1.712.85 0.670.43 0.560.34 0.800.53
Necessary medical service (not received) Received 1.36 1.10 1.68 0.65 0.53 0.79
[image:7.595.58.530.81.412.2]pensation and car insurance are available. This kind of prob-lem can be overcome by using other comparison data as the true values. Third, because data from only rural areas (13 public health centers) were used, the results of this study may not be generalized to large cities such as Seoul. More-over, because the questions used for the validity assessment were limited to those on hospitalization and outpatient vis-its, the results are not applicable to the utilization patterns of other healthcare services, such as visits to emergency medical centers or dentists. This problem could be over-come by examining factors associated with the sensitivity and specificity of the entire CHS or by increasing the num-ber of comparison variables.
In summary, this study revealed the subject-related fac-tors associated with the validity of the CHS. Efforts to im-prove the sensitivity and the specificity from self-reported questionnaires should consider how the characteristics of subjects may affect their responses. One of them is to edu-cate interviewers about how to elicit more accurate answers to questions about healthcare utilization before they begin to conduct CHSs.
ACKNOWLEDGEMENTS
This work was supported by Konkuk University in 2012.
REFERENCES
1. Lerner DJ, Lee J. Measuring Health-Related Work Productivity with Self-Reports. In: Kessler RC, Stang PE, editors. Health and Work Productivity: Making the Business Case for Quality Health Care. Chicaco, IL: University of Chicaco Press; 2006. p.66-87. 2. Evans C, Crawford B. Patient self-reports in pharmacoeconomic
studies. Their use and impact on study validity. Pharmacoeconom-ics 1999;15:241-56.
3. Ritter PL, Stewart AL, Kaymaz H, Sobel DS, Block DA, Lorig KR. Self-reports of health care utilization compared to provider records. J Clin Epidemiol 2001;54:136-41.
4. Petrou S, Murray L, Cooper P, Davidson LL. The accuracy of self-reported healthcare resource utilization in health economic studies. Int J Technol Assess Health Care 2002;18:705-10.
5. Rim H, Kim H, Lee K, Chang S, Hovell MF, Kim YT, et al. Valid-ity of self-reported healthcare utilization data in the CommunValid-ity Health Survey in Korea. J Korean Med Sci 2011;26:1409-14. 6. Goldman N, Lin IF, Weinstein M, Lin YH. Evaluating the quality
of self-reports of hypertension and diabetes. J Clin Epidemiol 2003;56:148-54.
7. Ahn Y, Yoo K, Park B. Manual for medical statistics. Seoul, Ko-rea: Press of Seoul National University; 2005. p.142-6.
8. Raebel MA, Malone DC, Conner DA, Xu S, Porter JA, Lanty FA.
tients with this condition would provide inaccurate infor-mation about their visits to healthcare institutions during the past 2 weeks, due to failure to remember if their last vis-it occurred wvis-ithin that time frame. In fact, specificvis-ity for outpatient visits was high among those without hyperten-sion (88.5%), whereas it was low among those with high blood pressure (66.8%).
Studies comparing medical records and self-reports with respect to eye examinations and diabetes found the follow-ing kappa values for different levels of subjective assess-ments of health status: 0.15 among those rating their health as very good, 0.23 among those rating it as good, 0.25 among those rating it as fair, 0.25 among those rating it as bad, and 0.24 as those rating it as very bad, confirming that self-rated assessments were not related to objective evalua-tions of health status.15 This study found that sensitivity for
hospitalization and outpatient visits was higher among those who assessed their health to be poor than among those who assessed it to be good. On the other hand, specificity was higher among those who evaluated their health to be good than among those who assessed their health to be poor. The kappa values for the concordance rates for hospitalization by subjective ratings of health were 0.46 for those rating their health as very good or good, 0.55 for those rating their health as fair, and 0.60 for those rating their health as very bad or bad, whereas those for outpatient visits were 0.33, 0.36, and 0.33, respectively. Among those who did not re-ceive necessary medical services and those experiencing depression or sadness, sensitivity was high, whereas the specificity was low with respect to outpatient visits.
com-tion data among seniors. Health Serv Res 2002;37:751-74. 13. Marshall SF, Deapen D, Allen M, Anton-Culver H, Bernstein L,
Horn-Ross PL, et al. Validating California teachers study self-re-ports of recent hospitalization: comparison with California hospi-tal discharge data. Am J Epidemiol 2003;158:1012-20.
14. Muhajarine N, Mustard C, Roos LL, Young TK, Gelskey DE. Comparison of survey and physician claims data for detecting hy-pertension. J Clin Epidemiol 1997;50:711-8.
15. Beckles GL, Williamson DF, Brown AF, Gregg EW, Karter AJ, Kim C, et al. Agreement between self-reports and medical records was only fair in a cross-sectional study of performance of annual eye examinations among adults with diabetes in managed care. Med Care 2007;45:876-83.
Health services use and health care costs of obese and nonobese individuals. Arch Intern Med 2004;164:2135-40.
9. Bhandari A, Wagner T. Self-reported utilization of health care ser-vices: improving measurement and accuracy. Med Care Res Rev 2006;63:217-35.
10. Short ME, Goetzel RZ, Pei X, Tabrizi MJ, Ozminkowski RJ, Gib-son TB, et al. How accurate are self-reports? Analysis of self-re-ported health care utilization and absence when compared with administrative data. J Occup Environ Med 2009;51:786-96. 11. Wallihan DB, Stump TE, Callahan CM. Accuracy of self-reported
health services use and patterns of care among urban older adults. Med Care 1999;37:662-70.