AN ANALYSIS ON QUALITY OF WORK LIFE AND ORGANIZATIONAL EFFECTIVENESS
Dr. A.V. Shathya
Assistant Professor of Management, P.K.R Arts College for Women (Autonomous), P.B.No.21, 127,Pariyur Road, Gobichettipalayam - 638 476,
Erode District Tamilnadu, India.
Abstract
A healthy workplace is a place where everyone works together to achieve an agreed vision for the health and well-being of workers and the surrounding community. It provides all members of the workforce with physical, psychological, social and organizational conditions that protect and promote health and safety. It enables managers and workers to increase control over their own health and to improve it, and to become more energetic, positive and contented. In return, the workforce is more stable, committed and productive. The present study aims to identify the organizational effectiveness in Industries and to ascertain the Quality of Work Life among the executives. The universe of the study refers to the workers of the selected 5 manufacturing industry related organizations in Tiruchirappalli district of Tamilnadu. The total strength of the universe is 320 executives. The sample size taken to conduct the research is 100 executives. 20 executives are selected from each study industry. The respondents were selected by using stratified disproportionate random sampling technique. The study explicit that majority of the respondents are having high level of organizational process and moderate level of various dimensions of Quality of Work Life. The researcher suggest the fact that establish policies and guidelines to protect health and safety of the employees in the workplace and make clear that a company is willing to negotiate with a labour union.
Key words: Healthy work place, Executives, Organizational effectiveness and Quality of work life
International Research Journal of Management and Commerce
ISSN: (2348-9766)
Impact Factor 5.564 Volume 5, Issue 1, January 2018
INTRODUCTION
Quality of Work Life in an organization is essential for the smooth running and
success of its employees. The work-life balance must be maintained effectively to ensure that
all employees are running at their peak potential and free from stress and strain (Quinn,
1988). The Quality of Work Life can affect such things as employees‘ timings, his or her
work output, his or her available leaves, etc. Quality of Work Life helps the employees to feel
secure and like they are being thought of and cared for by the organization in which they
work. An organization‘s HR department assumes responsibility for the effective running of
the Quality of Work Life for their employees. Rakesh Kumar, (2003) argued that more
pragmatically identified the essential components of Quality of working life as; basic
extrinsic job factors of wages, hours and working conditions, and the intrinsic job notions of
the nature of the work itself. He suggested that relevant Quality of working life concepts may
vary according to organization and employee group.
Eaton, et al., (1992)suggested that
Quality of working life was associated with satisfaction with wages, hours and working
conditions, describing the ―basic elements of a good quality of work life, safe work
environment, equitable wages, equal employment opportunities and opportunities for
advancement.
Gilgeous, (1998)in his study ―Designing Quality into Work Life found that
improvements in the quality of work life are achieved not only through external or structural
modifications, but more importantly through improved relations between supervisors and
subordinates.
the organization to take up the necessary steps to improve the Quality of Work Life among its workers and improve the organizational effectiveness.
METHODS AND MATERIALS
The present study aims to
understand the organizational effectiveness in industries
and ascertain the Quality of Work Life among the executives. The research design chosen is
descriptive in nature. The universe of the study refers to the workers of the selected 5
manufacturing industry related organizations in Tiruchirappalli district of Tamilnadu. The
name of the industry is TDCL Limited., Anand Engineering Ltd., Rana Break Line, Trichy
Steel Rolling Company and GK & Sons. The total strength of the universe is 320 Executives.
The sample size taken to conduct the research is 100 executives. 10% of the universe has
been taken for the research. 20 executives are selected from each study industry. The
respondents were selected by using stratified disproportionate random sampling technique.
Structured interview schedule was used for primary data collection. Secondary data was
collected from earlier research work, various published journals, magazines, websites and
online articles. The deductive approach identified eight dimensions and their indicators from
the various premises and theories on Organizational Effectiveness. The dimensions identified
included Organizational Process, Organizational Psychology, Organizational Commitment,
Organizational Transition, Training Programmes, Employees Commitment, Managerial
effectiveness, Job Satisfaction; Safety Measures, Growth and Overall. A questionnaire was
designed incorporating the dimensions and their indicators identified from the literature. The
deductive approach identified eight dimensions and their indicators from the various premises
and theories on Quality of Work Life. The dimensions identified included Adequate Fair and
Equitable Compensation, Safe and Healthy Work Place, Opportunities for Personal and
Professional, Ethical Organizational Actions, Constitutionalism, Job Security, Supportive
Work Culture and Employee Privacy issues. It is a self report five point rating scale ranging
from ‘Strongly Agree’ to ‘Strongly Disagree’ weighted 5,4,3,2,1 on the scale points.
Additional indicators of effectiveness and quality of work life also obtained. Simple
Percentage Analysis, Chi – Square Analysis, ‘t’ test and Regression Analysis are the tools
RESULTS AND DISCUSSION
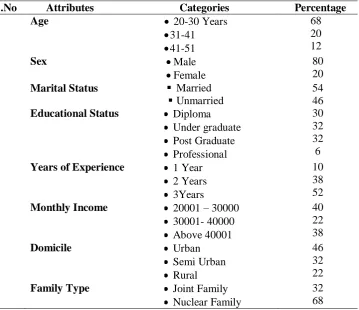
[image:4.595.124.484.159.469.2]Socio-Demographic characteristics
Table 1
Socio Demographic Characteristics of the Respondents
S.No Attributes Categories Percentage
1 Age 20-30 Years
31-41 41-51
68 20 12
2 Sex Male
Female
80 20 3 Marital Status Married
Unmarried
54 46 4 Educational Status Diploma
Under graduate Post Graduate Professional
30 32 32 6 5 Years of Experience 1 Year
2 Years 3Years
10 38 52 6 Monthly Income 20001 – 30000
30001- 40000 Above 40001
40 22 38
7 Domicile Urban
Semi Urban Rural
46 32 22 8 Family Type Joint Family
Nuclear Family
32 68
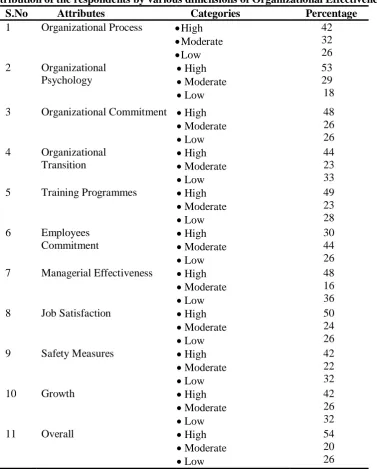
Table 2
Distribution of the respondents by various dimensions of Organizational Effectiveness
S.No Attributes Categories Percentage
1 Organizational Process High Moderate Low
42 32 26 2 Organizational
Psychology High Moderate Low 53 29 18 3 Organizational Commitment High
Moderate Low
48 26 26 4 Organizational
Transition High Moderate Low 44 23 33 5 Training Programmes High
Moderate Low
49 23 28 6 Employees
Commitment High Moderate Low 30 44 26 7 Managerial Effectiveness High
Moderate Low
48 16 36
8 Job Satisfaction High
Moderate Low
50 24 26
9 Safety Measures High
Moderate Low
42 22 32
10 Growth High
Moderate Low
42 26 32
11 Overall High
Moderate Low
54 20 26
together to understand the trends and to translate theory into usable and practical recommendations for managing highly dynamic organizational environments.
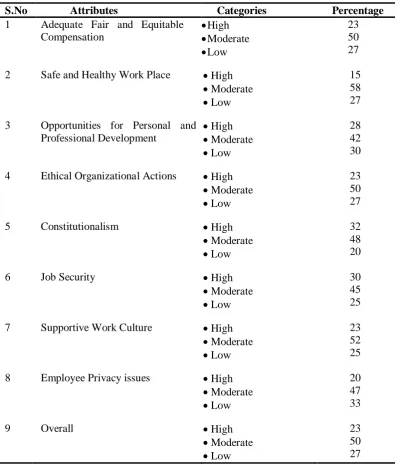
Table 3
Perception of Quality of Work Life with regard to its Various Dimensions
S.No Attributes Categories Percentage
1 Adequate Fair and Equitable Compensation
High Moderate Low
23 50 27 2 Safe and Healthy Work Place High
Moderate Low
15 58 27 3 Opportunities for Personal and
Professional Development
High Moderate Low
28 42 30 4 Ethical Organizational Actions High
Moderate Low
23 50 27
5 Constitutionalism High
Moderate Low
32 48 20
6 Job Security High
Moderate Low
30 45 25 7 Supportive Work Culture High
Moderate Low
23 52 25 8 Employee Privacy issues High
Moderate Low
20 47 33
9 Overall High
Moderate Low
23 50 27
benefits are: safety measures, legal and financial services, consumer services, retirement benefits, conveyance, canteen facilities, recreational services, career counseling and employee’s information reports.
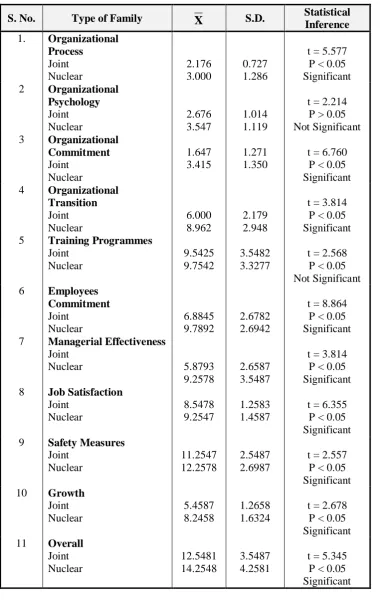
Table 4
‘t’ test between the respondents type of family with regard to Organizational effectiveness
S. No. Type of Family
X
S.D. StatisticalInference 1. Organizational
Process Joint Nuclear 2.176 3.000 0.727 1.286
t = 5.577 P < 0.05 Significant 2 Organizational
Psychology Joint Nuclear 2.676 3.547 1.014 1.119
t = 2.214 P > 0.05 Not Significant 3 Organizational
Commitment Joint Nuclear 1.647 3.415 1.271 1.350
t = 6.760 P < 0.05 Significant 4 Organizational
Transition Joint Nuclear 6.000 8.962 2.179 2.948
t = 3.814 P < 0.05 Significant 5 Training Programmes
Joint Nuclear 9.5425 9.7542 3.5482 3.3277
t = 2.568 P < 0.05 Not Significant 6 Employees
Commitment Joint Nuclear 6.8845 9.7892 2.6782 2.6942
t = 8.864 P < 0.05 Significant 7 Managerial Effectiveness
Joint
Nuclear 5.8793
9.2578
2.6587 3.5487
t = 3.814 P < 0.05 Significant 8 Job Satisfaction
Joint Nuclear 8.5478 9.2547 1.2583 1.4587
t = 6.355 P < 0.05 Significant 9 Safety Measures
Joint Nuclear 11.2547 12.2578 2.5487 2.6987
t = 2.557 P < 0.05 Significant 10 Growth
Joint Nuclear 5.4587 8.2458 1.2658 1.6324
t = 2.678 P < 0.05 Significant 11 Overall
Joint Nuclear 12.5481 14.2548 3.5487 4.2581
It is inferred from the Table 4 that there is a significant difference between type of family of the respondents with regard to various dimensions of organizational effectiveness such as Organizational Process, Organizational Commitment, Organizational Transition, Employees Commitment, Managerial Effectiveness, Job Satisfaction, Safety Measures, Growth and overall level of organization effectiveness. However, there is no significant difference between type of family of the respondents with regard to various dimensions of organizational effectiveness such as organizational psychology and training programme. Further, the mean score indicates that type of family of the respondents specifically, those who are followed nuclear family system has influence the level of organizational effectiveness experienced by industrial workers.
Table 5
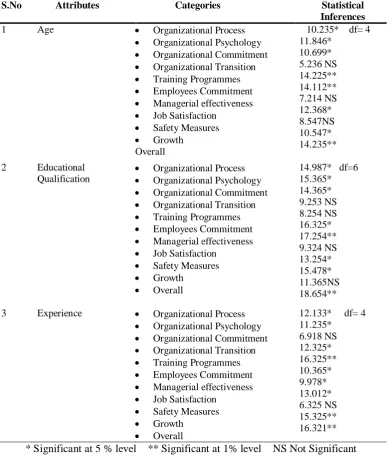
Association between age, educational qualification and experience of the respondents with regard to organizational effectiveness
S.No Attributes Categories Statistical
Inferences 1 Age Organizational Process
Organizational Psychology Organizational Commitment Organizational Transition Training Programmes Employees Commitment Managerial effectiveness Job Satisfaction
Safety Measures Growth
Overall
10.235* df= 4 11.846* 10.699* 5.236 NS 14.225** 14.112** 7.214 NS 12.368* 8.547NS 10.547* 14.235**
2 Educational Qualification
Organizational Process Organizational Psychology Organizational Commitment Organizational Transition Training Programmes Employees Commitment Managerial effectiveness Job Satisfaction
Safety Measures Growth Overall
14.987* df=6 15.365* 14.365* 9.253 NS 8.254 NS 16.325* 17.254** 9.324 NS 13.254* 15.478* 11.365NS 18.654**
3 Experience Organizational Process Organizational Psychology Organizational Commitment Organizational Transition Training Programmes Employees Commitment Managerial effectiveness Job Satisfaction
Safety Measures Growth Overall
12.133* df= 4 11.235* 6.918 NS 12.325* 16.325** 10.365* 9.978* 13.012* 6.325 NS 15.325** 16.321**
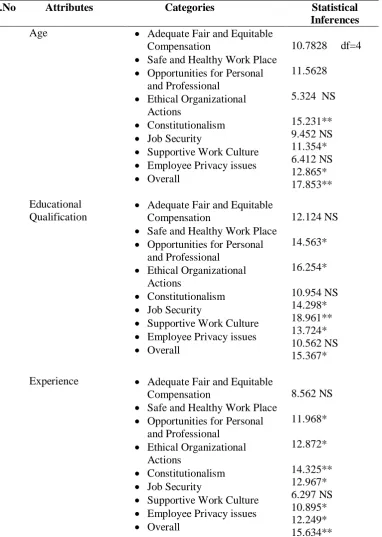
Table 6
Association between age, educational qualification and experience of the respondents with regard to Quality of work life
S.No Attributes Categories Statistical
Inferences
1 Age Adequate Fair and Equitable
Compensation
Safe and Healthy Work Place Opportunities for Personal
and Professional Ethical Organizational
Actions
Constitutionalism Job Security
Supportive Work Culture Employee Privacy issues Overall
10.7828 df=4 11.5628
5.324 NS 15.231** 9.452 NS 11.354* 6.412 NS 12.865* 17.853** 2 Educational
Qualification
Adequate Fair and Equitable Compensation
Safe and Healthy Work Place Opportunities for Personal
and Professional Ethical Organizational
Actions
Constitutionalism Job Security
Supportive Work Culture Employee Privacy issues Overall
12.124 NS 14.563* 16.254* 10.954 NS 14.298* 18.961** 13.724* 10.562 NS 15.367* 3 Experience Adequate Fair and Equitable
Compensation
Safe and Healthy Work Place Opportunities for Personal
and Professional Ethical Organizational
Actions
Constitutionalism Job Security
Supportive Work Culture Employee Privacy issues Overall
8.562 NS 11.968* 12.872* 14.325** 12.967* 6.297 NS 10.895* 12.249* 15.634** * Significant at 5 % level ** Significant at 1% level NS: Not Significant
the age of the respondents with regard to various dimensions of quality of life of work like as Opportunities for Personal and Professional development, Constitutionalism and Supportive Work Culture. The mean score indicates that age has influenced the level of quality of life of work experienced by industrial workers. Further, that there is a significant association between the educational qualification of the respondents with regard to various dimensions of quality of life of work such as Safe and Healthy Work Place, Opportunities for Personal and Professional development, Constitutionalism, Job Security and Overall. However, there is no significant association between the educational qualification of the respondents with regard to various dimensions of quality of life of work like as Adequate Fair and Equitable Compensation, Ethical Organizational Actions and Employee Privacy issues. The mean score indicates that age has influence the level of quality of life of work experienced by industrial workers. While that there is a significant association between the experience of the respondents with regard to various dimensions of quality of life of work such as Safe and Healthy Work Place, Opportunities for Personal and Professional development, Constitutionalism, Job Security, Ethical Organizational Actions, Supportive Work Culture and Overall. However, there is no significant association between the experience of the respondents with regard to various dimensions of quality of life of work like as Adequate Fair and Equitable Compensation and Job Security. The mean score indicates that age has influence the level of quality of life of work experienced by industrial workers.
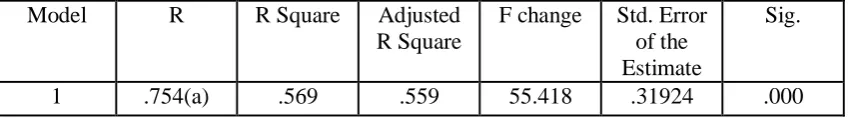
Table 7
Regression results testing the relationship between quality of work life and organizational effectiveness
Model R R Square Adjusted R Square
F change Std. Error of the Estimate
Sig.
1 .754(a) .569 .559 55.418 .31924 .000
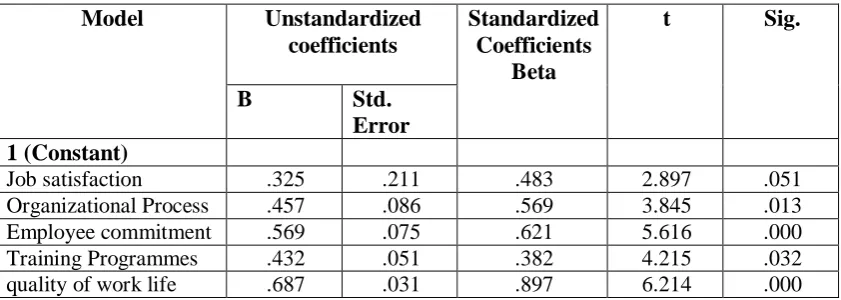
Table 7 Coefficients (a)
Model Unstandardized coefficients
Standardized Coefficients
Beta
t Sig.
B Std.
Error 1 (Constant)
Job satisfaction .325 .211 .483 2.897 .051
Organizational Process .457 .086 .569 3.845 .013
Employee commitment .569 .075 .621 5.616 .000
Training Programmes .432 .051 .382 4.215 .032
quality of work life .687 .031 .897 6.214 .000
QWL is having a highly significant relationship with organizational performance and the level of significant was 1 percent followed by Employee commitment that explained 89.7 percent and 62.1 percent. Training programme is significant with 5 percent level, it was explain that 38.2 percent of total variance. Organizational performance was relationship with organizational effectiveness at the level of 5 percent that explained 56.9 percent of total variance. Job satisfaction is significant with organizational performance and the level of significant was 5 percent that explained 48.3 percent. Result further revealed that QWL was related to organizational effectiveness.
SUGGESTIONS
General suggestions for Employees and for Workplace:
1. Provide fair wages and close formal labour contracts with all the employees, preferably for a long period.
2. Enable staff to take part in occupational training or other types of training, which enhances their career opportunities. Alternatively, have low educated staff trained by staff members who have enjoyed higher education.
3. Establish policies and guidelines to protect health and safety of the employees in the workplace.
4. Refrain from doing business with companies that violate the ILO-conventions; where necessary use legitimate influence to encourage companies to uphold these standards.
5. Establish a Worker’s Council and contribute to a constructive relation with the Council through transparent communication and respect for employees.
7. Make clear that a company is willing to negotiate with a labour union. Remind that trade unions may seem to be strongly politicized, but at a company level this politic involvement is usually less strong.
8. Choose a management tool to introduce and maintain labour standards in operations, and promote the use (or set the requirement to use) a similar monitoring system at local supply chain partners.
9. Safety measures could be improved in the organization so that worker safety could be ensured and accidents could be minimized.
10. Workers may be encouraged to offer suggestions for making improvements in the organization. This makes them feel their importance in the company.
11. Sufficient training programs can be arranged so that the worker productivity could be improved.
12. Appropriate pay strategies could be evolved to give fair and adequate compensation to the employees. Performance based increments would improve the performance of the workers.
REFERENCES
1. Connolly, E.J. Conlon, et al. (1980). Organizational Effectiveness: A Multiple Constitutency Approach. Academy of Management Review, No. 5, Pp. 211-17.
2.
Datta, T. (1999). Quality of Work Life: A Human Values Approach.
Journal of
Human Values, Vol: 5, No. 2, (Oct), pp. 135-145.
3.
Eaton, A.E., Gordon, M.E., and Keefe, J.H., (1992). The impact of quality of work
life programs and grievances system effectiveness on union commitment.
International and Labor Relations Review, Vol. 45, No. 3.p. 591-603.
4.
Gilgeous, V., (1998). Manufacturing managers: their quality of working life.
Integrated Manufacturing System, Vol. 9, No. 3, pp.173-181.
5. Naveen Kumar Sudan A.S. (2004). Organisation Effectiveness and Change, New Delhi: Anmol Publications Pvt. Ltd, India.
6.
Normala and Daud (2010). Investigating the Relationship between Quality of Work
Life and Organizational Commitment among the Employees in Malaysian Firms.
International Journal of Business and Management, Vol: 5, No. 10, pp 123-126.
7. Prasad L.M. (2006). Organisational Behaviour. Fourth Edition, New Delhi: Sultan Chand &Sons, India.
8. Quinn, R.E. (1988). The Competing Values Model: Redefining Organizational Effectiveness and Change. Beyond Rational Management: Mastering the Paradoxes and Competing Demands of High Performance. San Francisco, CA: Jossey-Bass.