International Research Journal of Human Resources and Social Sciences Impact Factor- 2.561
Vol. 2, Issue 12, Dec 2015 ISSN(O): (2349-4085) ISSN(P): (2394-4218)
© Associated Asia Research Foundation (AARF)
Website: www.aarf.asia Email : [email protected] , [email protected]THE USE OF STUDENTS’ SELF-ASSESSMENT IN LEARNING
MATHEMATICS
Cabasag Lota1, Garvida, Marc1, Zipagan Renante1
1
Faculty, Mathematics Department, College of Education-Laboratory High School,
Rizal Technological University
ABSTRACT
This research paper aimed to test the effectiveness of the use of students’
self-assessment in mathematics class. Two independent experiments were conducted to assess
whether the use of self-assessment as a form of formative assessment will be more effective in
terms of mathematics performance and mathematics attitude to the Grade eight students of
the Laboratory High School of Rizal Technological University during the school year
2014-2015. Two groups in each experiment were exposed to self-assessment while the other two
groups were exposed to an ordinary formative assessment method which is the conduct of
daily quizzes which is more of objective type.
It has been found that both formative assessment were equally effective in terms of the
mathematics performance but in terms of attitude level, the use of self-assessment is
statistically more effective. The performance of the students between the controlled and
experimental group is not significantly different due to attribution theory and the maturity
level of the respondents.
It is recommended to teachers to vary their assessment and consider self-assessment as part
of their formative assessment strategy in mathematics especially to a more mature group of
students. It is also important to develop more standardized self-assessment for teachers and
use more books that are rich in self-assessment exercises.
Keywords: Self-assessment, formative assessment, mathematics performance, mathematics
Introduction
Assessment practices have started to change over the last several years with teachers
building a larger repertoire of assessment tools and strategies. There is a greater
understanding of the importance of timely assessments for learning as well as regular
assessments of learning.
Assessment is commonly used as means to evaluate students’ performance and thus
students sometimes may likely to study only for the sake of passing the exam and not driven
by internal desire to learn it because it is a must.
One type of assessment that has been shown to raise students’ achievement
significantly is student self-assessment (Chappuis & Stiggins, 2002; Rolheiser & Ross, 2001).
A self-assessment is the process by which the student gathers information about and reflects
on his or her own learning. It is the student’s own assessment of personal progress in
knowledge, skills, processes, or attitudes. Self-assessment leads a student to a greater
awareness and understanding of himself or herself as a learner” (Ministry of Education, 2013,
p. 3).
That is why the authors of this paper prompted them to investigate the effectiveness of
the self-assessment to the grade eight students of the Laboratory High School.
Statement of the Problem
It is the purpose of this study to determine the effect of self-assessment in improving
the performance of the 8th grade students of the Laboratory High School
Specifically, the study sought to find answers to the following research questions:
1. What is the performance of the students in the pre and posttest?
2. Is there a significant difference between the performance of the controlled and
experimental groups?
3. What is the attitude level of the respondents in the pre and post test?
4. Is there a significant difference between the attitudes of the controlled and
experimental groups?
Hypotheses
The following hypotheses were tested:
1. There is no significant difference between the respondents’ performance of the
2. There is no significant difference between the respondents’ attitude of the controlled
and experimental groups
Scope and Delimitation of the Study
The respondents of this study were purposively chosen based on the results of the test
and a five-point-scale checklist administered to all the four blocks of grade eight students of
the Laboratory High School during the school year 2013-2014.
The result of this study is limited to the result of the validated pre and post test
administered as a primary basis for students’ performances prior and after the treatment.
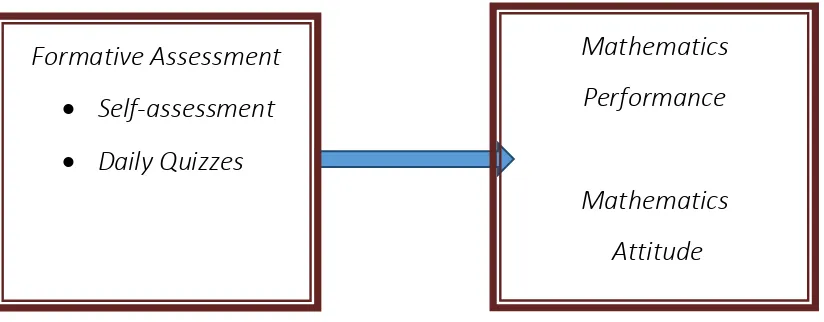
Conceptual Framework
This study is backed by the theory of self-regulation. Under this theory, students tend
to be more productive and will likely to improve on their endeavor when they are personally
aware of their own strengths and limitations in learning. Thus, the assumption is through
self-assessment wherein students are given the opportunity to be self-aware of their own learning,
the outcome will likely to occur significantly positive in the both performance and in attitude
as illustrated in the foregoing model.
[image:3.595.76.488.345.506.2]
Figure 1
Conceptual Model
1.3 Studies of Self-Assessment and Rubric Use
Having examined the theoretical arguments, the question of empirical evidence arises.
Several studies of the effectiveness of student self-assessment have been undertaken. One
such study by Olina and Sullivan (2002) investigated the effect of teacher- and
self-evaluation on student learning and self-efficacy of 189 Latvian high school students and their
6 teachers in science classrooms. Using ratings of student projects, posttest scores, student
attitude surveys, and teacher attitude surveys, Olina and Sullivan compared the learning gains
Mathematics
Performance
Mathematics
Attitude
Formative Assessment
Self-assessment
of three groups of students: a teacher-evaluation condition, a self-plus-teacher evaluation
condition, and a no-evaluation condition. The results were interesting. Students in the
teacher- and self-plus-teacher-evaluation groups outperformed students in the no-evaluation
group, as expected. However, the effect produced on student attitudes provides great
evidence for the benefits of self-assessment. Although students in the no-evaluation group
reportedly enjoyed conducting experiments more than the other students, Olina and Sullivan
report that ―students in the self-plus-teacher evaluation group had greater confidence about their ability to independently conduct experiments in the future than the other two groups‖ (p.
19). This lends credibility to theories of assessment leading to greater student
self-efficacy.
Another notable study was conducted by Andrade, Wang, Du, and Akawi (2009) on
the relation between long- and short-term rubric use (including assessment) and
efficacy for writing by 268 elementary and middle school students. Although average
self-efficacy ratings of all condition groups increased over time, Andrade, et al. reported a greater
increase in self-efficacy of girls in the treatment group (using rubrics to check their work)
than in the control group. The effect of the rubrics on self-efficacy of boys appeared to be
statistically insignificant. To explain these results, the authors relied on research on
attribution theory stating:
[G]irls tend to be more concerned with mastering a writing task than do boys,
who, on average, tend to be more concerned with showing someone else that
they are capable. Our findings regarding the differences in increases in
self-efficacy after self-assessment may reflect these different achievement goals:
Girls may derive more satisfaction and confidence from self-generated
evidence of progress on a writing assignment than do boys, who seek
confirmation of progress from others, including perhaps their teachers and
peers. (Andrade, et al., 2009, p. 296)
Thus, the researchers concluded, self-assessment shielded female students from
―potentially debilitating effects of negative adult feedback‖ (p. 296). This may have led girls
to attribute shortcomings to effort, not inherent ability, which allowed them to see how they
could improve. This, in turn, led to increased self-efficacy ratings. ―The boys in the study,
however, might have been less influenced by the presence of the rubric because they placed
less value on their own feedback‖ (p. 296).
A quasi-experimental pre and posttest method of research with pre and posttest
matched group design was used in this study. In this design, two groups are pre tested and
matched in terms of certain variables and as in this study, gender and the performance in the
pre-test (Calderon, 2013). One group, called the treatment group, was exposed to the use of
self-assessment while the other group, called the control group, was exposed to the
conventional formative assessment which is the daily quizzes. After the experimental period
which covers the whole grading period, the two groups were given the same test covering the
subject matter studied during the period (post test). In this study, two experiments were
conducted by two different teachers. The four blocks of the grade eight students were handled
by two teachers with two blocks each. Two experiments were made so as to verify and
compares results for a more valid conclusions. In has been ensured that all other variables
except the independent variable were kept constant or equal during the experimental period.
The excess of the achievement of both groups between the pre and posttest will be attributed
to the assessment method and the excess of the achievement of the experimental group over
the achievement of the control group is attributed to the experimental factor. The matched
group experimental design was employed so as to eliminate one variable which is the
sectioning which was believed that may affect the result of the experiment.
Population and Sample Size
The following table shows the number of samples taken from this study.
Table1
Distribution of the Respondents of the Study
Groups No. of
Students
No. of
Samples
with match
Experiment A Section Amethyst Treatment 1 34 19
Section Tourmaline Controlled 1 34 19
Experiment B Section Opal Treatment 2 35 16
Section Onyx Controlled 2 34 16
Table 1 shows the distribution of the respondents. The numbers of students enrolled in
each section or blocks are almost the same, however, 19 pairs or 55.88% were obtained in
were in terms of gender and the pre-test performance of the students which was administered
prior to the experimentation.
Sampling Technique
The sampling technique used in this study was a purposive sampling technique. The
purposive sample is selected from a population by an arbitrary method. This method is
decided on the basis of available information thought to be representative of the total
population or by intuition on the basis of criteria deemed to be self-evident (Macaballug,
2009). This kind of sampling is a probability sampling and therefore subjected to a
non-parametric test.
Description of Respondents
The respondents of the study are grade 8 students of the Laboratory High School
during the school year 2013-2014. The grade 8 respondents with a matched in the experiment
were included in the study.
Research Instrument
The primary instruments used in this study are the assessment tools used by the
teachers in their day to day conduct of the lesson. Among which are the samples of questions
and rubrics which were used by the students to self-assess their own work which are
individual, pairs or groups.
Another instrument was the pre and posttest which were validated through item
analysis. The pre and posttest is parallel test covering the same content and level of difficulty.
The pretest was one of the researchers’ bases in matching the respondents while the posttest
served as basis for the performance of the respondents.
The attitude scale was used to determine the respondents’ attitude in math class.
Attitude scale is of five parts namely the: selecting a math class with five indicators; time and
place for studying with six indicators; study strategies for the class with eleven indicators;
math test with seven indicators; and anxiety with four indicators. Two equivalent set of this
scale was made which were also parallel one which was administered prior to the experiment
while the other one was administered after the experiment.
Statistical Treatment of Data
Since the data was obtained from a non-random sampling, the statistical tool used is a
whether significant difference exist between two independent groups, the Wilcox on
Rank-Sum Test will be used. This is a counterpart of a t-test in the parametric test. Also mean and
standard deviation were also used to describe the performance and attitude of the students.
The performance scale can be interpreted through the following arbitrary values:
Score Verbal interpretation
0-10 Unsatisfactory (US)
11-20 Fair Satisfactory (FS)
21-30 Satisfactory (S)
31-40 Very Satisfactory (VS)
41-50 Outstanding (O)
Also, the following arbitrary scale will be used to describe the attitude level of the
respondents.
Score Verbal interpretation
4.21-5.00 Strongly Agree -Very High
3.41-4.20 Agree - High
2.61-3.40 Fair - Average
1.81-2.60 Disagree -Low
1.0-1.80 Strongly Disagree - Very Low
Results and Discussions
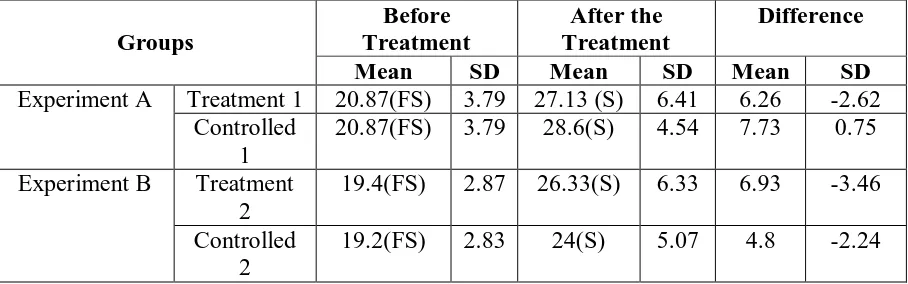
Table 2
Mean Performance and Standard Deviations of the respondents in the Pre and Post
Test Groups Before Treatment After the Treatment Difference
Mean SD Mean SD Mean SD
Experiment A Treatment 1 20.87(FS) 3.79 27.13 (S) 6.41 6.26 -2.62 Controlled
1
20.87(FS) 3.79 28.6(S) 4.54 7.73 0.75
Experiment B Treatment 2
19.4(FS) 2.87 26.33(S) 6.33 6.93 -3.46
Controlled 2
19.2(FS) 2.83 24(S) 5.07 4.8 -2.24
Table 2 displays the mean and standard deviations of the two experiments conducted. In all of
the four groups, an increase in the mean are observed. Difference among the pre and posttest
are 6.26 and 7.73 in Experiment A while 6.33 and 5.07 in experiment B. This remarkable
increase in the mean implies that after the grading period in which the teacher discussed the
lesson, there is indeed a positive change in the performance whether or not a treatment was
made.
It implies that a traditional form of assessment and the self-assessment are both effective
assessment strategy. It is therefore undeniably claimed that the traditional assessment form is
by giving only quizzes is still indispensible.
Table 3
Difference between Performances of the Respondents in the Post Test
Groups
Mean Computed
t-value Critical Value Interpretation Experiment A
Treatment 1 27.13
166.5 123 No Difference
Controlled 1 28.6
Experiment
B
Treatment 2 26.33
96 83 No Difference
Controlled 2 24
Table 3 shows the corresponding computed and critical values of the two groups in each of
the experiment. The computed values of 166.5 and 96 are less than the critical value of 123
difference between the performance of students who are exposed to the use of
self-assessment and those that are not. It further implies that the use of self-self-assessment is better
[image:9.595.68.524.160.311.2]than the traditional one.
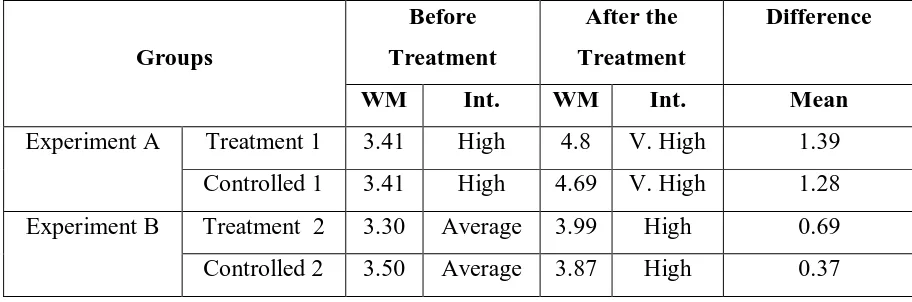
Table 4
Difference between Respondents Attitude before and after the Treatment
Groups
Before
Treatment
After the
Treatment
Difference
WM Int. WM Int. Mean
Experiment A Treatment 1 3.41 High 4.8 V. High 1.39
Controlled 1 3.41 High 4.69 V. High 1.28
Experiment B Treatment 2 3.30 Average 3.99 High 0.69
Controlled 2 3.50 Average 3.87 High 0.37
Table 4 displays the students’ means and corresponding verbal interpretations of the
attitude level. Experiment A and B in both the controlled and experimental group mark a
significant change positively in their attitude as reflected from the mean difference of 1.39,
1.28, 0.69 and 0.37, respectively.
This change in the attitude might be the influence of the assessment employed by the
[image:9.595.63.533.536.705.2]teacher.
Table 5
Difference between the Attitude of the Treatment and Controlled Group after the
Experiment
Groups
WM Computed
t-value
Critical
Value
Interpretation
Experiment
A
Treatment 1 4.67
119 123 There is a
difference Controlled 1 4.96
Experiment
B
Treatment 2 3.99
79.95 83 There is a
Table 5 shows the computed and critical values of the experiments. The computed
values are less than the critical values, thus rejection of the null hypothesis is rejected, and
therefore, there is a significant difference between the groups of students who are exposed to
the use of self assessment than those who are not.
This is the same with the findings of the other researcher (e.g. Olina and Sullivan
(2002)), wherein groups who were exposed to the use of self –assessment outperformed the
grouped which are not exposed.
Conclusions
1. Self-assessment and the traditional formative strategy such as giving daily quizzes are
both effective
2. The grade 8 students of the Laboratory High School improved their performance in
mathematics
3. The use of self – assessment does not directly increased mathematics performance
however it does affect in the attitude.
Recommendations
1. Encourage teachers to vary their assessment strategies and include self-assessment
strategy
2. Conduct trainings and seminars to teachers pertaining to the preparation of self
assessment , administering and scoring of self-assessment
3. Create modules, books and other instructional materials which are rich in
self-assessment activities.
References
Black, P and Harrison C. Lee, Marshall, B & William D. (2004) Working inside the
black box: Assessment for learning in the classroom. Phi Delta Kappan.
Ministry of Education, (2006) A guide to effective instruction in
Mathematics,k-8,volume 4. Toronto, Assessment and home connections. ON: Queen’s Printer for
Ontario.
Olina , Z & Sullivan, H.J. (2002) Effects of teacher and self assessment on student
performance. Paper presented atthe annual convention of the American
Education Research Association, April 1-5,2002, New Orleans ,LA.
Rolheiser, C., &Ross, J. (2001) Student self-evaluation : What research says and
what practice show. Retrieved December 28, 2014 from
http://www.cdl.org/resource-library/articles/selfeval.php.
Stiggins, R., & Chapuis, J (2006) What a difference a word makes: Assessmenmt
FOR learning Rather than assessment OF learning helps student succed.
Journal of Staff Development.
Stiggins, R. (2008). An introduction to student-involved assessment FOR learning.