R E S E A R C H A R T I C L E
Open Access
Fast and reliable detection of toxic
Crotalaria
spectabilis
Roth. in
Thunbergia laurifolia
Lindl.
herbal products using DNA barcoding coupled
with HRM analysis
Sahachat Singtonat and Maslin Osathanunkul
*Abstract
Background:Nowadays, medicinal plants are used as a popular alternative to synthetic drugs. Many medicinal plant products have now been commercialized throughout various markets. These products are commonly sold in processed or modified forms such as powders, dried material and capsules, making it almost impossible to accurately identify the constituent species. The herbal plant known as‘Rang Chuet’in Thai has been widely used as remedies for various ailments. However, two medicinal plants species,Thunbergia laurifoliaandCrotalaria spectabilisshare this name. Duo to the similarity in nomenclature, the commercial products labeled as‘Rang Chuet’could be any of them. Recently, the evidence of hepatotoxic effects linked to use ofC. spectabiliswere reported and is now seriously concern. There is a need to find an approach that could help with species identification of these herbal products to ensure the safety and efficacy of the herbal drug.
Methods:Here DNA barcoding was used in combination with High Resolution Melting analysis (Bar-HRM) to
authenticateT. laurifoliaspecies. Four DNA barcodes includingmatK,rbcL,rpoCandtrnLwere selected for use in primers design for HRM analysis to produce standard melting profiles of the selected species. Commercial products labeled as‘Rang Chuet’were purchased from Thai markets and authentication by HRM analyses.
Results:Melting data from the HRM assay using the designed primers showed that the two‘Rang Chuet’species could easily be distinguished from each other. The melting profiles of the all four region amplicons of each species are clearly separated in all three replicates. The method was then applied to authenticate products in powdered form. HRM curves of all ten test samples indicated that three of the tested products did not only contain theT. laurifoliaspecies.
Conclusion:The herbal drugs derived from different plants must be distinguished from each other even they share the same vernacular name. The Bar-HRM method developed here proved useful in the identification and authentication of herbal species in processed samples. In the future, species authentication through Bar-HRM could be used to promote consumer trust, as well as raising the quality of herbal products.
Background Herbal medicines
Natural products from plants have played a considerable role in the way of life of people around the world since ancient times. Plant products have been consumed as food and used as medicinal remedies. An enormous number of scientific reports highlight the benefits of
using medicinal plants and herbs as an alternative to modern synthetic drugs [1]. It is clear that medicinal plants are a popular alternative to synthetic drugs. Ac-cording to the World Health Organization [2], over 70% of the world’s population in developing countries uses herbal products. Many medicinal plant products have now been commercialized. These products are com-monly sold in processed or modified forms such as pow-ders, dried material, tablets, capsules and tea bags, making it almost impossible to accurately identify the constituent species [3–5]. Because of this, consumer * Correspondence:[email protected]
Department of Biology, Faculty of Science, Chiang Mai University, Chiang Mai 50200, Thailand
safety could be a concern. Misidentification of the con-stituent plants may lead to the inclusion of undesirable, unrelated species, with a potential health risk to the end users. Substitution of the product’s ingredients either intentionally or inadvertently can have negative effect on both consumers and producers. Because of these cation issues, any measures that may aide in the identifi-cation of herbal products would be beneficial. Many species from the Acanthaceae family are considered in Thailand to have health benefits, several species (Acan-thus ebracteatus,Andrographis paniculata,Rhinacanthus nasutusandThunbergia laurifolia) are now included on the Thai National List of Essentials Medicine (NLEM; Thailand). These Acanthaceae species are commonly used in Thai household as remedies for various ailments and thus are regularly sold on the markets throughout Thailand. There is a need to find an approach that could help with the quality control of these herbal products to ensure both the satisfaction and safety of consumers.
Thunbergia laurifolia is one of common Thai medi-cinal plant with various used such as antipyretic, detoxi-fication against insecticides, alcoholic and metallic poisons.T. laurifoliacommonly known in Thai as‘Rang
Chuet’ has been used in Thailand as a natural remedy
for decades. Commercial products of ‘Rang Chuet’ in
tea, capsule, and powder forms in herbal markets are claimed to have beneficial effects on human health. However, confusion has arisen because of the similarity in the vernacular names of the plants. In Thailand, there are at least three species are being called ‘Rang Chuet’, one of these is Crotalaria spectabilis. There are several
documentations reported that seeds and leaves of C.
spectabilis contain pyrrolizidine alkaloids which causes
Hepatotoxicity in humans and mammals [6–10]. Due to
the fact that, Rang Chuet was immensely sold in Thailand local markets and used as household remedy in form of processed products. Therefore it is almost
im-possible for consumer to know exactly which ‘Rang
Chuet’ products they are buying so this could be a real big issue and is now seriously concern.
Molecular species identification
Recently, many works have been focused on authentica-tion or detecauthentica-tion of species substituauthentica-tion of herbal prod-ucts. Molecular techniques like RFLP and RAPD were developed for Rang Chuet identification [4, 5]. Both RFLP and RAPD technique showed a potential in dis-crimination of the two Rang Chuet (T. laurifoliaand C. spectabilis) species but the disadvantage of RFLP is not only relatively time consuming but the RFLP also re-quires a large amount of sample, although RAPD tech-nique is fast but many [11–14] show unstable results and sometimes unreproducible.
In the past decade, DNA barcoding (short DNA se-quence) is proved to be useful for identifying and categor-izing species [15]. To date, several Rang Chuet barcodes
from various plastid genome regions including matK,
rpl16, rps16, trnL and rbcL were produced [5, 14]. Al-though DNA barcoding is proven useful for species-level identification of plants [16, 17], there are some limitations to the technique. It is costly and time-consuming, and not easy to apply routinely in developing countries due to fi-nancial constraints and limited availability of perishable chemicals and consumables. This leads us in searching for new fast, reliable, less time consuming and inexpensive method for species identification and authenticating of medicinal plants. Here we applied DNA barcoding with high resolution melting (Bar-HRM) analysis for species identification and authentication of ‘Rang Chuet’products sold on Thai markets. The use of Bar-HRM for taxonomic identification and the detection of adulteration in food and agriculture products has been reported recently [18–20]. In this study we evaluate whether the tech-nique is equally useful for species discrimination in constituents of Thai folk medicinal plant.
Materials and methods Primers used for HRM analysis
Sequences of the plastid DNA regions, matK, rbcL,
rpoC and trnL of selected medicinal plants from the
family Acanthaceae (Thunbergia spp.) and Fabaceae
(Crotalaria spp.) were extracted from GenBank (at the
end of September 2013) using the key phrases “the
name of locus” and“the name of species” in the anno-tations. Generally, sequences obtained from public da-tabases, including GenBank, are of low quality with no known associated herbarium vouchers. For this reason, all of the sequences were subjected to critical evalu-ation and any low-quality sequences were removed. After processing, multiple alignments were made from the selected sequences using MEGA6 [21] and variable characters were calculated for the design of primers to be used for high resolution melting (HRM) analysis. Two main criteria were considered in order to obtain successful results in the HRM analysis: (i) the primer pair should generate a PCR product not exceeding 300 bp, (ii) the primer pairs should cover enough variable sites to enable discrimination among the tested species and any other variation site from sequence of conspecifics.
Plant samples and DNA isolation
Sirikit Botanic Garden (QSBG). The plant material was ground with liquid nitrogen, and then used for DNA ex-traction with the Nucleospin Plant® II kit (Macherey-Nagel, Germany) following the manufacturer’s instruction. DNA concentrations of all samples were equally adjusted (20 ng/μL). The DNA was stored at−20° C for further use.
Real-time PCR amplification and high resolution melting (HRM) analysis
To determine the characteristic melting temperature (Tm) for each sample that could be used to distinguish
the two different ‘Rang Chuet’ medicinal plants, PCR amplification, DNA melting, and end point fluorescence level acquiring PCR amplifications were performed in a
total volume of 20 μL on an Eco™ Real-Time PCR
sys-tem (Illumina®, San Diego, USA). The reaction mixture
contained 10 ng genomic DNA, 10 μL of MeltDoctor™
HRM Master Mix (Applied Biosystems, California,
USA), 0.2 μL of 10 mM forward and reverse primers.
The four pairs of candidate barcoding primers nucleo-tide composition are shown in Table 2. The real-time PCR reaction conditions are as following; an initial de-naturing step at 95 °C for 5 min followed by 35 cycles of
95 °C for 30 s, 57 °C for 30 s, and 72 °C for 20 s. Subse-quently, the PCR amplicons were denatured for HRM at 95 °C for 15 s, and then annealed at 50 °C for 15 s to form random DNA duplexes. Melting curves were gen-erated after the last extension step. The temperature was increased from 60 to 95 °C at 0.1 °C/s. The melting
curves were analyzed with the Eco™ software (version
[image:3.595.58.539.98.450.2]4.0.7.0). After obtaining the suitable primers for the HRM in order to test the sensitivity of the developed
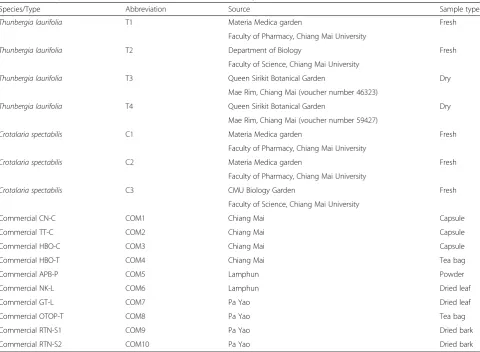
Table 1Plants species and commercial products included in this study
Species/Type Abbreviation Source Sample type
Thunbergia laurifolia T1 Materia Medica garden Fresh
Faculty of Pharmacy, Chiang Mai University
Thunbergia laurifolia T2 Department of Biology Fresh
Faculty of Science, Chiang Mai University
Thunbergia laurifolia T3 Queen Sirikit Botanical Garden Dry
Mae Rim, Chiang Mai (voucher number 46323)
Thunbergia laurifolia T4 Queen Sirikit Botanical Garden Dry
Mae Rim, Chiang Mai (voucher number 59427)
Crotalaria spectabilis C1 Materia Medica garden Fresh
Faculty of Pharmacy, Chiang Mai University
Crotalaria spectabilis C2 Materia Medica garden Fresh
Faculty of Pharmacy, Chiang Mai University
Crotalaria spectabilis C3 CMU Biology Garden Fresh
Faculty of Science, Chiang Mai University
Commercial CN-C COM1 Chiang Mai Capsule
Commercial TT-C COM2 Chiang Mai Capsule
Commercial HBO-C COM3 Chiang Mai Capsule
Commercial HBO-T COM4 Chiang Mai Tea bag
Commercial APB-P COM5 Lamphun Powder
Commercial NK-L COM6 Lamphun Dried leaf
Commercial GT-L COM7 Pa Yao Dried leaf
Commercial OTOP-T COM8 Pa Yao Tea bag
Commercial RTN-S1 COM9 Pa Yao Dried bark
Commercial RTN-S2 COM10 Pa Yao Dried bark
Table 2Four primers used for HRM analysis and identification Primer name Nucleotide sequence (5’to 3’) Ta(°C) Expected
size (bp)
matK _F CTTCTTATTTACGATTAACATCTTCT 57 160
matK _R TTTCCTTGATATCGAACATAATG
rbcL_F GGTACATGGACAACTGTGTGGA 57 150
rbcL _R ACAGAACCTTCTTCAAAAAGGTCTA
rpoC_F CCSATTGTATGGGAAATACTT 57 170
rpoC _R CTTACAAACTAATGGATGTAA
trnL_F GAATCGACCGTTCAAGTATCC 57 150
[image:3.595.306.539.599.732.2]method, real-time PCR and barcoding with HRM were carried out on standard samples, prepared by mixing fine powder of T. laurifoliawithC. spectabilis in differ-ent proportions of 1, 3, 6, 12, 25, and 50 %. Real-time PCR amplification was performed as described earlier.
Authenticating test of herbal products sold on Thai local markets
Ten herbal products labeled as ‘Rang Chuet’ were pur-chased for this study. All of the products were acquired in processed forms (Table 1). Total DNA was extracted from each sample and then used in HRM analysis in order to identify the characteristic melting temperature (Tm).
Results and discussion Data mining and primers used
The amplification of the four selected locus from two ‘Rang Chuet’ medicinal plant species (T. laurifolia and C. spectabilis) was performed using specific primers
cor-responding to the matK, rbcL, rpoC and trnL barcode
region. All sequences ofThunbergiaspp. were extracted from GenBank and the variable characters and average %GC content was calculated for all samples (Table 3). Data was present for most markers of the target species,
except for rpoC. The total number of sequences
re-trieved for the respective markers were:matK11 (7
spe-cies); rbcL 6 (6 species), trnL 27 (20 species). The
absence ofrpoCsequences for the target species was
re-solved by selecting random rpoC sequences from
Gen-Bank, which is supported by the high universality of rpoC [17, 22]. Two sequences ofC. spectabilis were re-trieved (matKandtrnL).
For matK 5, rbcL 6, rpoC 5 and trnL 19 sequences
were deemed useful for further analysis (Table 4). An alignment of all useful sequences was made, and the primers flanking regions of each marker ranging from 150 to 170 bp were analyzed (Table 2). Reed and Wittwer [23] found that suitable length for HRM ana-lysis should be 300 bp or less for optimal results.
Both the sequence length and the nucleotide variation within sequences influence the dissociation energy of the base pairs and result in different Tm values. The matK
amplicon sequences were observed to have higher nu-cleotide variation than the amplicons of the other
regions, at 30.67%. The relative nucleotide variation within amplicons was found to be as follows: matK> rpoC>trnL>rbcL (Table 3). The forward and reverse
matK primers matched the consensus sequence of the
target species at the binding sites in only 15 out of 26 sites (57.69%) and 19 out 23 of sites (82.61%), respect-ively (Table 3). High universality at the initial bases of the primer site is crucial for primer annealing and subse-quent elongation initiation by the DNA polymerase. The matKlocus is one of the most variable plastid coding re-gions and has high interspecific divergence and good discriminatory power. However, it can be difficult to amplify with the standard barcoding primers due to high substitution rates at the primer sites [24, 25]. TherbcL, rpoC and trnL primer pairs were expected to be a suit-able primer for HRM analysis for discrimination be-tween the tested plant species. These primers were nearly identical in base similarity to the mined consen-sus sequence (Table 3).
The average %GC content of amplicons was calculated in order to predict variation in melting curves for the different markers.trnLhad the lowest average %GC
con-tent, with 34.50%, followed by matK, rpoC and rbcL,
[image:4.595.57.538.650.733.2]with 35.20, 41.85, 44.26 and 46.60% respectively (Table 3).
Finding suitable primer pairs for discrimination between T. laurifoliaandC. spectabilis
The four primers sets were used for the amplification
of DNA-fragments from all seven samples (two ‘Rang
Chuet’species), and the amplicons were analyzed using
HRM to define Tm. (Table 5). The expected length of
amplified products from matK, rbcL, rpoC, and trnL
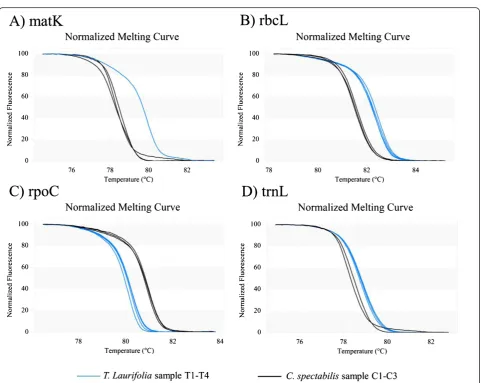
are 160 bp, 150 bp, 170 bp, and 150 bp, respectively. The melting profiles of all amplicons are illustrated in Fig. 1a-1d. The analysis is presented by means of
con-ventional derivative plots, which show that the Tm
value of each species is represented by a peak. The samples of the two different species could be easily dis-tinguished using HRM analysis with all four primer pairs. The melting profiles of seven samples of the two ‘Rang Chuet’ species (T. laurifolia and C. spectabilis) can be divided into two groups. All T. laurifolia sam-ples (T1-T4) are grouped together and the other group
contains all C. spectabilis samples (C1-C3). Although
Table 3Characteristics of sequences and primers for high resolution melting analysis
Regions matK rbcL rpoC trnL
Available species 5 6 5 19
Variable characters (%) 30.67 10.07 10.19 8.90
Conserved forward primer/total (%) 15/26 (57.69) 21/22 (95.45) 18/21 (85.71) 19/21 (90.48)
Conserved reverse primer/total (%) 19/23 (82.61) 25/25 (100) 19/21 (90.48) 24/27 (88.89)
the four primer pairs tested could be used to discrimin-ate T. laurifolia from C. spectabilis, the rpoC region was chosen for further analysis as it would help in demonstrating that Bar-HRM could work well as a sequencing-free method for plant identification. In addition, therpoCregion was used as an analytical tar-get in HRM analysis has been shown to be effective for the detection and quantification of Lens culinaris and Lathyrus clymenumadulterations [18, 22].
Quantitative detection ofT. laurifoliaadulterants with Bar-HRM analysis
Detecting limit of adulteration in T. laurifolia products
using the developed method with rpoC primers was
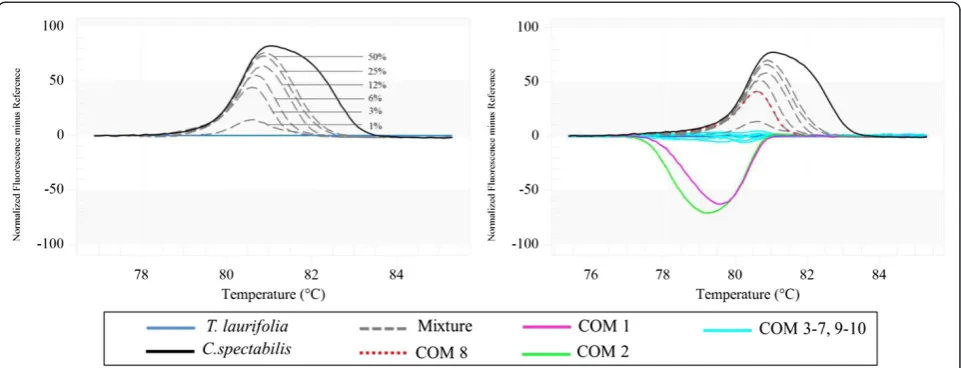
tested. Figure 2a shows the results of the validation method with T. laurifolia spiked with C. spectabilis in different proportions. These results depict the analysis for one experiment as all three experiments gave similar results thus showing very good reproducibility. The process of theT. laurifoliaamplicon dissociation reveals the level of contamination resulting from adulteration as the presence of increasing quantity ofC. spectabilisinto theT. laurifoliaDNA alters the shape and shifts propor-tionally the melting curve, compared to the curve of pure T. laurifolia DNA. By applying this approach, we were able to detect adulterations as low as 1 % (Fig. 2a).
Identification of herbal species in commercial products Constituent species in herbal products bought from markets in Thailand were investigated to assess the reli-ability of information regarding their ingredients, as the herbal products are often sold in processed forms. Ten herbal products labeled as‘Rang Chuet’were purchased
and examined (Table 1). The HRM analysis using rpoC
primers was then performed to identify the species in the products.
The examination of the HRM difference curve of all tested samples using T. laurifolia curve as baseline re-vealed that seven out of ten samples (COM3-7 and 9–10) produce curves in which the same asT. laurifolia’s with a 90% confidence interval, suggesting that the products con-tainT. laurifolia(Fig. 2b). The melting curve of one tested
sample (COM8) was found between T. laurifolia and C.
spectabilislines, it could be indicated that the commercial COM8 was probably be admixture ofT. laurifoliaandC. spectabilis with around 3% of the toxic C. spectabilis in the product as show in Fig. 2b. However, we cannot rule out the possibility of the COM8 may actually not be con-taminated with the toxicC. spectabilis but other species. In addition, the results of the analysis also reveal that the two remaining samples (COM1 and COM2) were much likely not contain any of the two‘Rang Chuet’species but some other species instead (Fig. 2b). In order to find con-taminated or substituted species in COM1 and COM2, DNA barcoding is one of the best solutions. As can be
seen from Newmaster et al [26] work, DNA barcoding
[image:5.595.58.287.121.609.2]was performed to detect the adulteration and substitution of herbal drugs and found that herbal products sold on the markets were contaminated or substituted with alter-native plant species that are not listed on the labels as they are replaced entirely by powdered rice, wheat and soybean. Thus, DNA sequencing ofrbcLregion was carried out to identify species in these two products. The blast result showed that COM1 and COM2 have a similarity in their
Table 4Sequences of four plastid regions (matK, rbcL, rpoCand
trnL) were retrieved from GenBank (NCBI) for each of the species with accession number
Species Regions
trnL matK rbcL rpoC
Crotalaria spectabilis HM208335 AB649973 -
-Thunbergia affinis AB817377 - -
-EU315886
Thunbergia alata AF061820 HQ384512 HQ384878
-EU529130 AF531811
EU315887
Thunbergia angulata EU315888 - -
-Thunbergia arnhemica EU315889 - -
-Thunbergia atriplicifolia EU315890 - -
-Thunbergia battiscombei EU315891 - -
-Thunbergia capensis EU315892 AM234783 AM234783
-Thunbergia coccinea EU529131 HG004920 KF181493
-Thunbergia convolvulifolia EU315894 - -
-Thunbergia dregeana EU315895 - -
-Thunbergia erecta AF061821 AB649972 -
-JQ764614
EU529132
EU315896
Thunbergia fragrans U315897 - -
-Thunbergia galpinii EU315898 - -
-Thunbergia grandiflora EU315899 AB649971 JQ590086
-JQ586429
JQ586428
JQ586427
Thunbergia gregoryi EU315901 - -
-Thunbergia guerkeana EU315901 - -
-Thunbergia kirkii EU315902 - -
-Thunbergia laurifolia - AB649970 -
-Thunbergia mysorensis - - AY008828
-Thunbergia petersiana EU315904 - -
-Thunbergia pondoensis EU315905 - -
-Thunbergia togoensis EU315906 - -
-Fig. 1Melting curve profiles of amplicons obtained from each primer set. The normalized plot of each primer pairmatK(a),rbcL(b),rpoC(c), andtrnL(d) shows the differentiation of melting temperature (Tm) of each amplicon from each species, generated by high resolution melting
[image:6.595.59.538.113.237.2](HRM) analysis
Table 5The values of melting temperature (°C) with standard deviations gaining form high resolution melting (HRM) analysis using
matK,rbcL, rpoC andtrnLprimers ofT. laurifoliaandC. spectabilisspecies
Species Abbreviation Tm (oC)
matK rbcL rpoC trnL
T. laurifolia T1 - 82.5 ± 0.07 80.2 ± 0.12 78.8 ± 0.07
T. laurifolia T2 - 82.4 ± 0.14 80.1 ± 0.15 78.9 ± 0.07
T. laurifolia T3 77.9 ± 0.35 82.3 ± 0.14 80.2 ± 0.00 78.8 ± 0.00
T. laurifolia T4 - 82.4 ± 0.07 80.2 ± 0.07 78.8 ± 0.14
C. spectabilis C1 75.6 ± 0.21 81.6 ± 0.00 80.9 ± 0.06 78.4 ± 0.14
C. spectabilis C2 75.3 ± 0.07 81.6 ± 0.07 80.9 ± 0.06
-C. spectabilis C3 75.4 ± 0.21 81.5 ± 0.00 80.8 ± 0.00 78.2 ± 0.00
[image:6.595.58.542.313.696.2]sequences toMoringa oleifera and Andrographis panicu-lata, respectively (Additional file 1: Table S1). The finding provides evidence that substitution in herbal products sold Thai local market is presented and this substitution could be a serious issue for consumers. Due to the fact that Bar-HRM has allowed us easily determine herbal species in processed products sold on the markets within 2 h. Bar-HRM method developed in this study therefore pose a po-tential to be a great tool in detection of adulteration and/ or substitution in herbal products especially in processed forms.
Conclusions
Several studies have shown that substitution of plant species occurs in herbal medicines, and this in turn poses a challenge to herbal authentication as adverse re-actions might be due to substituted ingredients. Bar-HRM has proven to be a cost-effective and reliable method for the identification of species in this study of Thai medicinal plants. The hybrid method of DNA bar-coding and High Resolution Melting is dependable, fast, and sensitive enough to distinguish between species. In this study, the tested products were traded as processed powder, which impedes conventional identification. Be-cause of this processing it is almost impossible to iden-tify which herbal species are present in products using morphological characters. The DNA extracted from all products tested yielded a specific amplification product
with the designedrpoC Bar-HRM primers. The
normal-ized HRM curves for the amplicons, from the two‘Rang Chuet’species (T. laurifoliaand the toxic C. spectabilis) and ten herbal products, based on HRM analysis with
barcode marker rpoC were easily distinguished, and
seven of the ten tested samples were successfully
assigned to the T. laurifolia species. However, three
products were found to contain other plant species or admixture of the two ‘Rang Chuet’ species. Therefore, the developed method could be easily used for rapid and low-cost authentication of herbal products. Interestingly, designing primer for HRM analysis commonly depends
on information in database but here even none of rpoC
sequences of Thunbergia could be found on the
data-base, the rpoC primer pair derived from DNA data of
other random medicinal plant species is found to be work well in this analysis. It is demonstrated that this method has not only shown the great beneficial value for universality test which might be useful in other medi-cinal species but also flexibility using DNA region with limited data likerpoC.
Additional file
Additional file 1: Table S1.Blast results of two commercial product
rbcLsequences.
Competing interests
The authors declare that they have no competing interests.
Authors’contributions
MO planned the study; SS and MO collecting the plant materials, performed the study and conducted the data analysis; MO prepared data for the additional supporting file; SS and MO wrote the manuscript; MO thoroughly revised the manuscript; Both authors discussed the results and approved the final manuscript.
Acknowledgements
This research was financially supported by CMU Junior Research Fellowship Program and New Researcher Grant from the Thailand Research Fund (grant number TRG5780027) awarded to MO. We would like to thank Queen Sirikit Botanical Garden in Mae Rim, Chiang Mai Thailand for allowing us accessing dry samples for using in this experiment.
Fig. 2Melting curves obtained by high resolution melting analysis of the two‘Rang Chuet’species.aSpecific amplicons and applied to reference mixtures containing 50, 25, 12, 6, 3 and 1 % ofC. spectabilisinT. laurifolia.bDifference graph of ten commercial herbal products usingT. laurifolia
[image:7.595.58.539.89.273.2]Received: 30 October 2014 Accepted: 22 May 2015
References
1. Kunle OF, Egharevba HO, Ahmadu PO. Standardization of herbal medicines - A review. IJBC. 2012;4(3):101–12.
2. Oreagba IA, Oshikoya KA, Amachree M. Herbal medicine use among urban residents in Lagos, Nigeria. BMC Complement Altern Med. 2011;11:117. 3. Chan EWC, Lim YY. Antioxidant activity ofThunbergia laurifoliatea. JTFS.
2006;18:130–6.
4. Suwanchaikasem P, Chaichantipyuth C, Amnuoypol S, Sukrong S. Random amplified polymorphic DNA analysis ofThunbergia laurifoliaLindl. and its related species. JMPR. 2012;6:2955–61.
5. Suwanchaikasem P, Phadungcharoen T, Sukrong S. Authentication of the Thai medicinal plants sharing the same common name‘Rang Chuet’:
Thunber gia laurifolia,Crotalaria spectabilis, andCurcumaaff.amadaby
combined techniques of TLC, PCR-RFLP fingerprints, and antioxidant activities. ScienceAsia. 2013;39:124–33.
6. Chan EWC, Eng SY, Tan YP, Wong ZC. Phytochemistry and pharmacological properties ofThunbergia laurifolia: A Review. Phcogj. 2011;3:1–6.
7. Flores AS, de Azevedo Tozzi AMG, Trigo JR. Pyrrolizidine alkaloid profiles in
Crotalariaspecies from Brazil: Chemotaxonomic significance. Biochem Syst
Ecol. 2009;37:459–69.
8. Leverett LD, Woods M. The GenusCrotalaria(Fabaceae) in Alabama. Castanea. 2012;77:364–74.
9. Schultze AE, Roth RA. Chronic pulmonary hypertension-the monocrotaline model and involvement of the hemostatic system. J Toxicol Environ Health B Crit Rev. 1998;1:271–346.
10. Wonkchalee O, Boonmars T, Aromdee C, Laummaunwai C, Khunkitti W, Vaeteewoottacharn K, Sriraj P, Aukkanimart R, Loilome W, Chamgramol Y, Pairojkul C, Wu Z, Juasook A, Sudsarn P. Anti-inflammatory, antioxidant and hepato protective effects ofThunbergia laurifoliaLinn. on experimental opisthor chiasis. Parasitol Res. 2012;111:353–9.
11. Prenner GA, Bush A, Wise R, Kim W, Dommier L, Kasha K, Laroche A, Scoles G, Molnar SJ, Fedak G. Reproducibility of random amplified polymorphic DNA (RAPD) analysis among laboratories. Genome Res. 1993;2:341–5. 12. Yang X, Quiros C. Identification and classification of celery cultivars with
RAPD markers. Theor Appl Genet. 1993;86:205–12.
13. Qiu JJ, Li YP. Random amplified polymorphic DNA analysis of eel genome. Cell Res. 1999;9:217–23.
14. Carvalho VP, Ruas CF, Ferreira JM, Moreira RMP, Ruas PM. Genetic diversity among maize (Zea maysL.) landraces assessed by RAPD Markers. Genet Mol Biol. 2004;27:228–36.
15. Techen N, Parveen I, Pan Z, Khan IA. DNA barcoding of medicinal plant material for identification. Current Opinion In Biotech. 2014;25:103–10. 16. von Crautlein M, Korpelainen H, Pietilainen M, Rikkinen J. DNA barcoding: a
tool for improved taxon identification and detection of species diversity. Biodivers Conserv. 2011;20:373–89.
17. Kress WJ, Wurdack KJ, Zimmer EA, Weigt LA, Janzen DH. Use of DNA barcodes to identify flowering plants. PNAS. 2005;102(23):8369–74. 18. Ganopoulos I, Madesis P, Darzentas N, Argiriou A, Tsaftaris A. Barcode High
Resolution Melting (Bar-HRM) analysis for detection and quantification of PDO“Fava Santorinis”(Lathyrus clymenum) adulterants. Food Chem. 2012;133:505–12.
19. Jaakola L, Suokas M, Haggman H. Novel approaches based on DNA barcoding and high-resolution melting of amplicons for authenticity analyses of berry species. Food Chem. 2010;123:494–500.
20. Sakaridis I, Ganopoulos I, Argiriou A, Tsaftaris A. A fast and accurate method for controlling the correct labeling of products containing buffalo meat using High Resolution Melting (HRM) analysis. Meat Sci. 2013;94:84–8. 21. Tamura K, Stecher G, Peterson D, Filipski A, Kumar S. MEGA6: Molecular
Evolutionary Genetics Analysis Version 6.0. Mol Biol Evol. 2013;30:2725–9. 22. Kool M, Korshunov A, Remke M, Jones DTW, Schlanstein M, Northcott PA,
Cho YJ, Koster J, Schouten-van Meeteren A, van Vuurden D, Clifford SC, Pietsch T, von Bueren AO, Rutkowski S, McCabe M, Collins VP, Backlund ML, Haberler C, Bourdeaut F, Delattre O, Doz F, Ellison DW, Gilbertson RJ, Pomeroy SL, Taylor MD, Lichter P, Pfister SM. Molecular subgroups of medulloblastoma: an international meta-analysis of transcriptome, genetic aberrations, and clinical data of WNT, SHH, Group 3, and Group 4 medulloblastomas. Acta Neuropathol. 2012;123:473–84.
23. Bosmali I, Ganopoulos I, Madesis P, Tsaftaris A. Microsatellite and DNA-barcode regions typing combined with high resolution melting (HRM) analysis for food forensic uses: a case study on lentils (Lens culinaris). Food Res Int. 2012;46:141–7. 24. CBOL Plant Working Group. A DNA barcode for land plants. Proc Natl Acad
Sci. 2009;106:12794–7.
25. Hollingsworth PM. Refining the DNA barcode for land plants. Proc Natl Acad Sci. 2011;108:19451–2.
26. Newmaster SG, Grguric M, Shanmughanandhan D, Ramalingam S, Ragupathy S. DNA barcoding detects contamination and substitution in North American herbal products. BMC Med. 2013;11:222.
Submit your next manuscript to BioMed Central and take full advantage of:
• Convenient online submission
• Thorough peer review
• No space constraints or color figure charges
• Immediate publication on acceptance
• Inclusion in PubMed, CAS, Scopus and Google Scholar
• Research which is freely available for redistribution