GE-International Journal of Management Research
Vol. 4, Issue 2, Feb 2016 IF- 4.316 ISSN: (2321-1709)© Associated Asia Research Foundation (AARF)
Website: www.aarf.asia Email : editor@aarf.asia , editoraarf@gmail.com
ANALYSIS OF INVESTMENT PREFERENCES OF VENTURE
CAPITAL FIRMS
Dr. Naseeb Ahmad
Sr. Asstt. Professor
Department of Commerce & Business Studies
Jamia Millia Islamia (Central University), New Delhi – 110025
ABSTRACT
The paper is an attempt to analyze and understand the investment preferences of Venture
Capital firms and further, the preferences of Venture Capitalists were tested to find whether
it is homogeneous across different categories of Venture Capital firms. It is a common
perception that Venture Capitalists are inclined towards investing in those industries, which
have the potential to grow fast in a short span of time and hence their financing decisions are
largely dependent on the ability of the firm to grow their business exponentially. The paper is
based on primary data of a sample consisting of 15 Venture Capital firms operating in India.
Key Words: Venture Capital, Venture Capitalist, Investment Preferences, Investment
Process
Introduction
Objectives and Methodology
In this study an attempt is made to understand and evaluate the investment preferences of selected VC firms. The opinion and preferences of a sample of 15 venture capital firms operating in India has been collected through a combination of Structured Questionnaire, personal interviews, discussions and deliberations. The respondents were primarily contacted in several mentoring sessions, networking sessions, seminars and conferences organized by TIE (The Indus Entrepreneur) and IVCA (Indian Venture Capital Association) followed by subsequent personal visits.
To analyze the effect of various demographic and organizational characteristics of the VC firms’ towards their investment preferences the researcher attempted cross tabulation and computed contingency coefficient (C) and Chi- square statistics. The observations and findings are discussed below.
1.1 Sector/ Industry Preference
[image:2.595.67.530.540.768.2]The fact that Venture Capitalists prefer certain sectors/ industries has been also confirmed in the paper. The top three sectors preferred by VCs are IT & IT Enabled services, Pharma, Healthcare & life sciences and Manufacturing. IT & ITES seems to be a the most favourite sector preferred by 80% (12) of the firms, followed by Pharma, Healthcare & life sciences preferred by 66% (10) and Manufacturing sector was preferred by 60% (9) of the respondents. The other sectors, which were also catching the attention of the VCs, are Engineering & Construction, Banking & financial Services & Insurance.
Table 1.1 Sector/ Industry Preferences
Sector/ Industry Type Frequency %
IT & IT Enabled Services 12 80.00
Manufacturing 9 60.00
Engineering & Construction 6 40.00
Banking, Financial Services &
Insurance 6 40.00
Pharma / Healthcare & Life Sciences 10 66.70 Agriculture & Food Processing 0 0.00
Education & Consultancy services 4 26.70
Retail 1 6.70
Other 2 13.30
It would be of interest to analyse whether industry preferences differ across different characteristic features of VCs. The industry preferences were tested across the different features to find any significant relationship. The observations and findings are explained below;
1.1.1 Location & Industry Preferences
[image:3.595.112.483.378.624.2]The cross tabulation results revealed that there is no significant difference among the firms located in Delhi and outside Delhi regarding industry preference. It appears that all firms irrespective of their location have the same preference for various industry types. The only exception seems to be the Education & Consultancy Services, where it has been observed that the Delhi based VC firms does not prefer it. In contrast a majority (67%) of firms based outside Delhi prefer Education & Consultancy Services for funding.
Table 1.1.1 Location & Industry Preference
Industry Type X2 C df P
IT & IT Enabled Services 2.50 .378 1 .114
Manufacturing 0.185 .110 1 .667
Engineering & Construction 2.269 .362 1 .132 Banking, Financial Services &
Insurance
0.417 .164 1 .519
Pharma / Healthcare & Life Sciences .000 .000 1 1.000
Media & Entertainment .096 .080 1 .756
Education & Consultancy services 8.182 .594 1 .004
Retail 1.607 .311 1 .205
Other .096 .080 1 .756
X2= Pearson Chi-Square, C=Contingency Coefficient, D=Degree of Freedom, P=Level of
1.1.2 Firm type & Industry Preference
[image:4.595.99.490.278.527.2]An attempt was made to test whether there is a significant relationship between a type of firm and preference for a certain industry. The result showed that there is a significant difference regarding preference to three industries namely; Manufacturing, Education & Consultancy Services and Retail. All the firms (100%) which are either affiliate of Bank / Financial Institutions or Govt. affiliated firms in comparison to only a few (33%) among private independent preferred the manufacturing industry. In case of education & consultancy services also, all Govt. affiliated firm preferred it but the rest of firms have shown little or no interest in it. The same was the case with Retail, only the Govt. affiliated firms (50%) preferred it.
Table 1.1.2 Firm Type & Industry Preference
Industry Type X2 C df P
IT & IT Enabled Services 2.500 .378 2 .287
Manufacturing 6.667 .555 2 .036
Engineering & Construction 2.616 .385 2 .270 Banking, Financial Services &
Insurance
2.616 .385 2 .270
Pharma / Healthcare & Life Sciences 1.625 .313 2 .444
Media & Entertainment 1.538 .305 2 .463
Education & Consultancy services 7.045 .565 2 .030
Retail 6.964 .563 2 .031
Other 2.981 .407 2 .225
1.1.3 Firm’s Domicile & Industry Preference
There seems to be no significant relationship as far as domicile status and industry preference is concerned, except in case of Media & Entertainment; the domestic VC firms do not prefer it at all whereas some of the foreign VCs (33%) reported to consider it for funding.
Table 1.1.3 Firm’s Domicile & Industry Preference
Industry Type X2 C df P
IT & IT Enabled Services 2.500 .378 1 .114
Manufacturing .417 .164 1 .519
Engineering & Construction .185 .110 1 .667 Banking, Financial Services &
Insurance
[image:4.595.107.487.282.522.2]Pharma / Healthcare & Life Sciences .000 .000 1 1.000 Media & Entertainment 3.462 .433 1 .063 Education & Consultancy services .227 .122 1 .634
Retail .714 .213 1 .398
Other 1.538 .305 1 .215
1.1.4 Form of Organisation & Industry Preference
[image:5.595.130.467.35.145.2]It has been observed that the form of organization and industry preference do not have any significant relationship, all the firms with different form of organization were found to have more or less similar preference for the various types of industries.
Table – 1.1.4 Form of Organisation & Industry Preference
Industry Type X2 C df P
IT & IT Enabled Services 2.500 .378 2 .287
Manufacturing .741 .217 2 .690
Engineering & Construction 2.407 .372 2 .300 Banking, Financial Services &
Insurance
1.667 .316 2 .435
Pharma / Healthcare & Life Sciences 1.400 .292 2 .497 Media & Entertainment .385 .158 2 .825 Education & Consultancy services .682 .209 2 .711
Retail .714 .213 2 .700
Other 1.538 .305 2 .463
1.1.5 Year of Establishment & Industry Preference
Table – 1.1.5 Year of Establishment & Industry Preference
Industry Type X2 C df P
IT & IT Enabled Services 5.625 .522 2 .060
Manufacturing 1.250 .277 2 .535
Engineering & Construction 2.986 .407 2 .225 Banking, Financial Services &
Insurance
2.986 .407 2 .225
Pharma / Healthcare & Life Sciences 5.625 .522 2 .060 Media & Entertainment 1.298 .282 2 .523 Education & Consultancy services .256 .129 2 .880
Retail 2.946 .405 2 .229
Other 3.462 .433 2 .177
1.1.6 Fund Size & Industry Preference
The relationship between the size of the fund and industry preference was probed and it has been found that only in case of IT & ITES there is a significant difference across the firms with varying size of funds. All the firms with small and large size of fund reported their preference for this industry as compared to only some (40%) of the firms in medium fund size category.
Table – 1.1.6 Fund Size & Industry Preference
Industry Type X2 C df P
IT & IT Enabled Services 7.500 .577 2 .024
Manufacturing .000 .000 2 1.000
Engineering & Construction 1.667 .316 2 .435 Banking, Financial Services &
Insurance
1.667 .316 2 .435
Pharma / Healthcare & Life Sciences .600 .196 2 .741 Media & Entertainment 1.154 .267 2 .562 Education & Consultancy services .682 .209 2 .711
Retail 2.143 .354 2 .343
1.1.7 SEBI Registration & Industry Preference
[image:7.595.126.466.135.375.2]The significant relationship between the SEBI registration status and industry preference have found only in case of Media & Entertainment. None of the firms registered with SEBI preferred it whereas some (40%) of the non-registered firms expressed interest in it.
Table – 1.1.7 SEBI Registration & Industry Preference
Industry Type X2 C df P
IT & IT Enabled Services 1.875 .333 1 .171
Manufacturing 1.250 .277 1 .264
Engineering & Construction 1.250 .277 1 .264 Banking, Financial Services &
Insurance
1.250 .277 1 .264
Pharma / Healthcare & Life Sciences .600 .196 1 .439 Media & Entertainment 4.615 .485 1 .032 Education & Consultancy services .682 .209 1 .409
Retail .536 .186 1 .464
Other 1.154 .267 1 .283
1.2 Investment Preference
The VCs generally are not only focused on some industries as discussed above but also have some reservations regarding various other aspects of investments like stage of investment, size of investment in a venture, financing instrument (debt/ equity or hybrid), geographical location of the venture, and exit related issues. In the study, these dimensions have been explored and the observations and findings are discussed in the following paragraphs.
1.2.1 Stage preference
Table – 1.2 Stage of Investment Preferences Reported by the VCF
N = 15
Stages of Investments Frequency Percentages
Seed / Startup 7 46.7
First / Early stage 13 86.7
Second / later stage 10 66.7
Expansion 5 33.3
Turnaround 0 0
PIPE 6 40
1.2.2 Investment Size preferences
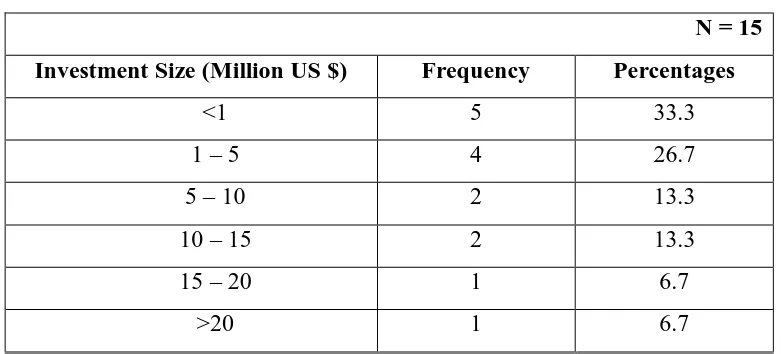
In the study, an attempt is made to find the range of investments preferred by VCs. It has been observed that the size of investment reported by the VC firms varies from less than a million US Dollars to more than US$ 20mn. Majority of the firms (60%) prefer to invest up to US$ 5mn, a range of investment between US$ 5 mn – 15 mn were preferred by 27% of the respondents and there were only two firms which prefer to invest more than US$ 15mn.
Table – 1.2.2 Investment Size Preferences
N = 15
Investment Size (Million US $) Frequency Percentages
<1 5 33.3
1 – 5 4 26.7
5 – 10 2 13.3
10 – 15 2 13.3
15 – 20 1 6.7
1.2.3 Investment Instrument preference
There are different types of instruments being used in VC funding ranging from equity and equity linked hybrid instruments to debt instruments. In the present study majority (60%) of the firms reported to prefer equity and equity related instruments, the rest of the firms equally prefer redeemable preference share (20%) and convertible debt (20%).
Table – 1.2.3 Investment Instrument Preferences Reported by the VCF
N = 15
Financing Instrument Preferred: Frequency Percentages
Equity 9 60
Redeemable Pref. Share 3 20
Convertible Debt 3 20
1.2.4 Geographic Preference
The geographic preference too has been an important issue in VC investment preference. In the study it has been observed that a good number of the firms (47%) prefer to invest on all India level whereas some of them (27%) reported to have a global outlook and are ready to invest in any part of the world. among the rest, two prefer to invest in Asian subcontinent and two reported to invest only in a selected Indian region.
Table – 1.2.4 Geographic Preferences for Investment Reported by the VCF
N = 15
Geographic Preference: Frequency Percentages
Within a particular Indian
Region 2 13.3
All India 7 46.7
Within Asia 2 13.3
Worldwide 4 26.7
1.2.5 Exit preference
Exit issues are the most crucial part of the VC investment process. With the booming stock market, the IPO (Initial Public Offering) is reported to be the most sought after exit route reported by a majority (67%) of the firms. The second option was Merger & Acquisitions reported by 27% of the firms.
Table – 1.2.5 Exit Preferences Reported by the VCF
N = 15
Frequency Percentages
Exit Route Preference:
IPO 10 66.7
Merger & Acquisitions 4 26.7
Sale through Stock Exchange 1 6.7
Exit Period Preference:
3- 5 years 12 80
5- 7 years 3 20
1.2.6 Non- Disclosure Agreement issues
Among the VCs, the willingness to sign the Non Disclosure Agreement (NDA) is found to be very low as most of the respondents (60%) made it clear that they would not like to sign the NDA. The rest (40%) are of the view that it is not a big issue and they may sign if it is essential.
Table – 1.2.6 Investment Preferences Reported by the VCF
N = 15
Stages of Investments Frequency Percentages
Willingness to Sign the
Non Disclosure Agreement
No 9 60
Doesn't matter/ May Sign 6 40
An attempt was made to test the investment preferences of VCs to examine whether it differs across the various characteristic features of VCs. The observation and findings are discussed below;
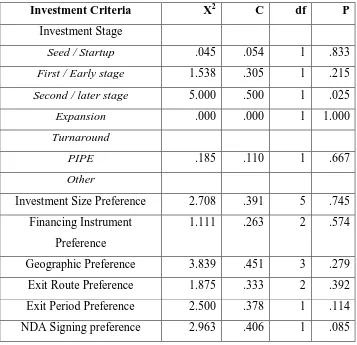
1.2.7 Location & Investment Preferences
Table – 1.2.7 Location & Investment Preferences
Investment Criteria X2 C df P
Investment Stage
Seed / Startup .045 .054 1 .833
First / Early stage 1.538 .305 1 .215
Second / later stage 5.000 .500 1 .025
Expansion .000 .000 1 1.000
Turnaround
PIPE .185 .110 1 .667
Other
Investment Size Preference 2.708 .391 5 .745 Financing Instrument
Preference
1.111 .263 2 .574
Geographic Preference 3.839 .451 3 .279
Exit Route Preference 1.875 .333 2 .392
Exit Period Preference 2.500 .378 1 .114
NDA Signing preference 2.963 .406 1 .085
1.2.8 Firm Type & Investment Preferences
All type of firms seems to have similar preference with reference to stage of investment as no significant difference has been found between the type of firms and investment preferences. However, regarding geographic preference the private independent firms have had a global outlook whereas most of the affiliate of bank/ financial institutions (75%) preferred firms within India and all the Govt. affiliated firms prefer to invest in a selected region only as they are established with the same objective.
Table – 1.2.8 Firm Type & Investment Preferences
Investment Criteria X2 C df P
Investment Stage
Seed / Startup .045 .054 2 .978
First / Early stage 1.538 .305 2 .463
Second / later stage 1.500 .302 2 .472
Expansion .375 .156 2 .829
PIPE 2.616 .385 2 .270 Other
Investment Size Preference 12.917 .680 10 .228 Financing Instrument
Preference
2.407 .372 4 .661
Geographic Preference 16.652 .725 6 .011 Exit Route Preference 3.938 .456 4 .415 Exit Period Preference .590 .195 2 .744 NDA Signing preference 3.542 .437 2 .170
1.2.9 Firm’s Domicile Status & Investment Preferences
[image:12.595.136.460.35.229.2]Some differences have been observed between the firm’s domicile status and their investment preferences. A majority of domestic firms (67%) reported greater preference for seed/ startup stage funding in comparison to very few foreign firms (16%). An overwhelming majority of foreign firms (83%) as compare to few domestic firms (11%) mostly preferred PIPE Deals. In terms of geographic preference the domestic firms are confined to investing within India whereas foreign firms are ready to invest in firms anywhere in the world. In exit route preference most of the domestic firms (88%) preferred IPO whereas a majority of foreign firms preferred M&A (67%) and some of them preferred IPO (33%).
Table – 1.2.9 Firm’s Domicile Status & Investment Preferences
Investment Criteria X2 C df P
Investment Stage
Seed / Startup 3.616 .441 1 .057
First / Early stage .096 .080 1 .756
Second / later stage 1.250 .277 1 .264
Expansion .000 .000 1 1.000
Turnaround
PIPE 7.824 .585 1 .005
Other
Investment Size Preference 6.458 .549 5 .264 Financing Instrument
Preference
2.963 .406 2 .227
Exit Route Preference 8.333 .598 2 .016 Exit Period Preference 1.111 .263 1 .292 NDA Signing preference 2.269 .362 1 .132
1.2.10 Form of Organisation & Investment Preferences
[image:13.595.137.460.210.567.2]The investment preferences of the firms seems to be similar irrespective of the form of organization of the firms as no significant difference has been observed between the forms of organization of the firms and their investment preferences.
Table – 1.2.10 Form of Organisation & Investment Preferences
Investment Criteria X2 C df P
Investment Stage
Seed / Startup 1.250 .277 2 .535
First / Early stage 1.538 .305 2 .463
Second / later stage 1.400 .292 2 .497
Expansion .600 .196 2 .741
Turnaround
PIPE 2.407 .372 2 .300
Other
Investment Size Preference 13.067 .682 10 .220 Financing Instrument
Preference
6.519 .550 4 .164
1.2.11 Year of Establishment & Investment Preferences
[image:14.595.137.462.150.503.2] [image:14.595.61.530.635.767.2]The age of firms and their investment preferences were found to be independent across various investment parameters. Only in case of expansion stage where it was observed that most of the mid age firms (75%) prefer to invest at expansion stage in comparison to very few of the new firms (33%) and the older firms do not prefer it at all.
Table – 1.2.11 Year of Establishment & Investment Preferences
Investment Criteria X2 C df P
Investment Stage
Seed / Startup 1.138 .266 2 .566
First / Early stage 3.462 .433 2 .177
Second / later stage .225 .122 2 .894
Expansion 5.625 .522 2 .060
Turnaround
PIPE 1.319 .284 2 .517
Other
Investment Size Preference 12.588 .675 10 .248 Financing Instrument
Preference
3.278 .423 4 .512
Geographic Preference 7.884 .587 6 .247 Exit Route Preference 2.263 .362 4 .688 Exit Period Preference 2.292 .364 2 .318 NDA Signing preference .625 .200 2 .732
1.2.12 Fund Size & Investment Preferences
The investment preference of firms and the size of funds they are managing do not have any significant relationship except in case of geographic preference. A majority (80%) of the firms with large size of funds have had a global approach towards investment whereas the small and mid size firms prefer to invest within India only.
Table – 1.2.12 : Fund Size & Investment Preferences
Investment Criteria X2 C df P
Investment Stage
Seed / Startup 2.143 .354 2 .343
Second / later stage .600 .196 2 .741
Expansion .600 .196 2 .741
Turnaround
PIPE 5.000 .500 2 .082
Other
Investment Size Preference 13.800 .692 10 .182 Financing Instrument
Preference
4.667 .487 4 .323
Geographic Preference 17.143 .730 6 .009 Exit Route Preference 5.400 .514 4 .249 Exit Period Preference 2.500 .378 2 .287 NDA Signing preference 5.000 .500 2 .082
1.2.13 SEBI Registration & Investment Preferences
[image:15.595.128.470.35.294.2]A majority the firms (80%) not registered with SEBI were found to prefer PIPE deals than the SEBI registered firms (20%). Similarly, an overwhelming majority of the non-registered firms (80%) have had a global preference for investment whereas the registered firms prefer to invest within India only.
Table – 1.2.13 : SEBI Registration & Investment Preferences
Investment Criteria X2 C df P
Investment Stage
Seed / Startup 2.143 .354 1 .143
First / Early stage 1.154 .267 1 .283
Second / later stage .600 .196 1 .439
Expansion .600 .196 1 .439
Turnaround
PIPE 5.000 .500 1 .025
Other
Investment Size Preference 9.375 .620 5 .095 Financing Instrument
Preference
2.000 .343 2 .368
Exit Period Preference 1.875 .333 1 .171 NDA Signing preference 1.250 .277 1 .264
1.2.14 IVCA Membership & Investment Preferences
[image:16.595.116.480.205.570.2]The membership of IVCA and the investment preference have not found to have any significant relationship. Both the members as well as non-members expressed similar preferences towards various investment related issues.
Table – 1.2.14 IVCA Membership & Investment Preferences
Investment Criteria X2 C df P
Investment Stage
Seed / Startup .268 .132 1 .605
First / Early stage 1.298 .282 1 .255
Second / later stage .000 .000 1 1.000
Expansion .000 .000 1 1.000
Turnaround
PIPE .069 .068 1 .792
Other
Investment Size Preference 5.625 .522 5 .344 Financing Instrument
Preference
1.111 .263 2 .574
Geographic Preference 1.384 .291 3 .709 Exit Route Preference 1.875 .333 2 .392 Exit Period Preference .417 .164 1 .519
1.3 Conclusion
It has been observed that VCs are inclined towards investing in those sectors/ industries, which have the potential to scale up quickly. The top three sectors, which are attractive to VCs, were IT & IT enabled services, pharma & healthcare services and manufacturing. Further, the industry preferences of VCs were statistically tested to find whether the industry preference is uniform across different characteristics of VCs.
The result obtained with statistical analysis showed some significant difference across different category of VC firms towards industry preferences, which were explained earlier. The major differences observed were; The VC firms, which are affiliate of Banks / Financial Institutions and Govt. affiliated, are more inclined to invest in the manufacturing sector as compare to the private independent firms. Similarly, in case of education & consultancy services only Govt. affiliated firms prefer to invest while others have little or no interest. The It & ITES sector and Pharma & healthcare sector has attracted the old and mid age firms whereas the newly established firms were not much interested in them. The media and entertainment industry has failed to convince the SEBI registered firms as none of them was interested in this sector whereas some of the non registered firms shown interest in it. The IT & ITES industry and the Engineering & Construction sector were preferred by the only those firms which are IVCA members.
REFERENCES
AVCJ, Asian Venture Capital Journal, 2014.
Cope J., Cave F. Eccles S.(2004), Attitudes of Venture Capital Investors towards Entrepreneurs with Previous Business Failure. Venture Capital, April- September 2004, Vol. 6, No. 2/3, pp. 147-172.
Damodaran Aswath, “Valuing Young, Start-Up & Growth Companies: Estimation Issues & Valuation Challenges” New York University-Stern School of Business, 2009. Dossani, R. and Desai (2006) Accessing Early Stage risk Capital in India, Standard University.
Douglas Cumming, “Contracts & Exits in Venture Capital Finance”, New York University, 2008
G.Tyge Payne, Justin L. Davis, Curt B. Moore, R.Greg Bell, “The Deal Structuring Stage of Venture Capitalist Decision Making Process: Exploring Confidence & Control.”, 2010.
Gerard Hoberg, Brent D.Goldfarb, David Kirsch, Alexander J. Triantis, “Does Angel Participation Matter? An analysis of early venture financing”, 2009.
Gibbs J.M. “Venture Capital Markets for Regeneration of Industry”
Gompers, P. and J.Lerner (2001), “The Venture Capital Revolution.” Journal of Economic Perspectives Vol.15(2) pp. 145-168.
Gumming, D., 2006 Adverse Selection and Capital Structure: Evidence from Venture Capital, Entrepreneurship: Theory & Practice 30(2):155-183.
Harding, R.(2002), Plugging the Knowledge Gap: An International Comparision of the Role for Policy in the venture Capital Market, Venture Capital ,Vol. 4, No. 1, pp.59-76. Indian Venture Capital and Private Equity Directory 2014
Kenney, M. & Dossani R., (2002), Creating an Environment: Developing Venture Capital in India, University of California, Berkeley.
Marjan Petreski, “The Role of Venture Capital in Financing Small Businesses”,Journal of Entrepreneurship & Finance (2006).
Mason, C.M. and Harrisont, R.T.(2002), The geography of Venture Capital Investments in the U.K., Trans Inst Br Geogr NS(Royal Geographical Society) pp.427-451
Xuan Tian, “The Causes & Consequences of Venture Capital Stage Financing”, Journal of Financial Economics, 2010.