A Monthly Double-Blind Peer Reviewed Refereed Open Access International e-Journal - Included in the International Serial Directories.
GE-International Journal of Engineering Research (GE-IJER) ISSN: (2321-1717)
1 | P a g e
GE-International Journal of Engineering Research
Vol. 4, Issue 8, August 2016 IF- 4.721 ISSN: (2321-1717)© Associated Asia Research Foundation (AARF) Publication
Website: www.aarf.asiaEmail : editor@aarf.asia , editoraarf@gmail.com
ANALYZING THE THERMAL INSULATING CHARACTERISTICS OF
BANANA FIBER
Krishpersad Manohar
Department of Mechanical and Manufacturing Engineering, University of the West Indies, St.
Augustine, Trinidad and Tobago.
ABSTRACT
Development of biodegradable thermal insulation such as banana fiber to perform
comparable to conventional non-biodegradable insulation will mitigate the environmental
issues presently faced with disposal. Empirical correlations were developed from
experimental data to predict the thermal conductivity variation of banana fiber with density
and mean test temperature for 25.4 mm, 38 mm and 50.4 mm thick loose-fill slab-like
specimens over the density range 20 kg/m3 to 120 kg/m3 and mean temperature range
between 20oC to 40oC. The equations predicted the characteristic behavior of decreasing
thermal conductivity to a minimum value with increasing density followed by increasing
thermal conductivity with further increase in density for the banana fiber. Also, the empirical
correlations showed the linear increase in thermal conductivity with mean test temperature
for the banana fiber, consistent with loose-fill thermal insulation. The mean percentage
difference between the calculated thermal conductivity values at the respective experimental
test conditions and the experimental data were within ±0.2%. The empirical correlations can
be used to determine the thermal conductivity of the banana fibre specimens at any
combination of mean test temperature and density within the range tested. The results
indicated by both the empirical correlations and the experimental data that the minimum
thermal conductivity of banana fibre insulation is within range normally associated with
A Monthly Double-Blind Peer Reviewed Refereed Open Access International e-Journal - Included in the International Serial Directories.
GE-International Journal of Engineering Research (GE-IJER) ISSN: (2321-1717)
2 | P a g e
KEYWORDS – Banana fiber, Building insulation, Fibrous insulation, Loose-fill insulation,
Thermal conductivity, Thermal insulation.
1. INTRODUCTION
Application of thermal insulation is widely used in industrial and domestic
applications. It is the most common mechanism for the reduction of heat transfer rate across
a thermal gradient. Presently, for domestic applications the use of inorganic building
insulating materials such as mineral wool, plastic foams, lightweight and cellular concrete,
polystyrene, foam glass, expanded perlite and fiberglass are commonplace [1]. Effective
building thermal insulation is the largest building energy conservation component that
directly impact on the cost of cooling. In recent times retrofitting, upgrading and refurbishing
of older buildings resulted in an increase in the amount of non-biodegradable insulation
material for disposal causing serious environmental concerns. This initiated research in many
countries to shift focus to the use of naturally occurring biodegradable fibrous thermal
insulation for buildings [2].
Published work indicated that materials such as coconut fiber, sugarcane fiber, cotton,
wheat straw, date palm leaves, oil palm fiber and other lignocellulose fibers are promising
alternatives for use as biodegradable, renewable, environmentally friendly building thermal
insulation [3, 4, 5]. Development of biodegradable thermal insulation to perform comparable
to the non-biodegradable insulation will mitigate the environmental issues presently faced.
Also, if managed effectively, naturally occurring fibrous materials can be obtained from
by-products of the agricultural industry and be a cheap, reliable and renewable material source
[6]. Over the life cycle of plant base fibrous material there can be a net reduction in CO2
emissions [5].
Banana fiber is a naturally occurring biodegradable material obtained from shredding
the discarded banana tree trunk. Due to the relatively high tensile strength of banana fibre it
is commonly used in high-quality textiles, ropes, yarn, paper, composite and burlap [7]. The
long banana fibers makes it attractive for use in forming slab-like flexible thermal insulation
batt for building wall cavity insulation. However, for this purpose an in-depth analysis of the
thermal insulating characteristics of the material is needed. In this study thermal conductivity
measurements were undertaken on slab-like specimens of banana fiber and the results
analyzed to develop empirical correlations to determine the thermal conductivity variation
A Monthly Double-Blind Peer Reviewed Refereed Open Access International e-Journal - Included in the International Serial Directories.
GE-International Journal of Engineering Research (GE-IJER) ISSN: (2321-1717)
3 | P a g e
2. THERMALCONDUCTIVITYEXPERIMENTALRESULTS
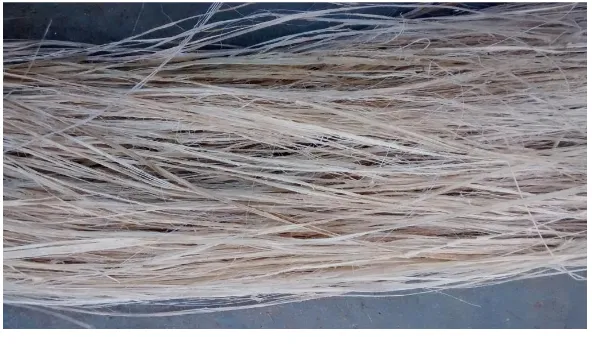
Banana fibre test specimens were prepared by randomly arranging the banana fibres
horizontally to form an insulation batt in square polystyrene frames of thickness 25.4 mm,
38 mm and 50.4 mm, respectively. Figure 1 shows a picture of the dried and sorted banana
[image:3.595.168.464.165.337.2]fibre.
FIGURE 1: DRIED AND SORTED BANANA FIBRE
The polystyrene frames were constructed from 25.4 mm strips with a thin plastic
base to hold the fibres from falling through. The inner dimensions of the specimen holder
was 254 mm x 254 mm. Test specimens were prepared at densities 20 kg/m3, 30 kg/m3, 40
kg/m3, 50 kg/m3, 60 kg/m3, 70 kg/m3, 80 kg/m3, 90 kg/m3, 100 kg/m3, 110 kg/m3 and 120
kg/m3, at the respective thickness of 25.4 mm, 38 mm and 50.4 mm. The minimum test
density was determined form the density at which the banana fibres settled under natural
conditions. The maximum test density was determined by the clamping force of the test
apparatus. The mass of fibre for the respective test specimens was calculated form the target
density and the known specimen holder volume.
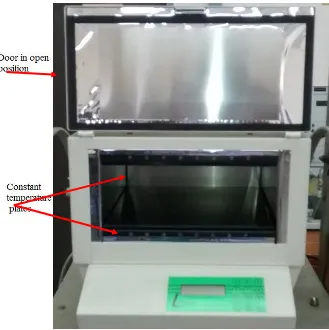
Thermal conductivity measurements were conducted using the LaserComp FOX 304
steady state thermal conductivity measurement apparatus which operated in accordance with
ASTM C-518-04, Standard Test Method for Steady-State Thermal Transmission Properties
by Means of the Heat Flow Meter Apparatus [8]. The FOX 304 measures thermal
conductivity under steady state one-dimensional test conditions with heat flow upwards via a
centrally located 102 mm X 102 mm heat flux transducer. The FOX 304 provided thermal
conductivity measurements within the range 0.005 W/m.K to 0.35 W/m.K with ± 0.2%
repeatability and ± 0.5% reproducibility (Figure 2).
A Monthly Double-Blind Peer Reviewed Refereed Open Access International e-Journal - Included in the International Serial Directories.
GE-International Journal of Engineering Research (GE-IJER) ISSN: (2321-1717)
4 | P a g e FIGURE 2: LASERCOMP FOX 304 IN OPEN POSITION
The machine was calibrated using NIST SRM 1450b, Standard Reference Material of
the National Institute of Standards and Technology with a 20oC temperature difference
between the plates and upward heat flow. The heat sink for the FOX 304 was provided by
an independent chilled water system and a circulating pump. The test results for the 25.4
mm, 38 mm and 50.4 mm specimens are shown on Table 1, Table 2 and Table 3,
[image:4.595.153.482.33.363.2]respectively.
TABLE 1: BANANA FIBRE EXPERIMENTAL THERMAL CONDUCTIVITY TEST
RESULTS - 25.4 MM THICK SPECIMEN
Density
(kg/m3)
Experimental Determined Thermal Conductivity (W/m.K)± 0.2%
20 ˚C 25 ˚C 30 ˚C 35 ˚C 40 ˚C
20 0.05397 0.05563 0.05729 0.05891 0.06079
30 0.04787 0.04917 0.05046 0.05176 0.05327
40 0.04310 0.04424 0.04541 0.04657 0.04777
A Monthly Double-Blind Peer Reviewed Refereed Open Access International e-Journal - Included in the International Serial Directories.
GE-International Journal of Engineering Research (GE-IJER) ISSN: (2321-1717)
5 | P a g e
60 0.04001 0.04092 0.04186 0.04256 0.04355
70 0.03930 0.04020 0.04112 0.04195 0.04285
80 0.03880 0.03949 0.03998 0.04075 0.04172
90 0.03923 0.03996 0.04070 0.04166 0.04276
100 0.04013 0.04080 0.04137 0.04202 0.04282
110 0.04187 0.04219 0.04276 0.04324 0.04366
[image:5.595.83.516.289.566.2]120 0.04421 0.04463 0.04532 0.04611 0.4754
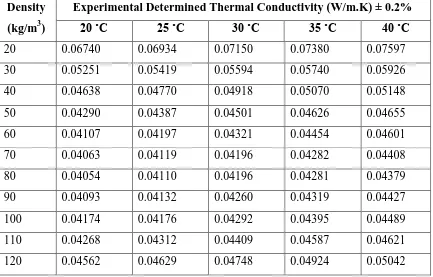
TABLE 2: BANANA FIBRE EXPERIMENTAL THERMAL CONDUCTIVITY TEST
RESULTS - 38 MM THICK SPECIMEN
Density
(kg/m3)
Experimental Determined Thermal Conductivity (W/m.K)± 0.2%
20 ˚C 25 ˚C 30 ˚C 35 ˚C 40 ˚C
20 0.06740 0.06934 0.07150 0.07380 0.07597
30 0.05251 0.05419 0.05594 0.05740 0.05926
40 0.04638 0.04770 0.04918 0.05070 0.05148
50 0.04290 0.04387 0.04501 0.04626 0.04655
60 0.04107 0.04197 0.04321 0.04454 0.04601
70 0.04063 0.04119 0.04196 0.04282 0.04408
80 0.04054 0.04110 0.04196 0.04281 0.04379
90 0.04093 0.04132 0.04260 0.04319 0.04427
100 0.04174 0.04176 0.04292 0.04395 0.04489
110 0.04268 0.04312 0.04409 0.04587 0.04621
[image:5.595.76.526.624.766.2]120 0.04562 0.04629 0.04748 0.04924 0.05042
TABLE 3: BANANA FIBRE EXPERIMENTAL THERMAL CONDUCTIVITY TEST
RESULTS – 50.4 MM THICK SPECIMEN
Density
(kg/m3)
Experimental Determined Thermal Conductivity (W/m.K)± 0.2%
20 ˚C 25 ˚C 30 ˚C 35 ˚C 40 ˚C
20 0.06679 0.06902 0.07135 0.07367 0.07533
30 0.05341 0.05499 0.05679 0.05855 0.05939
A Monthly Double-Blind Peer Reviewed Refereed Open Access International e-Journal - Included in the International Serial Directories.
GE-International Journal of Engineering Research (GE-IJER) ISSN: (2321-1717)
6 | P a g e
50 0.04612 0.04674 0.04747 0.04850 0.04985
60 0.04355 0.04443 0.04520 0.04576 0.04677
70 0.04231 0.04392 0.04611 0.04567 0.04648
80 0.04202 0.04275 0.04436 0.04484 0.04495
90 0.04389 0.04466 0.04529 0.04593 0.04495
100 0.04496 0.04509 0.04573 0.04607 0.04523
110 0.04647 0.04667 0.04740 0.04839 0.04958
120 0.04854 0.04921 0.05013 0.05141 0.05248
3. ANALYSIS
The experimental results (Tables 1–3) for the loose-fill banana fibre specimens at the
three thickness tested and at the five respective mean test temperatures all showed a decrease
in thermal conductivity with increase in density to a minimum value and then increase in
thermal conductivity with further increase in density [5, 9, 10, 11]. This trend is associated
with the behaviour of loose fill thermal insulation and therefore, the thermal conductivity, λ,
variation with density should satisfy the general empirical relationship associated with this
characteristic behaviour for materials of this nature as given by equation (1) [5, 12].
λ = a + bρ + c/ρ (1)
where λ is thermal conductivity in W/m.K, ρ is density in kg/m3, and a, b, c are numerical
constants.
Using the Method Least Squares the banana fibre experimental data for each test
condition was fitted in the form of equation (1) and the constants determined. This resulted in
an empirical correlation for each test condition as shown in equations (2) to (16).
For 25.4 mm thick specimen:-
At 20 ˚C mean temperature;
λ = 0.02294 + (0.12087 x 10⁻³)ρ + 0.5926/ρ (2)
At 25 ˚C mean temperature;
λ = 0.02404 + (0.11418 x 10⁻³)ρ + 0.6058/ρ (3)
At 30 ˚C mean temperature;
λ = 0.02478 + (0.11134 x 10⁻³)ρ + 0.6258/ρ (4)
At 35 ˚C mean temperature;
A Monthly Double-Blind Peer Reviewed Refereed Open Access International e-Journal - Included in the International Serial Directories.
GE-International Journal of Engineering Research (GE-IJER) ISSN: (2321-1717)
7 | P a g e At 40 ˚C mean temperature;
λ = 0.02549 + (0.11508 x 10⁻³)ρ + 0.6816/ρ (6)
For 38 mm thick specimen:-
At 20 ˚C mean temperature;
λ = 0.01214 + (0.19741 x 10⁻³)ρ + 1.0309/ρ (7)
At 25 ˚C mean temperature;
λ = 0.01264 + (0.19349 x 10⁻³)ρ + 1.0642/ρ (8)
At 30 ˚C mean temperature;
λ = 0.01276 + (0.19893 x 10⁻³)ρ + 1.1046/ρ (9)
At 35 ˚C mean temperature;
λ = 0.01185 + (0.21480 x 10⁻³)ρ + 1.1640/ρ (10)
At 40 ˚C mean temperature;
λ = 0.01163 + (0.22156 x 10⁻³)ρ + 1.2094/ρ (11)
For 50.4 mm thick specimen:-
At 20 ˚C mean temperature;
λ = 0.01587 + (0.19805 x 10⁻³)ρ + 0.9468/ρ (12)
At 25 ˚C mean temperature;
λ = 0.01646 + (0.19436 x 10⁻³)ρ + 0.9798/ρ (13)
At 30 ˚C mean temperature;
λ = 0.01740 + (0.19150 x 10⁻³)ρ + 1.0079/ρ (14)
At 35 ˚C mean temperature;
λ = 0.01401 + (0.22607 x 10⁻³)ρ + 1.1186/ρ (15)
At 40 ˚C mean temperature;
λ = 0.01615 + (0.20359 x 10⁻³)ρ + 1.1154/ρ (16)
Another characterise feature of loose-fill fibrous thermal insulation is an increase in
thermal conductivity with mean test temperature [13]. The test results for banana fibre for all
the density tested at the respective specimen thickness indicated a linear increase in thermal
conductivity with mean test temperature. The λ variation with mean test temperature can
A Monthly Double-Blind Peer Reviewed Refereed Open Access International e-Journal - Included in the International Serial Directories.
GE-International Journal of Engineering Research (GE-IJER) ISSN: (2321-1717)
8 | P a g e
ω(T) = d + e.T (17)
where ω(T) is an expression for the temperature dependence, d and e are numerical constants
, and T is the mean test temperature.
Using the Method of Least Squares to incorporate the linear increase in thermal
conductivity with mean test temperature resulted in a general empirical correlation for
determining λ in terms of temperature and specimen density for the banana fibre specimens
as shown in equations (18) to (20). The respective thermal conductivity value was calculated
form the empirical correlations for the experimental conditions reported and the percentage
difference between the theoretical and experimental λ determined. The results are shown on
tables 4 to 6.
The correlation for the 25.4 mm thick specimen;
λ = (0.0207 + 0.127 x 10⁻³
T) + (0.1234 x 10⁻³ – 0.2962-6 T)ρ + (0.4984 + 0.4414-2 T)/ρ (18)
The correlation for the 38 mm thick specimen;
λ = (0.01329 – 0.3616 x 10⁻⁴
T) + (0.1635 x 10⁻³ – 0.1392-5 T)ρ + (0.8405 + 0.9137-2 T)/ρ
(19)
The correlation for the 50.4 mm thick specimen;
λ = (0.01712 – 0.381 x 10⁻⁴
T) + (0.177 x 10⁻³ + 0.8556-6 T) ρ + (0.7482 + 0.9518-2 T)/ρ
[image:8.595.57.541.553.770.2](20)
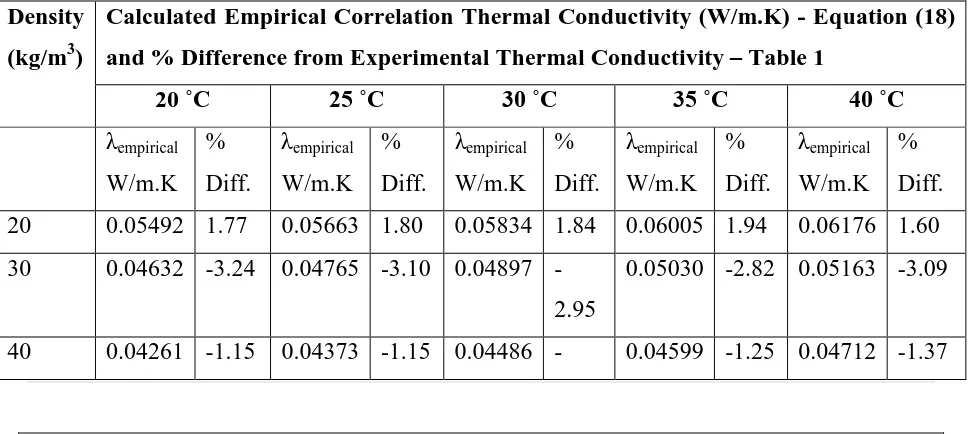
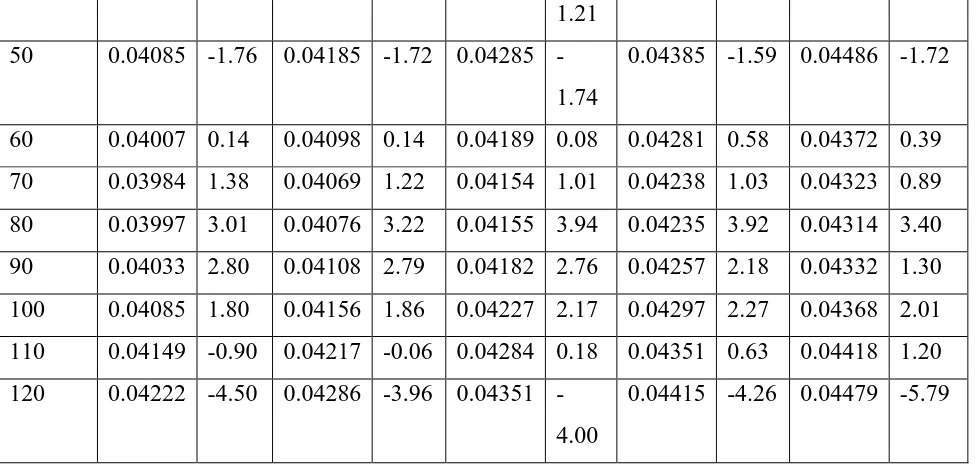
TABLE 4: PERCENTAGE DIFFERENCE BETWEEN THE CALCULATED EMPIRICAL
CORRELATION THERMAL CONDUCTIVITY FROM EQUATION (18) AND THE
EXPERIMENTAL RESULTS FROM TABLE 1 FOR 25.4MM THICK BANANA FIBRE
SPECIMN
Density
(kg/m3)
Calculated Empirical Correlation Thermal Conductivity (W/m.K) - Equation (18)
and % Difference from Experimental Thermal Conductivity – Table 1
20 ˚C 25 ˚C 30 ˚C 35 ˚C 40 ˚C
λempirical W/m.K % Diff. λempirical W/m.K % Diff. λempirical W/m.K % Diff. λempirical W/m.K % Diff. λempirical W/m.K % Diff.
20 0.05492 1.77 0.05663 1.80 0.05834 1.84 0.06005 1.94 0.06176 1.60
30 0.04632 3.24 0.04765 3.10 0.04897
-2.95
0.05030 -2.82 0.05163 -3.09
A Monthly Double-Blind Peer Reviewed Refereed Open Access International e-Journal - Included in the International Serial Directories.
GE-International Journal of Engineering Research (GE-IJER) ISSN: (2321-1717)
9 | P a g e 1.21
50 0.04085 1.76 0.04185 1.72 0.04285
-1.74
0.04385 -1.59 0.04486 -1.72
60 0.04007 0.14 0.04098 0.14 0.04189 0.08 0.04281 0.58 0.04372 0.39
70 0.03984 1.38 0.04069 1.22 0.04154 1.01 0.04238 1.03 0.04323 0.89
80 0.03997 3.01 0.04076 3.22 0.04155 3.94 0.04235 3.92 0.04314 3.40
90 0.04033 2.80 0.04108 2.79 0.04182 2.76 0.04257 2.18 0.04332 1.30
100 0.04085 1.80 0.04156 1.86 0.04227 2.17 0.04297 2.27 0.04368 2.01
110 0.04149 -0.90 0.04217 -0.06 0.04284 0.18 0.04351 0.63 0.04418 1.20
120 0.04222 4.50 0.04286 3.96 0.04351
-4.00
[image:9.595.56.545.37.271.2]0.04415 -4.26 0.04479 -5.79
TABLE 5: PERCENTAGE DIFFERENCE BETWEEN THE CALCULATED EMPIRICAL
CORRELATION THERMAL CONDUCTIVITY FROM EQUATION (19) AND THE
EXPERIMENTAL RESULTS FROM TABLE 2 FOR 38MM THICK BANANA FIBRE
SPECIMN
Density
(kg/m3)
Calculated Empirical Correlation Thermal Conductivity (W/m.K) - Equation (19)
and % Difference from Experimental Thermal Conductivity – Table 2
20 ˚C 25 ˚C 30 ˚C 35 ˚C 40 ˚C
λempirical W/m.K % Diff. λempirical W/m.K % Diff. λempirical W/m.K % Diff. λempirical W/m.K % Diff. λempirical W/m.K % Diff.
20 0.06756 0.23 0.06980 0.66 0.07204 0.76 0.07428 0.66 0.07653 0.73
30 0.05242 0.18 0.05397 0.41 0.05552
-0.76
0.05707 -0.58 0.05862 -1.08
40 0.04580 1.25 0.04704 1.38 0.04828
-1.83
0.04952 -2.33 0.05076 -1.40
50 0.04260 0.70 0.04368 0.44 0.04476
-0.56
0.04584 -0.91 0.04692 0.80
60 0.04110 0.07 0.04210 0.31 0.04310
-0.26
0.04409 -1.00 0.04509 -1.99
70 0.04058 -0.13 0.04154 0.84 0.04250 1.28 0.04345 1.48 0.04441 0.76
A Monthly Double-Blind Peer Reviewed Refereed Open Access International e-Journal - Included in the International Serial Directories.
GE-International Journal of Engineering Research (GE-IJER) ISSN: (2321-1717)
10 | P a g e
90 0.04115 0.55 0.04211 1.91 0.04306 1.08 0.04401 1.91 0.04497 1.58
100 0.04193 0.46 0.04290 2.74 0.04388 2.23 0.04485 2.04 0.04582 2.07
110 0.04291 0.55 0.04391 1.84 0.04491 1.87 0.04591 0.10 0.04691 1.52
120 0.04405 3.44 0.04509 2.60 0.04612
-2.86
[image:10.595.57.540.273.714.2]0.04716 -4.23 0.04819 -4.42
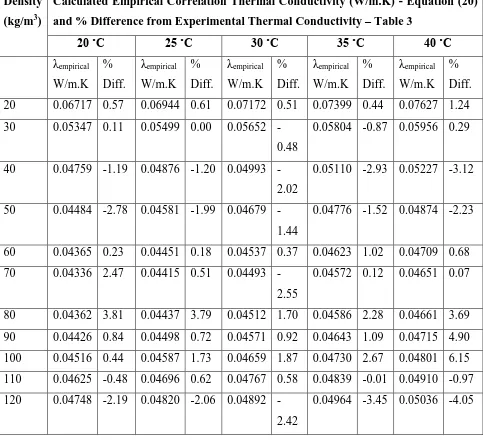
TABLE 6: PERCENTAGE DIFFERENCE BETWEEN THE CALCULATED EMPIRICAL
CORRELATION THERMAL CONDUCTIVITY FROM EQUATION (20) AND THE
EXPERIMENTAL RESULTS FROM TABLE 3 FOR 50.4MM THICK BANANA FIBRE
SPECIMN
Density
(kg/m3)
Calculated Empirical Correlation Thermal Conductivity (W/m.K) - Equation (20)
and % Difference from Experimental Thermal Conductivity – Table 3
20 ˚C 25 ˚C 30 ˚C 35 ˚C 40 ˚C
λempirical W/m.K % Diff. λempirical W/m.K % Diff. λempirical W/m.K % Diff. λempirical W/m.K % Diff. λempirical W/m.K % Diff.
20 0.06717 0.57 0.06944 0.61 0.07172 0.51 0.07399 0.44 0.07627 1.24
30 0.05347 0.11 0.05499 0.00 0.05652
-0.48
0.05804 -0.87 0.05956 0.29
40 0.04759 1.19 0.04876 1.20 0.04993
-2.02
0.05110 -2.93 0.05227 -3.12
50 0.04484 2.78 0.04581 1.99 0.04679
-1.44
0.04776 -1.52 0.04874 -2.23
60 0.04365 0.23 0.04451 0.18 0.04537 0.37 0.04623 1.02 0.04709 0.68
70 0.04336 2.47 0.04415 0.51 0.04493
-2.55
0.04572 0.12 0.04651 0.07
80 0.04362 3.81 0.04437 3.79 0.04512 1.70 0.04586 2.28 0.04661 3.69
90 0.04426 0.84 0.04498 0.72 0.04571 0.92 0.04643 1.09 0.04715 4.90
100 0.04516 0.44 0.04587 1.73 0.04659 1.87 0.04730 2.67 0.04801 6.15
110 0.04625 -0.48 0.04696 0.62 0.04767 0.58 0.04839 -0.01 0.04910 -0.97
120 0.04748 2.19 0.04820 2.06 0.04892
-2.42
A Monthly Double-Blind Peer Reviewed Refereed Open Access International e-Journal - Included in the International Serial Directories.
GE-International Journal of Engineering Research (GE-IJER) ISSN: (2321-1717)
11 | P a g e
4. DISCUSSION
The experimental data of banana fibre exhibited the characteristic behaviour of loose–
fill fibrous thermal insulation of decreasing thermal conductivity with increasing density to a
minimum value and then increasing thermal conductivity with further increase in density.
The optimum density at which the experimental results indicated minimum thermal
conductivity was within the range of 70 kg/m3 to 90 kg/m3. The minimum thermal
conductivity valve was recorded at the 80 kg/m3 test as experiments were conducted in
increments of 10 kg/m3 change in density. From the experimental data, banana fibre
specimens also exhibited the characteristic feature of increasing thermal conductivity with
increasing mean test temperature. Therefore, the thermal insulating properties of banana
fibre slab-like specimens is in line with other bio-degradable thermal insulations such as
coconut fibre, sugarcane fibre and oil palm fibre [1]. Also, the optimum thermal conductivity
is within the range 0.02 W/m.K to 0.06 W/m.K which is normally used for building thermal
insulation [5, 14]
The Method of Least Squares was used with the experimental data to develop
empirical correlations for calculating the apparent thermal conductivity of banana fibre with
variation in density and mean test temperature. The calculated thermal conductivity form the
empirical correlations also indicated the characteristic trends of loose-fill fibrous thermal
insulation. The empirical values showed a minimum thermal conductivity within the range
60 kg/m3 to 80 kg/m3. The calculated value at 70 kg/m3 was minimum as the thermal
conductivity was determined in increments of 10 kg/m3 change in density to facilitate
comparison with the experimental data.
The percentage difference between the calculated thermal conductivity using the
empirical correlation and the respective experimental thermal conductivity was determined
and tabulated on Tables 4 to 6. The experimental thermal conductivity fluctuated above and
below the calculated value showing positive and negative percentage differences. This was
expected for any experimental data set. The mean percentage difference for the 25.4 mm
thick specimens at 20oC, 25oC, 30oC, 35oC and 40oC over the test density range 20 kg/m3 to
120 kg/m3 was -0.06%, +0.09%, +0.19%, +0.24%, and -0.11%, respectively, and the mean
percentage difference over the 55 test points calculated as +0.07%. Similarly, the mean
percentage difference over the 55 test points for the 38 mm and 50.4 mm thick specimens are
0.04% and 0.13%, respectively. This indicates that the empirical correlations developed was
capable of predicting the trends and thermal conductivity variation of the banana fibre
A Monthly Double-Blind Peer Reviewed Refereed Open Access International e-Journal - Included in the International Serial Directories.
GE-International Journal of Engineering Research (GE-IJER) ISSN: (2321-1717)
12 | P a g e
5. CONCLUSIONS
Loose-fill banana fibre material exhibited the characteristic behaviour associated with
fibrous thermal insulation and thermal conductivity tests showed that at the optimum density
(lowest thermal conductivity) banana fibre is within the range for use as building thermal
insulation. The empirical correlations developed from the experimental results predicted the
trends and behaviour of the banana fibre within an average percentage difference of ±0.2% of
the experimental values. The empirical correlations can be used to calculate the thermal
conductivity of the banana fibre specimens at any combination of mean test temperature and
density within the range tested.
REFERENCES
1. K. Manohar and D.W. Yarbrough, A comparison of biodegradable fiber insulation
with conventional insulation, Proceedings of the International Conference on
Thermal Insulation, January 13-15, 18, 2003, 113-140.
2. S. Guilbert, C. Guillaume and N. Gontard, New packaging material based on
renewable resources: properties, applications and prospects (Food Engineering
Interface, Food Engineering Series, Springer, Part 5, 2011) 619-630.
3. X. Zhou, P.Z. Zheng, H. Li and C. Lu, An Environmentally-friendly Thermal
Insulation Material from Cotton Stalk Fiber, Energy and Building, 42, 2010,
1070-1074.
4. R.S. Al-Juruf, F.A. Ahmed, I.A. Alam and H.H. Abdel-Rahmen, Development of
Heat Insulating Materials Using Date Palm Leaves, Journal of Building Physics,
6(3), 1988, 158-164.
5. K. Manohar, Experimental Investigation of Building Thermal Insulation from
Agricultural By-products, British Journal of Applied Science and Technology, 2(3),
2012, 227-239.
6. N.J. Rodriguez, M. Ya-nez-Limon, F.A. Gutierrez-Micella, O. Gomez-Guzman and
T.P. Matadamas-Ortiz, Assessment of Coconut Fibre Insulation Characteristics and
its use to Modulate Temperatures in Concrete Slabs with the aid of Finite Element
A Monthly Double-Blind Peer Reviewed Refereed Open Access International e-Journal - Included in the International Serial Directories.
GE-International Journal of Engineering Research (GE-IJER) ISSN: (2321-1717)
13 | P a g e 7. M. Dusenbury, A Wisteria Grain Bag And Other Tree Bast Fiber Textiles Of Japan,
Textiles in Daily Life: Proceedings of the Third Biennial Symposium of the Textile
Society of America, September 24–26, 1992.
8. LaserComp Inc. Theory of Method, LaserComp. 2003, Accessed October 21, 2015.
http://
lasercomp.com/Tech%20Papers/Methods/Heatlow%20Meter%20Theory%20of%20t
est%200 method.pdf.
9. K. Manohar, D. Ramlakhan, G. Kochhar and S. Haldar, Biodegradable Fibrous
Thermal Insulation, Journal of the Brazilian Society of Mechanical Sciences and
Engineering, XXVIII(1), 2006, 53-55.
10. C. Bankvall, Mechanism of Heat Transfer in Permeable Insulation and their
Investigation in a Special Guarded Hot Plate, Heat Transmission Measurements in
Thermal Insulation, American Society of Testing and Materials, ASTM STP 544,
(Philadelphia, 1974) 34-38.
11. A.W. Pratt, Heat transmission in buildings (John Wiley and Sons - Interscience
Publication, London, 1978). 31-42.
12. D.L. McElroy, D.W. Yarbrough and R.S. Graves, The Thickness and Density of
Loose-Fill Insulations after Installation in Residential Attics, in F.J. Powell and S.L.
Matthews (Eds.), Thermal Insulation: materials and Systems, ASTM STP 922,
America Society for Testing and materials, (Philadelphia, 1978) 493-505.
13. K. Manohar, G.S. Kochhar and D.W. Yarbrough, Heat Transfer across Opaque
Fibers, Journal of Heat Transfer, 134, 2012, 072601-1 – 072601-8.
14. R.P. Tye, E. Ashars, E.C. Guyer and A.C. Sharon, Assessment of Thermal Insulation
materials for Building Applications, in D.L. McElroy and R.P. Tye (Eds.), Thermal
Insulation Performance, ASTM STP 718, America Society for Testing and materials,