BIROn - Birkbeck Institutional Research Online
Frenz, Marion and Lambert, Ray (2014) Innovation, skills and performance in
the downturn: an analysis of the UK innovation survey 2011. Project Report.
The UK Department for Business, Innovation and Skills.
Downloaded from:
Usage Guidelines:
Innovation, skills and
performance in the
downturn
An analysis of the UK Innovation
Survey 2011
Contents
Executive summary
... 2
1. Introduction
... 4
2. Resources for innovation
... 7
2.1 Expenditures on innovation activities ...7
2.2 Skills for innovation...9
3. Innovation performance
... 11
3.1 Product and process innovations ...11
3.2 Wider innovations ...12
3.3 Innovative sales ...14
4. Drivers of innovation performance
... 14
4.1 Skills and innovation performance ...15
4.2 Drivers of innovation performance over time ...18
5. Drivers of business performance
... 21
5.1 Drivers of business performance over time...21
5.2 Drivers of business performance: skills...23
6. Conclusions and policy implications
... 28
References
... 30
Annex A Data and methodology
... 33
A.1 The UK Innovation Surveys...33
A.2 The UK Innovation Survey 2011...34
A.3 The panel between UKIS2005, 2007, 2009 and 2011 ...35
A.4 Methodology ...36
A.5 Summary ...40
Annex B Resources for innovation
... 41
B.1 Expenditures on innovation activities...41
B.2 Skill for innovation ...47
Annex C Innovation performance
... 53
C.1 Product and process innovation ...53
C.2 Wider innovations ...54
Annex D Drivers of innovation performance
... 58
D.1 Skills by innovation category...58
D.2 The link between skills and innovation performance...62
D.3 Drivers of innovation performance over time ...74
Annex E Drivers of business performance
... 81
E.1 Drivers of business performance over time ...81
1
Innovation, skills and
performance in the downturn. An
analysis of the UK Innovation
Survey 2011
*
Marion Frenz and Ray Lambert, Department of Management, Birkbeck, University of London
Address: Malet Street, London WC1E 7HX
Email: m.frenz@bbk.ac.uk and r.lambert@bbk.ac.uk
The views expressed in this report are that of the authors and not necessarily those of the Department for Business, Innovation & Skills.
*
Executive summary
The link between firms’ innovation performance and economic cycles, especially major downturns such as that of 2008-10, is a matter of great policy significance, but is relatively under-researched at least at the level of micro data on business
behaviour. It is, for example, often argued that economies need to ‘innovate out of recessions’ since innovation is positively associated with improvements in
productivity that then lead to growth and better employment (Nesta, 2009).
The issues of how individual firms respond to downturns through their investment in innovation, and how this impacts on innovation outputs and ultimately business performance and growth during and after downturns, has been less studied because relevant data has not been readily available. The UK Innovation Survey (UKIS) 2011 now makes this possible. The UKIS 2011 with reference period 2008 to 2010 covers the downturn in economic activity generated by the global financial crash. The build-up of panels over the life of the UKIS also sbuild-upports analysis of the longer-term
interactions between innovation and the business cycle. This report analyses the last four waves of the surveys. Further, the latest survey includes questions on whether firms employ a specific set of skills, which adds materially to the ability to research the role of skills and human capital in innovation at the micro level.
The objectives of this report were to use data at the level of the firm to: 1) investigate the relationships between resources for innovation, innovation performance and impacts on business performance before, during and just after the economic crisis; and 2) analyse the links between a set of specific skills, covered for the first time in UKIS 2011, innovation performance and business performance.
Resources for innovation are captured in terms of specific skills, the share of graduates among employees, investment in internal and external R&D, and other knowledge, as well as innovation related expenditures on design, training, machinery and marketing. Measures of innovation performance are whether or not an
enterprise introduced a new product, process, organizational/managerial change, and the share of sales generated from new products. Measures of business performance are sales per employee and changes in sales and in employment.
The main findings and the analytical and policy issues arising from them are presented in four sections:
Resources for innovation: covering skills usage and innovation related investment
Innovation performance: covering product, process and wider innovation activities and innovative sales
Drivers of innovation performance: covering skills usage and other knowledge sources
The main conclusions are:
Comparisons over time between investments in innovation related activities and innovation outputs reveal a fall during the downturn, with the exception of some business and management practices. However, innovative businesses performed better during the crisis.
New-to-market (novel) innovation and new-to-firm (imitation) innovation are important for business performance and growth.
This implies that effective policies to nurture innovation promote business performance even during adverse economic circumstances.
The employment of specific skills (such as product design, software development and engineering and applied sciences) generally shows a positive relationship with innovation performance during the survey period 2008 to 2010 and there is some indication that the more highly specialised of the skills (e.g. engineering and applied sciences) are distinctive drivers of innovation (not just a demand derived from innovation led by other factors).
This implies that specialised skills take-up is a legitimate feature of innovation policies both for the ability to absorb technology and external knowledge and as sources of creativity and innovation.
Design-related as well as Science & Technology (S&T) related skills are significantly associated with innovation, and design-related skills are important for services innovation.
This implies that design is important for successful innovation and balanced policy mix should include consideration of design, both in-house and outsourced design skills and across all business sectors.
Business performance during the downturn period was also positively correlated with innovation carried out as mixed modes (bundles of
complementary activities, for example, training, management practices and intellectual property protection) and especially with modes that feature specialised skills, although the direction of causation cannot be readily inferred in one survey sample.
This implies that monolithic policies that isolate one element in the innovation system, e.g. R&D, may not meet the spectrum of innovation relevant activities and their strategic combinations.
Regression models for growth in sales and employment during 2008 to 2010 show a significant correlation with a mode of wider innovation that features management changes. Other research by the authors (Frenz and Lambert, 2012) reports a positive link between business growth and the take up of management standards such as ISO9001, supported by accreditation.
This implies role for encouraging improved management practices as part of innovation policy e.g. through accredited management standards.
1. Introduction
The link between firms’ innovation performance and economic cycles, especially major downturns such as that of 2008-10, is a matter of great policy significance, but is relatively under-researched at least at the level of micro data on business
behaviour. It is, for example, often argued that economies need to ‘innovate out of recessions’ since innovation is positively associated with improvements in
productivity that then lead to growth and better employment (Nesta, 2009).
The empirical basis for these assertions requires further work. For example, how business innovation reacts to a major contraction in demand has been examined using aggregate indicators such as the level of business spending on research and development. Official statistics indicate that, while business R&D expenditure in real terms fell from £16.5 bn in 2008 to £15.9 bn in 2009, it did so less than
proportionately to the fall in GDP. There was a slight recovery to £16.1 bn in 2010, maintaining the steady R&D ratio to GDP seen in previous years, so that the R&D element in innovation at aggregate level did not record a dramatic reduction in the downturn. However, the aggregate is dominated by a relatively small number of corporations, so that expenditure by the majority of businesses might have shown a more extensive fall (Office for National Statistics, 2011).
However, others have argued that, on a broader view of aggregate expenditure on innovation, that takes into account expenditures beyond R&D conceived as
intangible asset creation, the UK saw a much sharper fall in innovation investment in the downturn, with a 7%1 fall in real terms in 2009 (e.g. Nesta, 2012). Recent
empirical work on the UK Innovation Surveys point towards a substantial drop in innovation related investment in the UK in 2008 of around 8% as a result of the economic crisis (Archibugi, Filippetti and Frenz, 2013a).
The issues of how individual firms respond to downturns through their investment in resources for innovation and how this impacts on innovation performance and ultimately business performance and growth, during and after downturns has been less studied because relevant data was not readily available. The UK Innovation Survey (UKIS) 2011 now makes this possible.
In this report resources for innovation are captured in terms of specific skills, the share of graduates among employees, investment in internal and external R&D, and other knowledge, as well as innovation related expenditures on design, training, machinery and marketing. Measures of innovation performance are whether or not an enterprise introduced a new product, process, organizational/managerial change, and the share of sales generated from new products. Measures of business
performance are sales per employee and changes in sales and in employment.
The report analyses the last four waves of the surveys. The Department for Business, Innovation and Skills refers to these surveys as UKIS2005, 2007, 2009
1
and 2011, after the year during which data was collected (Robson and Achur, 2012). The reference periods are either the three-year period – e.g. 2008-10 in the case of UKIS2011 – or the calendar year prior to data collection – e.g. the calendar year 2010 for UKIS2011.2 When the reference period is a three-year period, the surveys measure the propensity of enterprises to engage in an activity. E.g., the propensity of enterprises to engage in in-house R&D in UKIS2011 is defined as the percentage of enterprises that had any in-house R&D expenditures in 2008-10. Where the
reference period is the calendar year the surveys measure the intensity with which enterprises carry out an activity. E.g., the intensity with which enterprises engage in in-house R&D in UKIS2011 is defined as the average amount (expressed in £000s) that enterprises invested in in-house R&D during 2010.
The build-up of panels over the life of the UKIS also supports analysis of the longer-term interactions between innovation and the business cycle. The survey includes questions on whether firms employ a specific set of skills, in addition to the long established question on the share of employees with graduate or above
qualifications and these enhanced skills indicators can be included in the analysis.
This study was commissioned by the Department for Business, Innovation and Skills and has been guided by a number of agreed research questions:
What was the scale of the effect of the downturn on investments into resources
for innovation, innovation performance and enterprise performance?
Which skills and which ‘bundles of skills’ are used intensively for which types of
innovation?
How does innovation performance vary with skill intensities (UKIS Q24) and
types of skills employed (UKIS Q25)?
What are the impacts of skills intensity and types of skills employed on
enterprise performance in terms of productivity and growth?
Did innovators do better during the recession?
How do design skills and design investment combine to affect innovation,
productivity and growth and is there a well-defined ‘design led’ innovation category.
This report presents our main findings and addresses the analytical and policy issues in four sections:
Resources for innovation: covering skills usage and innovation related investment
Innovation performance: covering product, process and wider innovation and
innovative sales
Drivers of innovation performance: covering skills usage and other knowledge
sources
Drivers of business performance: covering skills usage and innovation
performance
The more detailed statistical analyses and the data and technical issues are in the
2
For reasons of simplicity our charts and tables state the reference period or year: 2002-4 and 2004 for UKIS2005; 2004-6 and 2006 for UKIS2007; 2006-8 and 2006 for UKIS2009; and 2008-10 and 2010 for UKIS2011.
2. Resources for innovation
This section looks first at innovation related expenditures, including R&D and broader expenditures, before examining as a resource for innovation the range of innovation related skills employed by UK business.
2.1 Expenditures on innovation activities
The UKIS includes several variables representing engagement in, and expenditures on, innovation directed activities, including in-house R&D; buying in R&D;
expenditures on new machinery, equipment, computer hardware and software for innovation; training for innovation; design activities; and marketing of new products. Across all these types of activities, enterprises reported lower activity levels from 2008 onwards.
Our main finding is that, over the course of the survey period, 2008-10, there was a decline in both the propensity to invest in innovation (the share of enterprises that invested in innovation) and the intensity with which enterprises invested in innovation (the average amount that was spent on such activities).
Over the period covered by four successive surveys – 2002 to 2010 – there is in general (based on the full survey samples that are scaled up to the wider population) a contraction in the shares of enterprises with innovation expenditures from 2008 onwards, shown in Figure 1. The rate of contraction is also, although to lesser extent, apparent in the four-wave panel of enterprises who responded to each survey. Although the panel is not fully representative, statistically, of the successive samples, the panel data may better represent the underlying trends as they show the behaviour of the same group of enterprises over time.
Figure 1. Share of enterprises that engage in innovation related activities in 2002-2004, 2004-2006, 2006-2008 and 2008-2010, full samples and weighted data, UK Innovation Survey
Authors’ own calculations. Three-year period 2002-4 for UKIS2005; 2004-6 for UKIS2007; 2006-8 for UKIS2009; and 2008-10 for UKIS2011.
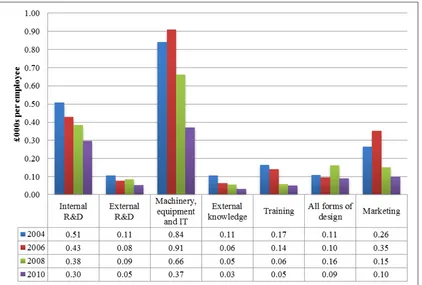
Turning to the intensities of innovation related investments for the calendar years 2004, 2006, 2008 and 2010 in Figure 2, we also see a decline during the downturn in the average amount spent per employee by enterprises on innovation related
Figure 2. Expenditures on innovation related activities per employee, 2004, 2006, 2008 and 2010 full samples and weighted data, UK Innovation Survey
Authors’ own calculations. Calendar year 2004 for UKIS2005; 2006 for UKIS2007; 2008 for UKIS2009; and 2010 for UKIS2011.
As item non-response rates were significantly higher in UKIS2011, the numbers reported in Figure 2, can be seen as indicative of a trend but do not enable precise estimates of the extent of the reduction. The largest absolute drops in innovation investment in both 2008 and 2010 were in the amount enterprises spent on
machinery, equipment and IT. The category machinery, equipment and IT had the highest investment among all categories in Figure 2. Within this category,
enterprises further reported that much of it was due to upgrading of computer hardware and software (Robson and Achur, 2012). Upgrading of IT kit may be less essential to enterprises’ innovation processes compared with R&D activities, while at the same time, annual IT budgets more easily adjusted downwards during periods of lower sales.
2.2 Skills for innovation
Other important resources for innovation are skills. UKIS 2011 included, for the first time, a set of questions on whether firms employ, either as staff or as external suppliers, a set of specific skills. These skills are graphic arts, product or service design, multi-media or web design, software development, engineering and applied sciences and mathematics or statistics. While not an exhaustive list of skills for innovation, these provide a useful picture of some highly relevant forms of human capital, in addition to the question on the shares in employment of graduates in science and engineering and in other subjects, that have been in the survey since
UKIS1997 (reference period 1994-1996). Our main finding is that, for the sample overall, the share of firms employing one or more of these specialised skills is low, but shows significant variation across the six types.
The overall shares of businesses employing the six specific skills are summarised in Figure 3. The analysis is based on those who answered the question on skills, so may not fully generalise to the full sample. The most frequently used skill is
multimedia and web design, followed closely by graphic design, consistent with the importance of communications and on-line presentation and commerce in the modern economy and which can be considered to be the new embodiment of the traditional role of the designer in making images as part of the visualisation of the business image or appearance and usability of goods and services. The relatively high share employing software developers points to the importance of in-house as well as software purchasers. This is in-line with the results of estimates of
[image:15.595.75.526.364.644.2]investment in intangible assets at the aggregate level (Awano et al., 2010) which report the substantial share of own account software development in intangible investment. A slightly higher share of firms employ object and service designers than have engineering/applied science skills.
Figure 3. Share of enterprises employing specific skills, 2008-2010, full samples and weighted data, UK Innovation Survey
Authors’ own calculations. Percentages refer to three-year period 2008-10 for UKIS2011.
The more highly specialised skills – object and service designers, engineering and applied sciences and mathematics and statistics –are employed by far fewer
The overall share of the businesses who answered the question reporting use of these specific skills is low, especially amongst the more highly specialised such as mathematics and statistics. Since, as will be shown, higher shares of the more innovative businesses use these skills, a reasonable inference is that raising skills intensity could be a source of enhanced innovation performance.
3. Innovation performance
This section examines innovation performance in the area of: (i) new products (goods and services) and processes, (ii) wider innovations, consisting of new
management techniques, organisational structures and marketing concepts, and (iii) innovative sales.
3.1 Product and process innovations
Innovation outputs can be defined as the share of enterprises that introduced a new product (goods or services) or a new production process or service delivery method. The main result here is that the share of enterprises with new products or processes is reported to be lower during 2008-10, than in earlier periods. However, a higher share report changes to management techniques between 2008 and 2010 than before the crisis. Introducing a quality management process suggests an objective to increase efficiency and reduce internal costs in both production and service delivery.
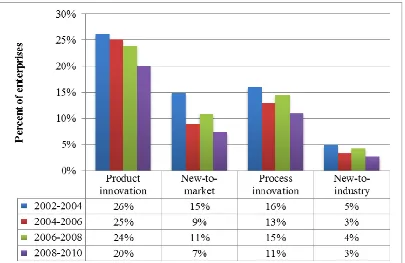
The analysis underlying these results is summarised in the Figures below. Figure 4 shows the shares of enterprises with product (goods or services) or process
innovations. Product innovations are further distinguished into products that are new to the enterprises, and products that are not only new to the enterprise, but also the enterprise’s market – a more challenging indicator. In a similar vein, process
innovations may be new-to-enterprise or new to the enterprise’s industry.
Figure 4. Share of enterprises that introduced a new product or a new process in 2002-2004, 2004-2006, 2006-2008 and 2008-2010 full samples and weighted data, UK Innovation Survey
Authors’ own calculations. Three-year period 2002-4 for UKIS2005; 2004-6 for UKIS2007; 2006-8 for UKIS2009; and 2008-10 for UKIS2011.
The shares of businesses reporting each type of innovation is lower in the 2008-2010 period than in the previous surveys, most markedly in to-market and new-to-enterprise process innovations, although it should be noted that the level of these indicators have also varied significantly over previous surveys. This, and other empirical studies, point towards lower average levels of innovation performance during and following on from the economic downturn. Evidence also suggests that, economic uncertainties, caused by downturns, have an uneven impact across different types of businesses, incumbent or new, large or small, but also across industries and technologies and geographies within the UK or via international exposure. While there might be a decline in some sectors, technologies, locations etc, other firms might “swim against the stream and increase their investment” (as suggested in Archibugi et al. 2013a: 303).
3.2 Wider innovations
The survey also collects what are frequently referred to as ‘wider innovation
indicators’: enterprises that made changes in business or management processes, organisational structure or marketing strategy. Enterprises faced with a decline in demand for their goods or services, or with greater uncertainties about the extent and direction of future demands, could respond to such conditions with
Figure 5. Share of enterprises that introduced a new managerial technique, organisational structure or marketing strategy in 2002-2004, 2004-2006, 2006-2008 and 2006-2008-2010 full samples and weighted data, UK Innovation Survey
Authors’ own calculations. Three-year period 2002-4 for UKIS2005; 2004-6 for UKIS2007; 2006-8 for UKIS2009; and 2008-10 for UKIS2011.
We find that the share of enterprises that introduced a new management technique, such as 6 Sigma or other quality management processes, increased between 2008-10 compared to previous periods.3 The share of enterprises reporting new
management techniques and business practices grew by around two percentage points between 2008-10. The share of enterprises that made changes to their organisational structure dropped by one percentage point and the share of
enterprises that introduced a new marketing strategy dropped by two percentage points in 2008-10.
3
The relevant question was substantially rephrased in UKIS2011 for ‘management techniques’ the original question was referring to the “implementation of new management techniques within this business? e.g. Investors in People, Just in Time, 6 Sigma” which was changed to: “new business practices for organising procedures (i.e. supply chain management, business re-engineering, knowledge management, lean production, quality management etc.)”; ‘organisational structure’ the original question referred to: “implementation of major changes to your organisation structure? e.g. introduction of cross-site /teamworking” which was changed to: “new methods of organising work responsibilities and decision making (i.e. first use of a new system of employee responsibilities, team work, decentralisation, integration or de-integration of departments, education/training systems etc.). The question for ‘marketing strategy’ remained unchanged.
3.3 Innovative sales
We turn next to enterprises’ innovation intensities, measured in the survey by the percentage of sales in a specific calendar year that are derived from (a) new-to-market products (goods and services) and (b) from products new to the enterprise but not new to the market. We use these variables to derive the actual turnover per employee derived from (a) and (b) above. This transformation is performed to avoid any distortion that may derive from single product enterprises that may report 100% of new sales.
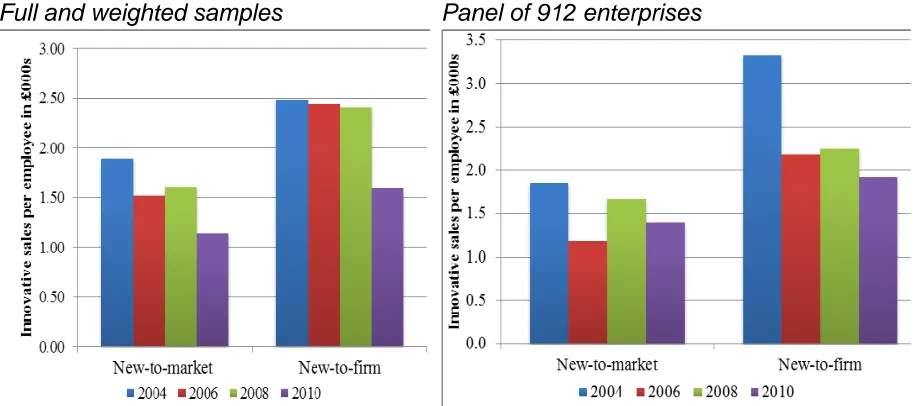
[image:19.595.73.532.381.584.2]The main result is that the surveys recorded in 2008 an increase in innovation intensities from 2006 levels, and a subsequent decline in innovation intensities in 2010. This decline appeared in both new-to-market sales and new-to-firm sales. In the full samples, innovation intensities on both measures – to-market and new-to-firm – in 2010 was below levels of all previous periods. Figure 6 below reports the two types of innovative sales per employee based on weighted data of full samples on the 912 enterprises in the panel.
Figure 6. Innovative sales per employee in 2004, 2006, 2008 and 2010 full samples and weighted data and panel data, UK Innovation Survey
Full and weighted samples Panel of 912 enterprises
Authors’ own calculations. Calendar year 2004 for UKIS2005; 2006 for UKIS2007; 2008 for UKIS2009; and 2010 for UKIS2011.
4. Drivers of innovation
performance
characteristics that best predict innovation performance before, during and following on from the crisis. Explanatory variables include firm size, age, sector, share of graduates, innovation expenditures, collaborations, and the extent to which enterprises pursue exploration strategies to open up new markets or invent new products compared with exploitation strategies to improve on existing products or production efficiencies.
4.1 Skills and innovation performance
This section presents the relationship between employment of specialised skills and the various categories of innovation, using aggregation of the six individual skills types into (a) design-related and (b) science and technology-related groups. Design-related includes graphic/art, multi-media web and product/service design. Science and technology (S&T) includes software development, science/engineering and maths/statistics. The main finding is that employment of these specific skills is much higher amongst innovators, suggesting that innovation is importantly enabled or supported by the use of appropriate skills. We can also conclude that the specific skills covered in the survey are major ingredients for successful innovation, while the more highly specialised of them appear as original or creative resources that enable innovation.
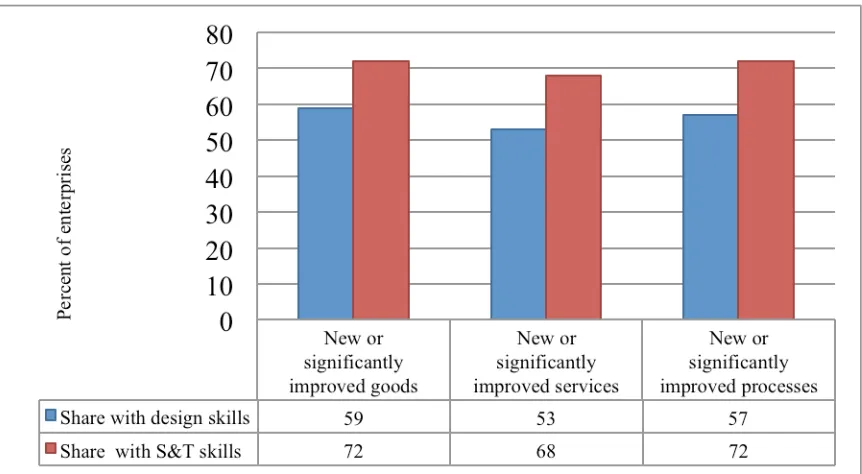
[image:20.595.74.505.495.732.2]The underlying analysis looks first at the use of skills in connection with innovation involving bringing to the market or into use new or improved goods, services or processes. Figure 7 shows the share of each type of innovator who report the employment of one or more type of design skill or one or more types of S&T skill.
Figure 7. Percentages of innovators employing skills, 2008-2010, full sample and weighted data, UK Innovation Survey
Authors’ own calculations. Percentages refer to three-year period 2008-10 for UKIS2011.
The majority of innovators employ design or S&T skills or both, with significantly more employing S&T skills. Although a higher share of the sample as a whole report employment of design than S&T skills, for some firms, the former may be regarded as supporting business as usual more than innovation. For example, web design may be viewed as routine by many firms. Goods and process innovators were more prone to employ S&T skills, but over two thirds of services innovators use such skills, while, contrary to the widely held view that design is mostly used for the
development of products rather than services, over half of services innovators employed design-related skills.
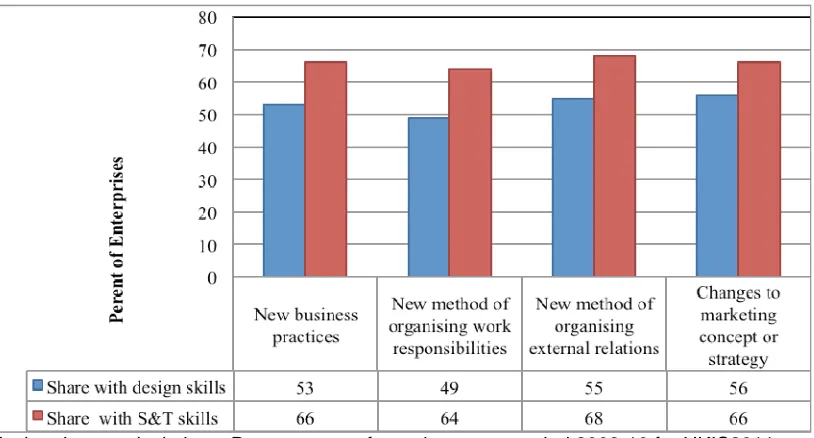
A similar picture emerges for managerial (wider) forms of innovation, in the areas of business practices, work organisation, external relationships and marketing strategy, shown in Figure 8. In each case, approximately two thirds of innovating firms
[image:21.595.75.482.348.567.2]employed S&T skills and around half employed design skills. Notably, the share using design skills in marketing strategy was only slightly higher than for the other practices, which shows that marketing is just one application of design.
Figure 8. Percentages of wider innovators employing skills, 2008-2010, full sample and weighted data, UK Innovation Survey
Authors’ own calculations. Percentages refer to three-year period 2008-10 for UKIS2011.
A theme in the literature on skills and innovation is to posit that demand for skills is derived from other incentives to innovation (Tether, 2005a). These include external or in-house technological change that can require particular skills as well as physical and knowledge resources to implement. By this thinking, skills adapt passively to exogenous shocks such as new technological or market opportunities. Most of the research underpinning this approach concerns the national or industry level,
although it implicitly applies to the firm. Skilled people are also a resource or
Skills can be a capability that drives innovation or a demand derived from other determinants of innovation. These roles can be investigated through computing the ratio of the percentage of firms employing a skill (capability) with each type of innovation, to the percentage of innovators of each type who employ that skill (derived demand). These data are reported in Annex C.While derived demand dominates for the majority of these skills, inthe case of the most highly specialised skills, the capability effect is predominant, for example:
Designers of goods and services appear as drivers of new to firm innovation in goods, service and processes;
Engineering and applied sciences appear as drivers of innovation in new to the firm goods and services and in new to industry process innovation; and
Maths and stats employment appears as a driver in both new to the firm and new to the market or industry goods, service and process innovation.
We can conclude that the specific skills covered in the survey are major ingredients for successful innovation while the more highly specialised skills appear as original or creative resources that enable innovation.
Regression analysis can be used to relate innovation to skills and other variables. This gives a more precise picture of the extent to which the various forms of
innovation are likely to depend on packages of skills (design-related skills and S&T skills), since the effects of other factors affecting innovation performance can be taken into account4. Some of the skill dependencies that emerge are unexpected and provide new insights into the importance of different types of human capital in the underlying processes that enable and support innovation. (The regression results are in Annex C). The main findings from applying regression models include:
incremental goods innovation and services innovation are positively correlated with employment of design skills, but not significantly related to pure S&T skills. This may seem surprising as goods innovation might be expected to rely on engineering and science capabilities. However, incremental – new-to-firm but not new-to-market – goods and services innovations often take the form of adaptation to new or different uses without requiring significant technical change;
the frequency of novelty (new-to-market innovation) in goods is significantly related to the employment of S&T skills but not design skills. The implication here is the importance of technology and the availability of the human knowledge that is part of it, in enabling leading edge developments in physical goods;
a striking and unexpected feature of these results is the consistently
positive correlation between design skills and novel (new-to-market) service innovation. It is frequently assumed in innovation studies that design is basically an addition to affect the appearance of goods where the basics of change derive from other factors. And design is rarely, if ever, studied in the context of
innovation in services;
4
In this section design skills includes software development, which is a variation from the groups used in Section 2.2. The amended grouping follows from the strength of the statistical association between the separate skills variables. See Annex D for details.
there is less clear evidence of process innovation correlating with
specialised skills, perhaps indicating the extent to which process improvements might be more strongly determined through other factors, such as bought-in equipment and external services; and
incremental (new-to-business) process innovation is correlated with
employment of design skills, indicating the role of adapting external knowledge to the firm’s particular circumstances, but S&T skills are not significant.
Turning to wider innovation, in the form of new business practices, changes to work organisation, changes to external relations and changes to marketing concepts or strategies, there are statistically significant correlations between each type of these wider innovations and design and S&T skills, with the exception of a lack of
relationship between ‘changing marketing concept or strategy’ and S&T skills, which is consistent with our expectations. The significance and size of the link is
particularly strong for innovation through ‘changes to work organisation’ and design skills, suggesting the breadth of applicability of these skills in business.
From our analysis, it is notable that the share of firms using design skills in marketing strategy is only slightly higher than for the other forms of ‘wider innovation,’
consistent with the idea that marketing is just one application of design and not its essential function.
Turning to innovation intensities measured as the share of new-to-market goods and services in sales, there is a positive and significant association with the joint
employment of design and S&T skills. This suggests that higher levels of
innovativeness are not just dependent on expenditure on R&D and other inputs, but are actively enabled by using specialised skills in appropriate combinations. When analysing the share of innovative sales in services, the theme of a strong correlation of services innovation with design skills emerges clearly again, with a comparatively large coefficient in the novel services innovation intensity equation.
4.2 Drivers of innovation performance over time
In this section we look at a set of enterprise characteristics that influence innovative sales. Figure 6 showed that innovative sales – measured as firm and new-to-market sales – fell in 2010, following the decline in innovation investment in 2008. Here, the aim is to uncover if different enterprise characteristics, including innovation investment are more or less important before, during and following on from the crisis.
Economic crises have been linked to the emergence of new, disruptive technologies that trouble those who are experts in the use of old, established technologies
(Schumpeter, 1911; Dosi, 1982). In Schumpeter’s words “it is not the owner of stage-coaches who builds railways” (1911, p.66). This implies that the type of business with high innovation intensity can differ in periods of relative calm from periods following economic turmoil. It is not clear if the current economic crisis can be
Empirical evidence based on the current economic crisis is both scarce and mixed. Kanerva and Hollanders (2009) find that highly innovative businesses continued to invest in innovation during the downturn. Archibugi et al. (2013b: 1,247) report that before the crisis “incumbent enterprises are more likely to expand their innovation investment, while after the crisis a few, small enterprises and new entrants are ready to ‘swim against the stream’ by expanding their innovative related expenditures”.5
The results presented in this report point towards stability in the make-up of
innovators. Our findings suggest that enterprises with high innovation performance, measured by new-to-firm sales per employee as well as new-to-market sales per employee, have higher innovation investments before, during and following on from the crisis. Successful innovators also tend to be more likely to compete in
international markets.
We regressed innovative sales (measured as new-to-firm sales per employee and new-to-market sales per employee, with both measures expressed in £000s) on innovation investment intensity (total innovation related expenditures per employee expressed in £000s) and an extensive set of additional explanatory variables. ‘Before the crisis’ refers to the calendar year 2006, ‘during the crisis’ to the calendar year 2008 and ‘following on from the crisis’ to 2010. Innovative sales are lagged by one survey round (by two years).
Before the crisis t=2006
During the crisis t=2008
Following on from the crisis t=2010
Innovative sales in 2006 Innovative sales in 2008 Innovative sales in 2010
Innovation related investments and firm characteristics in 2004
Innovation related investments and firm characteristics in 2006
Innovation related investments and firm characteristics in 2008
Table 1 below presents the relevant regressions results with respect to the measure new-to-firm sales per employees.6 The results for new-to-market sales are
commented on in this section only. The full regression results are presented in Appendix D, Table D.15.
The first column of Table 1 presents the regressions predicting new-to-firm sales in 2006, the second and third columns predict new-to-firm sales per employee in 2008 and 2010 respectively. New-to-firm sales in 2006 is explained with a set of
independent variables that include total innovation related expenditures (labelled ‘innovation investment’) and that are measured in the previous survey for the
calendar year 2004. During the crisis we measure new-to-firm sales in 2008 and the explanatory variables in 2006, and following on from the crisis we look at new-to-firm sales in 2010 with the explanatory variables measured in 2008.
5
Both Kanerva and Hollanders and Archibugi at al. (2013b) analysed the activities of European enterprises using Innobarometer data compiled by the European Commission in 2009.
6
The results are also discussed in Appendix D, Table D.15.
Table 1. New-to-firm sales per employee before (2006), during (2008) and following on from the crisis (2010), UK Innovation Survey
Dependent variables New-to-firm sales per employee t
Independent variables 2006 2008 2010
Innovation investment t-1 0.21** 0.19** 0.09+
(0.045) (0.053) (0.055)
Employment t-1 0.04 0.03 -0.01
(0.026) (0.024) (0.028)
Newly established 0.17 0.05 0.19
(0.110) (0.101) (0.143)
Group belonging -0.06 -0.03 0.11
(0.061) (0.063) (0.071)
International market t-1 0.14+ 0.16* 0.07
(0.073) (0.082) (0.069) Cooperation with other business t-1 -0.15 0.50** 0.04
(0.142) (0.177) (0.122) Cooperation with research institute t-1 0.20 -0.23 0.09
(0.177) (0.227) (0.168)
Explorative strategies t-1 0.11+ 0.10 0.08
(0.057) (0.075) (0.103)
Exploitative strategies t-1 0.00 0.04 0.11+
(0.062) (0.085) (0.059)
Finance t-1 -0.02 0.03 -0.02
(0.086) (0.102) (0.093)
Skills t-1 0.31* 0.01 0.16
(0.144) (0.097) (0.109)
Industry dummies Included Included Included
Constant -0.14 -0.20 0.29
(0.231) (0.253) (0.267)
Observations 696 760 564
R-squared 0.210 0.188 0.184
F-statistic 5.16** 5.16** 3.20**
Regression method is OLS. We report regression coefficients with robust standard errors in
parentheses. The dataset is the panel of 912 enterprises that responded to UKIS 2005, 2007, 2009 and 2011. The number of observations is smaller than 912 due to missing values. New-to-firm sales are measured in the calendar years 2006, 2008 and 2010.
** p<0.01, * p<0.05, + p<0.1
There is some indication (p<0.1) that the exploitation of previous innovations and competencies, through further quality improvements to existing products and efficiency gains in production processes, are associated with higher new-to-firm sales in 2010.7 The finding is in contrast to Archibugi et al. (2013a) who found exploration to better predict innovation investments of UK businesses in 2008.
Newly established enterprises reported lower new-to-market sales following on from the crisis (the regressions predicting new-to-market sales are reported in Annex D Table D.14), suggesting, in line with Kanerva and Hollanders (2009), that established players had higher new-to-market sales.
7
Operating in international markets is positively associated with new-to-firm sales during the crisis. Enterprises that operate abroad may have innovation advantages
per se, because they learn from different local environments, or perceive a greater
need to upgrade their products more frequently in order to compete in different markets (e.g. Frenz and Ietto-Gillies, 2011). Producing and selling in a number of countries could, at least to some extent, mitigate the impact of the crisis on those firms, because uncertainties and risks are spread more widely over a number of locations/markets.
Our main finding is the following: total innovation related expenditures per employee are positively correlated with new-to-firm sales before, during and following on from the crisis. However, following on from the crisis both the coefficient size and
significance are lowest. This suggests that innovation investments matter, but that the extent to which businesses reap the benefits from investments in innovation in terms of generating new-to-firm sales declined during the downturn.
Breaking down the innovation related expenditures into individual components we find that among the different innovation expenditure types in-house R&D and design expenditures better predict new-to-firm sales than any of the remaining investment types. The related regression results are presented in Annex D, Table D.16.
5. Drivers of business
performance
This section examines the extent to which innovation performance correlates with business performance before, during and following from the crisis. We then examine how specific design and Science and Technology (S&T) skills might feed through into improved business performances.
5.1 Drivers of business performance over time
Business performance is measured using a proxy for labour productivity (sales per employee) and change in employment.8 Our main findings are that new-to-market innovation and new-to-firm innovation are important for business performance and growth.9
During the crisis in 2008, innovative sales – new-to-firm and new-to-market – are positively correlated with growth in employment. New-to-firm sales are also
correlated with turnover per employee, a very basic measure of labour productivity,
8
In the extended Appendix E we also report on change in turnover as a measure of business performance. The results are reported in Tables E.3 and 4.
9
The regressions for new-to-firm sales predicting sales per employee and change in employment are those presented in this section in Tables 2 and 3. The regressions for new-to-market sales predicting sales per employee are reported in Appendix E Table E.2 and change in employment in Table E.6.
during the crisis.
Based on this and our overall results, we believe that (a) firms with high innovation intensity fare better during periods of economic turmoil, but that (b) the benefits that firms can reap from innovation are greater during periods of relative calm. This is compounded by the findings reported in the previous section: the returns on innovation investments in terms of innovative sales are also lower during an economic crisis.
We report the regression estimates for productivity in Table 2. Innovation
performance –new-to-firm sales per employee – is measured in the same year as productivity. The remaining explanatory variables, including skills, are measured in the previous survey reference year.
Table 2. Sales per employee before (2006), during (2008) and following on from the crisis (2010), UK Innovation Survey
Dependent variables Sales per employee t
Independent variables 2006 2008 2010
New-to-firm sales per employee t 0.50** 0.18* 0.21+ (0.151) (0.092) (0.121)
Employment t-1 -0.05+ -0.08** -0.11**
(0.028) (0.028) (0.036)
Skills t-1 0.28* 0.55** 0.45**
(0.130) (0.079) (0.093)
International market t-1 0.34** 0.42** 0.37**
(0.087) (0.079) (0.094)
Group belonging 0.32** 0.25** 0.34**
(0.069) (0.064) (0.085)
Industry dummies Included Included Included
Constant 4.13** 4.46** 4.54**
(0.208) (0.206) (0.280)
Observations 634 634 406
R-squared 0.456 0.472 0.433
Chi-squared 631.9 570.2 318.3
Regression method is by two stage least squares. We report regression coefficients with robust standard errors in parentheses. The dataset is the panel of 912 enterprises that responded to UKIS 2005, 2007, 2009 and 2011. The number of observations is smaller than 912 due to missing values. The first stage equation is that reported in Table 1. Sales per employee are measured in the calendar years 2006, 2008 and 2010.
** p<0.01, * p<0.05, + p<0.1
New-to-firm sales per employee are positively correlated with productivity in all three periods. In other words, enterprises with higher innovative sales also performed better in terms of productivity. The pre-crisis relationship is stronger compared with during and following on from the crisis. This suggests that, while innovators fare better during the recession, the benefits that they take during periods of economic growth are also greater.
The share of graduates (the variable labelled skills) positively correlates with
Furthermore, those firms reporting highest sales per employee before and
throughout the economic downturn are those that operate internationally and are more likely to belong to a wider company group. We turn next to performance measured as the changes in employment, expressed as a function of innovation performance.
Table 3. Change in employment before (2006), during (2008) and following on from the crisis (2010), UK Innovation Survey
Dependent variables Change in employment t
Independent variables 2006 2008 2010
New-to-firm sales per employee t 0.22* 0.15* 0.10 (0.108) (0.067) (0.094)
Employment t-1 -0.23** -0.12** -0.13**
(0.022) (0.019) (0.025)
Skills t-1 -0.22* -0.02 -0.05
(0.092) (0.055) (0.069)
International market t-1 -0.23** -0.01 -0.00
(0.066) (0.054) (0.067)
Group belonging 0.16** 0.03 0.01
(0.054) (0.044) (0.060)
Industry dummies Included Included Included
Constant 1.28** 0.66** 0.70**
(0.166) (0.142) (0.198)
Observations 694 697 469
R-squared 0.156 0.027 0.062
Chi-squared 192.0 56.86 41.36
Regression method is by two stage least squares. We report regression coefficients with robust standard errors in parentheses. The dataset is the panel of 912 enterprises that responded to UKIS 2005, 2007, 2009 and 2011. The number of observations is smaller than 912 due to missing values. The first stage equation is that reported in Table 1. Change in employment is measured between the calendar years 2004 and 2006, 2006 and 2008, and 2008 and 2010.
** p<0.01, * p<0.05, + p<0.1
New-to-firm sales are positively correlated with growth in employment before the crisis and during the crisis (2008) but not following on from the crisis. Generally, the significance and explanatory power of these models (the R-squared) for 2008 and 2010 are lower, suggesting that factors other than innovative sales were more important in determining growth over these periods. Notably, we could not include a variable that captured the change in demand conditions, and it is likely to be
changes in demand structures across different markets that explain changes in employment numbers. The crisis had a disruptive effect on the links between innovation and economic performance and the potential longer-term benefits of maintaining innovative efforts during the downturn may not be evident in business data for 2010. The next section includes some models that are based on a wider selection of innovation indicators from the survey.
5.2 Drivers of business performance: skills
Innovation has multiple dimensions and is not always best represented by a single
variable from the survey. For the analysis of the relationships between skills and economic performance indicators, we use a methodology of identifying ‘mixed modes of innovation’ which are sets or bundles of activities, undertaken together by a firm to bring about and market a new good or service, or improve on production, delivery and business processes. The estimation of modes rests on the empirical evidence of complementarity between innovation inputs, linkages and outcomes.
This methodology has been developed from earlier work under OECD auspices (Frenz and Lambert, 2009). Modes can be conceived as strategic orientations or styles of innovation. The methodology for computing the modes from many variables taken from the UKIS 2011 is discussed in detail in Annex E.
One of the mixed modes derived from the UKIS 2011 data is substantially determined by design-related skills, while S&T skills combine with the following activities: in-house and bought in R&D and other knowledge; product design; and the use of intellectual property rights in an in-house technology based strategy. The business performance indicators are the same as in the previous section: a proxy for labour productivity – sales per employee – and change in sales and in employment in 2010.
Our main findings are that: (a) the skills modes, both around technology and IP, as well as around design skills, are strongly correlated with sales per employee and change in sales in 2010; and (b) that both modes are, albeit to a lesser extent, correlated with growth in employment in 2010. This is in line with the regressions reported in the previous sections, where too, innovation and skills were good predictors of sales per employee in 2010.
Table 4 shows the make-up of six innovation modes, two of which – Modes 1 and 4 – are skills driven. All six modes are used to predict productivity and employment growth. In Table 4, the variables that feed into the modes are those whose
correlations with a specific mode take values of 0.5 or higher. These values are indicated (highlighted red) in Table 4. Based on this, we see that software
development is more highly correlated with the design skills than with S&T and forms part of the ‘design skill led mode’ – Mode 4. Science and technology skills
Table 4. Mixed innovation and skills modes based on UKIS 2011
Modes
Variables feeding into the modes
Mode 1 Technology and IP driven
mode Mode 2 Codified knowledge Mode 3 Wider innovating Mode 4 Design skills driven Mode 5 Market facing Mode 6 External process modernizing
New product 0.2 0.0 0.1 0.1 0.8 0.0
New process 0.1 0.2 0.4 0.1 -0.3 0.5
New-to-market product 0.4 0.1 0.1 0.1 0.6 0.3
New business practice 0.1 0.2 0.7 0.0 -0.1 0.2
New management technique 0.0 0.1 0.8 0.1 -0.1 0.1
New business structure 0.1 0.1 0.7 0.1 0.1 0.0
New marketing strategy -0.1 0.1 0.7 0.2 0.3 -0.2
In-house R&D 0.7 0.3 0.3 0.1 0.2 -0.1
Bought in R&D 0.5 0.2 0.4 0.1 0.2 0.1
Machinery, equipment and IT 0.2 0.1 0.3 0.1 0.1 0.5
Training 0.3 0.1 0.5 0.0 0.1 0.3
Design expenditures 0.5 0.2 0.3 0.2 0.3 -0.1
Marketing expenditures 0.2 0.2 0.5 0.2 0.5 -0.2
External innovating -0.3 0.0 -0.1 0.1 0.4 0.6
Cooperation 0.4 0.6 0.2 0.1 0.0 0.1
Information from other businesses 0.0 0.8 0.0 0.2 0.0 0.0
Information from universities 0.3 0.8 0.1 0.1 0.0 0.0
Standards 0.0 0.9 0.0 0.1 0.1 0.0
Publications 0.2 0.8 0.1 0.1 0.1 0.1
Patents 0.9 0.2 0.0 0.0 0.1 -0.1
Design right 0.8 0.0 0.1 0.2 0.1 0.0
Copyright 0.6 0.1 0.1 0.3 0.1 -0.1
Graphic Artists 0.1 0.1 0.1 0.9 0.1 0.0
Design of objects and services 0.5 0.1 0.0 0.6 0.1 0.0
Multi-media/web 0.1 0.1 0.1 0.9 0.1 0.0
Software development 0.3 0.1 0.1 0.7 -0.1 0.2
Engineering/applied sciences 0.7 0.2 -0.1 0.1 -0.1 0.2
Mathematics and statistics 0.5 0.1 0.0 0.4 -0.1 0.4
Modes 1 to 6 are now used to predict productivity and changes in employment in Table 8. It is important to note that business output and employment growth might be negative over the period, due to the recession, but positive and significant
coefficients on any of the explanatory variables indicate that they have at least an offsetting effect and are associated with output or employment growth greater than it would otherwise have been.
Table 5. Regression model for sales per employee, change in sales and employment, with mixed modes using UKIS 2011
Dependent variable Sales per
employee
Change in sales
Change in employment
Independent variables 2010 2008 - 2010 2008 - 2010
Technology and IP driven 0.54** 0.229** 0.06** (0.05) (0.04) (0.02) Codified knowledge 0.19** 0.14** 0.05** (0.03) (0.02) (0.01) Wider innovating 0.02 0.129** 0.09** (0.03) (0.02) (0.01) Design skills driven 0.34** 0.229** 0.06** (0.03) (0.03) (0.01) Market facing -0.10** 0.03 0.02
(0.03) (0.02) (0.01)
External process modernizing 0.15** 0.161** 0.07** (0.04) (0.03) (0.01)
Employment 0.93** -0.13 -0.04** (0.01) (0.01) (0.01)
Industry dummies Included Included Included
Observations 8,136 7,892 8,021
R-squared 0.71 0.11 0.04
F-statistic 1,034.00 16.00 14.65 Authors’ own calculations. Regression method is OLS. We report regression coefficients with
standard errors in parentheses. Sales per employee refers to the calendar year 2010; and changes in sales to the change from 2008 to 2010. The data is the UKIS2011.
** p<0.01, * p<0.05, + p<0.1
The regression on sales per employee shows a positive association with the modes except for market facing and wider (managerial and organisational) innovation. There are also significant relationships with the design skills and the technology and IP driven mode that includes science and technology skills. Currently observed wider innovation is not significant in the productivity equation, which lends some support for the idea found in the management and innovation literature that managerial innovation may have a negative effect on current productivity by diverting
For the final column estimating change in employment, the design led and
technology and IP driven modes are, although somewhat smaller than in the other equations, positively correlated. A positive link between growth and the innovation strategy indicators over the downturn supports the thinking that innovation can ameliorate the impact of a recession. Together with the links between skills and innovation indicators this suggests that skills are both innovation and performance enabling. Especially important is the impact of skills driven innovating on growth during the downturn. Firms using, as part of their human capital, packages of specialised skills, show significantly better growth of output or employment in very difficult economic conditions. A striking feature of these models is that the ‘wider innovation’ mode is significantly related to growth indicators but not to productivity levels. This seems to contradict the expectation about the motivation for managerial innovation – that it is cost saving, which should be reflected in productivity. However it is consistent with other analyses by the authors:
The ‘wider innovation’ mode measured in 2006-2008 is significantly correlated with growth over that period (Annex E, Table E 7)
The use of good management practices codified in standards such as ISO 9001 supports innovation and shows a significant correlation with growth in employment (Frenz and Lambert, 2012, Tables 5.4 and 5.7).
Over the downturn period itself, the indicators of the shares of graduate employment – here standing both for skills intensity and for generic skills – do not emerge as significant in the growth equations. However the graduate employment share is a significant variable in the longer run innovation and performance relationships reported in Section 5.1.
We have presented a range of analytical models that relate innovation to design indicators and economic performance to modes of innovation that are characterised by, or strongly feature, design. The degree of significance suggests that design can be seen as a key creative element in innovation in firms and in the national
innovation system, where it also plays a leading role in linking other innovation determinants with business, market and economic outcomes. This pervasiveness is in stark contrast with the frequent treatment of design as an ancillary to innovation.
The models of innovation performance include substantial and statistically well
determined correlations between design – including skills and investment – and most other innovation indicators. This is in line with the results of the Design Council surveys which suggest design is a significant capability across the range of innovation outcomes. This is in contrast to the way design is understood and
measured in mainstream innovation analysis and metrics systems. For example, the international standard for innovation measurement – the Oslo manual – recognises that design is part of the complete innovation process but for measurement purposes stresses its role in marketing innovation as a way of varying presentation of a
product without affecting its functional or user characteristics.
6. Conclusions and policy
implications
Comparisons over time between investments in innovation related activities and innovation outputs reveal a fall during the downturn, with the exception of some business and management practices. However, innovative businesses performed better during the crisis.
New-to-market (novel) innovation and new-to-firm (imitation) innovation are important for business performance and growth.
This implies that effective policies to nurture innovation promote business performance even during adverse economic circumstances.
The employment of specific skills (such as product design, software development and engineering and applied sciences) generally shows a positive relationship with innovation performance during the survey period 2008 to 2010 and there is some indication that the more highly specialised of the skills (e.g. engineering and applied sciences) are distinctive drivers of innovation (not just a demand derived from innovation led by other factors).
This implies that specialised skills take-up is a legitimate feature of innovation policies both for the ability to absorb technology and external knowledge and as sources of creativity and innovation.
Design-related as well as Science & Technology (S&T) related skills are significantly associated with innovation, and design-related skills are important for services innovation.
This implies that design is important for successful innovation and balanced policy mix should include consideration of design, both in-house and outsourced design skills and across all business sectors.
Business performance during the downturn period was also positively correlated with innovation carried out as mixed modes (bundles of
complementary activities, for example, training, management practices and intellectual property protection) and especially with modes that feature specialised skills, although the direction of causation cannot be readily inferred in one survey sample.
This implies that monolithic policies that isolate one element in the innovation system, e.g. R&D, may not meet the spectrum of innovation relevant activities and their strategic combinations.
2012) reports a positive link between business growth and the take up of management standards such as ISO9001, supported by accreditation.
This implies role for encouraging improved management practices as part of innovation policy e.g. through accredited management standards.
References
AHRC and Design Council (2012). Measuring the Role and Value of Design,
http://www.designcouncil.org.uk/our-work/Insight/Research/Measuring-the-value-and-role-of-design/.
Alvarez, R, Benavente, JM, &Crespi, G (2010) Economic crisis and organisational change in developing countries: evidence from Chile. International Journal of
Technological Learning, Innovation and Development, 3: 67–87.
Archibugi, D, Filippetti, A and Frenz, M (2013a) Economic crisis and innovation: Is destruction prevailing over accumulation? Research Policy, 42: 303-314.
Archibugi, D, Filippetti, A and Frenz, M (2013b) The impact of the economic crisis on innovation: evidence from Europe, Technological Forecasting and Social
Change, 80: 1,247-1,260.
Awano, G, Franklin, F, Haskel, J and Zafeira-Kastrinaki, Z (2010), Investing in Innovation, NESTA.
Battisti, G and Stoneman, P (2010) How Innovative are UK Firms? Evidence from the Fourth UK Community Innovation Survey on Synergies between
Technological and Organizational Innovations, British Journal of Management, 21: 187-206.
Crespi, G, Criscuolo, C and Haskel, J (2007) Information technology, organisational change and productivity growth: evidence from UK firms. Centre for Economic Performance, London School of Economics and Political Science, London, UK, CEPDP, 783.
Dosi. G (1982) Technological paradigms and technological trajectories, Research
Policy 11: 147-162.
Freeman, C and Louca, F, (2001) As Times Goes By: From the Industrial Revolution
to the Information Revolution. Oxford University Press, Oxford.
Frenz, M and Ietto-Gillies, G (2009) The impact on innovation performance of different sources of knowledge. Evidence from the UK Community Innovation Survey, Research Policy 38: 1,125-1,135.
Frenz, M and Lambert, R (2009) Exploring Non-technological and Mixed Modes of Innovation Across Countries, Chapter 2 in Innovation in Firms: A Microeconomic
Perspective. OECD, Paris.
Frenz, M and Lambert, R (2011) Connected innovation: An international comparative study that identifies mixed modes of innovation, Birkbeck, Research Centre for
Frenz, M and Lambert, R (2012) Innovation Dynamics and the Role of the
Infrastructure, Department for Business, Innovation and Skills, Occasional Paper No. 3.
Filippetti, A and Archibugi, D (2010) Innovation in times of crisis: National Systems of Innovation, structure, and demand, Research Policy, 40: 179–192.
Gallouj, F and Windrum, P (2009). Services and services innovation. Journal of
Evolutionary Economics, 19(2), 141–148.
Kanerva, M and Hollanders, H (2009).The Impact of the Economic Crisis on
Innovation Analysis based on the Innobarometer 2009 survey, Innovation.
Report for the European Commission.
Kitching, J, Blackburn, R, Smallbone, D and Dixon, S (2009) Business Strategies
and Performance during Difficult Economic Conditions, Report for the UK
Department of Business, Innovation and Skills.
Kline, SJ and Rosenberg, N (1986) An overview of innovation, in R Landau and N Rosenberg (eds.), The Positive Sum Strategy: Harnessing Technology for
Economic Growth. Washington, D.C.: National Academy Press, pp. 275–305.
Leiponen, A and Drejer, I (2007) What exactly are technological regimes? Intra-industry heterogeneity in the organization of innovation activities. Research
Policy, 36(1),221-1,238.
Robson, S and Achur, J (2012) First Findings from the UK Innovation Survey 2011. Report published by the Department for Business, Innovation and Skills, May 2012.
Robson, S and Kenchatt, M (2010) First findings from the UK Innovation Survey 2009. Economic & Labour Market Review, 4: 28–35.
Schumpeter (1911 translated 1934) The Theory of Economic Development, Cambridge, MA: Harvard University Press.
Swann, GP (2010) The Economic Rationale for a National Design Policy. BIS Occasional paper, 2.
Tether, B (2005a). A Literature Review on Skills and Innovation: How Does
Successful Innovation Impact on the Demand for Skills and How Do Skills Drive
Innovation? Department of Trade and Industry.
Tether, B (2005b) The Role of Design in Business Performance. ESRC Centre for
Research on Innovation and Competition, University of Manchester.
Tether, B (2006) Design in Innovation: Coming Out from the Shadow of R&D, Department of Trade and Industry.
Toner, P (2011) Workforce Skills and Innovation: An Overview of Major Themes in
the Literature OECD Education Working Paper Series. Paris.
Annex A Data and methodology
Annex A first discusses the UK Innovation Surveys (UKIS). In particular, we discuss the latest UKIS2011, extensively used in the report, and compare the characteristics of UKIS2011 with that of the panel of around 900 enterprises that responded to all four waves of the survey. In the final section we discuss the methods used to analyse the data: basic descriptive statistics, regressions and factor analysis.
A.1 The UK Innovation Surveys
The UKIS provide direct responses from enterprises about their innovation and related activities. The UKIS 2011 has content that can be used for new lines of inquiry into subjects of great economic and policy interest. First, as the reference period, 2008 to 2010 covers the downturn in economic activity generated by the global financial crash, there is the opportunity to look at the level and effects of innovation over that period. The build-up of panels over the life of the UKIS also supports analysis of the longer-term interactions between innovation and the business cycle. Second, the latest survey includes questions on whether firms employ a specific set of skills, in addition to the long established question on the share of employees with graduate or above qualifications. This adds materially to the ability to research the role of skills and human capital in innovation at the micro level.
The surveys, currently in their 7th round, are collected by the Office for National Statistics and the Northern Ireland Department of Enterprise, Trade and Investment on behalf of the UK Department for Business, Innovation and Skills. Questionnaire and survey designed are based on a harmonized approach across European
countries, with country-specific adaptations, and the UK Innovation Surveys are the UK version of the so-called Community Innovation Survey (CIS) that is carried out in most European countries. In Work package 2 we explore a set of questions unique to the UK questionnaire on a wide range of skills – science and engineering,
multimedia and web-design, software development and database management, object and service design etc. (e.g. Robson and Achur, 2011).
The sample frame is the Inter-Departmental Business Register. Sampled are all those enterprises with 10 or more employees. Samples are stratified by three size bands, 2-digit industry sectors and 12 UK regions. Response rates of the surveys are typically high, around 50%. Questionnaires are administered via pen and paper, with follow up interviews on non-responses. For further information on the survey methodology, see, for example, Robson and Kenchatt, 2009 and Robson and Achur, 2011.
In the project we use the last four waves of the surveys, which were collected in 2005, 2007, 2009 and 2011, and are referred to as UKIS2005, 2007, 2009 and 2011. Reference periods are: (i) a three-year period, e.g. 2008 to 2010 in UKIS2011; or (ii)