BIROn - Birkbeck Institutional Research Online
James, J.M.B. and Cryar, A. and Thalassinos, Konstantinos (2019)
Optimization workflow for the analysis of cross-linked peptides using a
Quadrupole Time-of-Flight Mass Spectrometer. Analytical Chemistry 91 (3),
pp. 1808-1814. ISSN 0003-2700.
Downloaded from:
Usage Guidelines:
Please refer to usage guidelines at or alternatively
Optimization Work
fl
ow for the Analysis of Cross-Linked Peptides
Using a Quadrupole Time-of-Flight Mass Spectrometer
Juliette M. B. James,
†Adam Cryar,
†,‡and Konstantinos Thalassinos
*
,†,§†Institute of Structural and Molecular Biology, Department of Structural and Molecular Biology, University College London, Gower
Street, London, WC1E 6BT, United Kingdom
‡LGC Group, Queen’s Road, Teddington, TW11 0LY, United Kingdom
§Institute of Structural and Molecular Biology, Department of Biological Sciences, Birkbeck, University of London, London, WC1E
7HX, United Kingdom
*
S Supporting InformationABSTRACT: Cross-linking mass spectrometry is an emerging structural biology technique. Almost exclusively, the analyzer of choice for such an experiment has been the Orbitrap. We present an optimized protocol for the use of a Synapt G2-Si for the analysis of cross-linked peptides. Wefirst tested six different energy ramps and analyzed the fragmentation behavior of cross-linked peptides identified by xQuest. By combining the most successful energy ramps, cross-link yield can be increased by up to 40%. When compared to previously published Orbitrap data, the Synapt G2-Si also offers improved fragmentation of theβ peptide. In order to improve cross-link quality control we have also developed ValidateXL, a programmatic solution that works with existing cross-linking software to improve cross-link quality control.
C
ross-linking mass spectrometry (XLMS) can be used to gain structural insights into proteins and complexes that cannot easily be studied by high-resolution structural techniques.1,2 Cross-linking is based on the covalent bonding of two amino acids that lie within a certain proximity. This low-resolution fixation of structure provides information on both distance restraints and solvent accessibility. Following digestion of the cross-linked species, a mixture containing both linear and cross-linked peptides is produced. One of the challenges of a cross-linking experiment is that cross-links are low in abundance. As a result, their signal is often suppressed by more intense linear peptide ions during analysis.3 Earlier studies utilized an LTQ-Orbitrap mass analyzer, with most experimental designs using linear ion trap (LIT) for both collision-induced dissociation (CID) and analysis of fragment ion spectra.4−6 The lower resolution data obtained using the LIT, however, may lead to incorrect assignments of peptide sequence. This in turn causes an increased risk of missed or false positive cross-link assignment. Current developments in the field now recognize that the accuracy of this analyzer is insufficient to correctly annotate fragment ions, with higher energy collision dissociation (HCD) becoming the dominant analysis method.7Recent advancements in time-of-flight (TOF) technology have allowed an increase in achievable resolving power, providing fragment ion scans up to 40 000 fwhm.8In addition, TOF resolving power does not depend on acquisition time,
offering a near constant resolution across the mass range and faster scan speeds compatible with ultrahigh performance liquid chromatography (UPLC) for both precursor and fragment ion scans.9,10Furthermore, the ability to seamlessly integrate quadrupole time-of-flight analysers (QTOFs) with ion mobility separation (IMS) offers an extra degree of separation by size, shape, and charge, without the requisite need for additional analysis time.11This potentially provides an opportunity to increase cross-link yield through exploitation of the larger and more highly charged nature of cross-linked peptides.
Although cross-linked peptides have been studied using a variety of analyzers, including QTOFs,18,29−31the majority of cross-linking studies have been performed on Orbitrap mass analyzers. As a consequence, current cross-linking software has been optimized for Orbitrap data. Furthermore, a recent study showed that HCD and ion trap CID required different collision energies for optimal fragmentation of cross-linked peptides.12 It is therefore also necessary to perform optimization of collision energies for the analysis of cross-linked peptides on a QTOF instrument.
Here, we present an optimized method for the analysis of cross-linked peptides analyzed using a QTOF geometry. We
Received: May 24, 2018 Accepted: January 8, 2019 Published: January 8, 2019
Article
pubs.acs.org/ac Cite This:Anal. Chem.2019, 91, 1808−1814
License, which permits unrestricted use, distribution and reproduction in any medium, provided the author and source are cited.
Downloaded via BIRKBECK UNIV OF LONDON on February 25, 2019 at 08:25:38 (UTC).
performed triplicate analysis of six different energy ramps in order to determine the optimal energy for cross-link fragmentation. The resulting approach allows QTOF data to be analyzed with existing cross-linking software, xQuest,13with minimal adaptations. We analyze the effects of collision energy on the fragmentation efficiency of bovine serum albumin cross-linked with isotopically labeled bis(sulfosuccinimdyl) suberate (BS 3d0d12). We offer a programmatic solution, ValidateXL.-py, which works with resultfiles from xQuest to improve cross-link quality control and reduce manual validation. This software is freely available to download at https://github. com/ThalassinosLab/ValidateXL. Finally, in contrast to data collected from Orbitrap analyzers14 we also demonstrate improved fragmentation of theβpeptide in the cross-link.
■
RESULTS AND DISCUSSION [image:3.625.60.566.59.200.2]In order to determine the most efficient settings for cross-link fragmentation using a QTOF, a comparison of fragmentation energies was carried out using the collision energy ramps described. The ramps were tested in triplicate using cross-linked bovine serum albumin (BSA). Data were then analyzed by xQuest according to the workflow outlined in Figure 1A. Although only minor adaptations were necessary, QTOF data sets were not immediately readable and required further conversion by MSConvert. In addition, a far greater number of cross-link identifications were found, with improved scores, when using the slow de-isotoping algorithm during data processing at both the precursor and fragment ion level (Figure S1, parts A and B, andTable S1).
Figure 1.(A) Data formatting pipeline for use of xQuest with Waters QTOF data. (B) Comparison of xQuest scores for all identified unique BSA
link peptide pairs across six energy ramps: scores above 20 (purple), scores below 20 (lilac). Numbers above bars indicate a count of cross-links scoring above 20. (C) Mean and standard deviation for number of manually validated unique BSA cross-link peptide pairs in triplicate analysis of all six energy ramps.
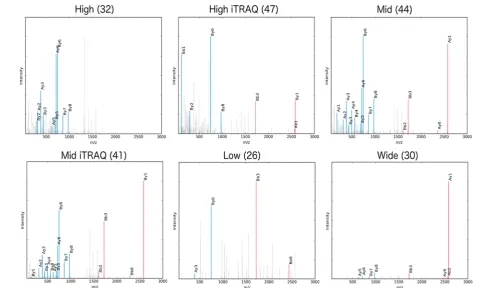
Figure 2.Example spectra for cross-link ID DTHKSEIAHR-FKDLGEEHFK (a4, b2). Cross-linked fragment ions are shown in red, and linear
fragment ions are in blue. xQuest scores are shown in brackets. A loss of cross-linked fragment ions is observed in the high energy ramp.
Analytical Chemistry Article
DOI:10.1021/acs.analchem.8b02319
[image:3.625.66.556.257.545.2]Cross-links that pass a prescoringfilter are all returned to the user by xQuest. A final score threshold of 30 was originally recommended to determine true positive cross-link
identi-fications.15 More recent analysis revised this score to 16 for trypsin digests where this work also revealed a dependence of score threshold on the enzyme used to digest samples.16 Following evaluation of the various scoring thresholds we chose a conservative score of 20 in our initial validation (Figures S2−S4). All identified unique BSA cross-linked peptides are shown in Figure 1B. Unique cross-links include those with linkages in the same absolute position but with different peptide lengths and/or modifications such as oxidized methionine.12
Overall, there is good reproducibility in the cross-links scoring above 20 (Figures S5−S10). The technical replicates of the mid energy ramp contain the greatest degree of overlap with 38 identical cross-link residue pairs appearing in all three repeats. The high-iTRAQ and mid-iTRAQ repeats contain an intersection of 23 and 22 identifications, respectively (Figures S5−S8). The mid energy ramp is the most reproducible and identifies the most high-scoring cross-links: 103, 111, and 131 in the respective triplicate analysis.
[image:4.625.346.546.348.626.2]Cross-links were then manually validated in the raw data by confirming their charge, mass-to-charge ratio (m/z), and the presence of doublet precursors with a 12 Da mass shift, corresponding to the d0 and d12 versions of the cross-linker.
Figure 1C shows the mean and standard deviation for the validated cross-links found in the triplicate studies. The wide energy ramp and those including the iTRAQ (isobaric tags for relative and absolute quantitation) method display the highest degree of variability. This is most likely due to the broad range of energies sampled by these ramps. The iTRAQ method and the wide energy ramp expose peptides to low collision energies irrespective of their m/z. The iTRAQ method does so in a temporal manner with 50% of the scan time devoted to these low ranges.17 The wide energy ramp encompasses the full range of energies tested by allfive ramps. As the m/z of the cross-link increases the range of energies it is exposed to also increases. Thus, by reducing the selectivity of the energy range a greater distribution of fragmentation patterns are observed. This most likely leads to greater variability in the number of cross-links identified. In Figure 1C the high-iTRAQ method shows the best performance of all energy ramps. This is due to variability in the performance of the second and third technical replicates (Figure S2) and is most likely the result of the broader range of energies applied in the iTRAQ method. At higher scoring thresholds the mid energy ramp continues to perform the best (Figure S4). The combination of all three triplicates analyzed using the mid energy ramp identified the highest number, some 277 unique cross-links (see the
Supporting Information). As defined above, unique cross-links are described by their sequence not solely their position. Hence, this high number of identifications is due to differences in peptide lengths and modifications.
To assess the fragmentation patterns of the cross-links tandem mass spectrometry (MS/MS) spectra were interro-gated for the presence of cross-linked and linear fragment ions.
Figure 2 shows spectra for one of the three cross-links identified by all of the energy ramps (see alsoFigure S11 for another such peptide). Ions corresponding to cross-linked fragments are shown in red, and linear ones are in blue. It can be seen that the high energy ramp contains no cross-linked fragment ions. The sequence coverage of the low and wide
energy ramps are considerably worse, with the base peak in the wide energy ramp representing the intact cross-linked precursor. As this ramp covers a vast range of energies over the course of the scan, insufficient time is spent at any one energy to achieve efficient fragmentation. The mid energy ramp appears to offer the best fragmentation for this cross-link, providing the highest degree of sequence coverage. It should also be noted that, despite the poor sequence coverage of the cross-link in both the low and wide energy ramps, xQuest scores each favorably at 26 and 30, respectively. This shows that although a score threshold is necessary it is not sufficient to differentiate reliable cross-link identifications.
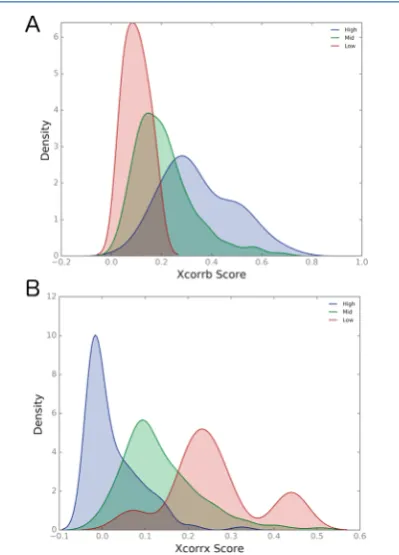
xQuest distinguishes between the two types of fragment ions and scores the correlation between the observed and theoretical fragment ion spectra separately for each type of ion. The results of these correlations are reported as two subscores: XCorrx for cross-linked fragment ions and XCorrb for linear fragment ions. In order to better visualize the effects of the ramps on each type of fragment ion produced, a kernel density estimation (KDE) was performed on the XCorrx and XCorrb subscores. Kernel density estimation estimates the underlying probability distribution from which a sample is drawn. It requires that each instance within the sample is both independent and identically distributed. Parts A and B of
Figure 3show a comparison of the estimated distribution for
both the linear fragment ion correlation score and the cross-linked fragment ion correlation score, for the high, mid, and low energy ramps.
For the linear fragment ion correlation the low ramp performs poorly while the high ramp performs well, as indicated by the shifts in KDE in Figure 3A. This suggests that at lower energies linear peptides are fragmenting less efficiently. InFigure 3B the opposite phenomenon is observed.
Figure 3. KDE comparison of high (blue), mid (green), and low
(red) energy ramps across (A) XCorrb and (B) XCorrx xQuest subscores.
For cross-linked fragment ions the low ramp performs better than the high ramp. These results demonstrate an opposing effect between preserving cross-linked fragments and obtaining sufficient sequence coverage for linear peptides. It is, therefore, not surprising that the mid energy ramp provides a higher overall number of cross-link identifications when used in combination with the xQuest analysis software.
To further examine the fragmentation patterns associated with each ramp, we analyzed the data for the presence of BS3/ DSS diagnostic ions18(Figure 4). These ions have previously
been identified in 71% of cross-link spectra analyzed by HCD.19In good agreement with previous studies wefind that at high energy 52% of cross-link spectra contain the tetrahydropyridine modification (Table 1). The negative XCorrx scores in the high energy are likely due to the fragmentation of the cross-linker amide bond preventing the observation of cross-linked fragment ions.
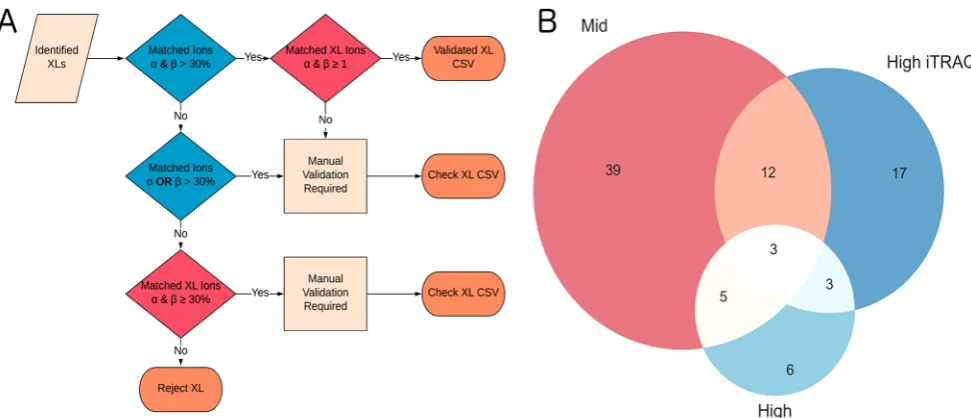
When cross-links are utilized in structural modeling approaches, cross-link residue pairs, defined solely by their position in the structure, are of paramount importance.2,20To compare in detail the effects of the collision energy ramps on residue pair identifications, cross-links were further validated using in-house software (Figure 5A). The program works with the xQuest xml resultfiles tofilter cross-links based on whether the identification meets the more recent published standards for confident cross-link assignment.7 These include signal/ noise, fragmentation of both peptides, and the presence of both cross-linked and linear fragment ions. As expected, these more stringent criteria lower the overall number of identifications (Figure 5B).
The identifications exposed by the high ramp were reduced significantly, with a mean cross-link identification rate of 11 (Figure S12). As mentioned, this is most likely due to the loss of cross-linked fragment ions. The mid ramp remains the best performing identifying 37, 37, and 39 cross-links in each of the technical repeats (Table S2). In addition, the intersection of the three best performing ramps shows that there is little
overlap between the identifications made by each one (Figure 5B). (The intersection for all energy ramps is shown inFigure S13.)
Incorporating one or more energy ramp leads to a higher number of cross-link identifications. This can be explained by the relationship between fragmentation efficiency and m/z.21 Cross-links are composed of two peptides each with their own optimal fragmentation energy. By combining different energy ramps, optimal fragmentation of up to 40% more diverse cross-link identities can be achieved (Figure 5B).
It has frequently been reported that fragmentation of both peptides within a cross-link is not symmetric.7,12,14,19 One peptide, in most cases the larger of the two, will fragment more readily than the other, so a higher sequence coverage is observed. In line with xQuest we define the larger of the two peptides within the cross-link as theαpeptide for this analysis.
Figure 6displays the distribution of annotated peaks for both the α (lilac) and β (purple) peptides within the cross-links. Across most of the energy ramps theαpeptide fragments more than the β peptide, with the only exception being the low ramp. However, annotation of both peptides is higher than 40%. This is in contrast to previous reports, when using both ion trap CID14and HCD12with an Orbitrap analyzer, where theβpeptide consistently displayed poorer fragmentation. In the case of ion trap CID only 22% of the most intense annotated fragment ions corresponded to the β peptide.14 Kolbowski et al. attribute this phenomenon to the nature of cross-linked peptides rather than the cross-linker used.12
One possible explanation for this difference in β-peptide annotation may involve the way fragmentation energy values by vendor instrument operator software are calculated. Normalized collision energy reported by ThermoScientific is a linear percentage of the available collision energy, which compensates for the mass dependency of optimal collision energy.22An ion of a particularm/zvalue will be exposed to a single energy value. As previously discussed, the Waters Corporation energy ramp exposes a precursor of a particular
m/zto a range of energies across the course of a scan. As cross-links are a combination of two peptides, each with differentm/
z ranges, this may be advantageous; the optimal energy for fragmentation is unlikely to be related solely to them/zof the entire species.
xQuest does not consider ions generated through fragmentation of both peptides in a cross-link. As the software was written to using data from fragment ions generated by ion trap CID, with a mass range of 200−2000 Da, immonium ions are also not considered. These ions are diagnostic of the presence of specific amino acids in a peptide and are often used in de novo peptide sequencing. During analysis of fragment ion spectra the presence of these ions was found to inhibit rather than enhance the xQuest scoring algorithms. Figure 7 shows the fragment ion spectra of a monolink identified by xQuest. Immonium ions for both lysine, following the loss of ammonia (84 Da) and valine (72 Da), are present and indicated in the
figure. The mass shift between these ions is 12 Da; xQuest has erroneously identified the peak at 84 Da as a cross-linked peak. Although xQuest can be modified to include a wider mass range, it cannot annotate the peaks correctly as the algorithms do not expect the presence of immonium ions. As the correlation algorithm does not have a low-mass cutoff this leads to unannotated peaks in the spectra and poorer overall correlation of the theoretical and observed cross-linked fragment ions. Adjustment of the xQuest search parameters
Figure 4. Representation of BS3/DSS diagnostic ions created in
ChemDraw 16.0. Diagnostic ions are created by fragmentation of the amide bond in the cross-linker.
Table 1. Percentage of Modified Cross-Linker Ions Present in Spectra for All Energy Ramps
m/z high ramp % mid ramp % low ramp %
139.1 11 4 0
222.1 52 15 3
Analytical Chemistry Article
DOI:10.1021/acs.analchem.8b02319
to include a wider mass range is therefore not recommended as a necessary modification for searching QTOF data.
■
CONCLUSIONQTOF mass spectrometers are ubiquitous in most lines of MS research including metabolomics, proteomics, and small-molecule analysis; however, they have not yet been widely applied to the field of cross-linking mass spectrometry. We have shown that QTOF instruments can indeed be used to analyze cross-linked peptide samples and that data from this instrument configuration can be processed directly with existing cross-linking software applications, with little mod-ification to their parameters. Due to the unique divergent energy ramp that applies a range of energies across each scan we have demonstrated that the Synapt G2-Si offers improved fragmentation of theβpeptide when compared with published data collected on an Orbitrap instrument.12,14Our analysis also shows that, by combining two energy ramps that occupy alternate energy ranges, different cross-links can be identified. This presents a unique opportunity to improve cross-link yield by up to 40%.
Given that adaptation to collision energy is not required for the analysis of different cross-linker chemistries by an Orbitrap,23 this protocol could be applicable to a broad range of cross-linkers. This includes the widely used MS cleavable cross-linkers.24,25
In addition, validation of the results is laborious; time requirements increase with cross-link yield. Employment of a simple score threshold serves only as a guide. We offer a programmatic solution which works directly with the xQuest result xmlfile to gain confidence in the results generated from the search. This enables cross-link identifications to feed directly into structural modeling approaches, as we have previously shown that higher quality cross-link identifications are more beneficial for modeling purposes.20,26,27
[image:6.625.69.555.65.274.2]Finally, the development of an optimized method for the analysis of cross-linked peptides on a QTOF provides the groundwork for exploration of the addition of IMS to a cross-linking experiment. This gas-phase fractionation is conducted online and may lead to a reduction in sample preparation
Figure 5.(A) Schematic representation of ValidateXL.py workflow. (B) Overlap of validated cross-links for the three best performing ramps. As
[image:6.625.74.285.312.473.2]limited overlap in cross-links is observed between the ramps, identification rates can be increased by combining one or more energy ramp.
Figure 6.Relative frequency of annotated α and βfragment peaks
from identified ions. The height refers to the mean for each energy ramp. Error bars display the standard deviation.
Figure 7. Misallocation of lysine immonium ion (following loss of
ammonia) as a linked peak by xQuest software. Erroneous cross-linked peak determination affects scoring algorithms.
[image:6.625.65.301.518.696.2]requirements. Furthermore, the extra separation provided by IMS separates low-intensity ions from chemical noise allowing the data-dependent acquisition (DDA) process to select them for MS/MS.
■
EXPERIMENTAL SECTIONReagents and Apparatus.BSA (A7030) and BS3 d0/d12 were purchased from Sigma-Aldrich (St. Louis, MO) and Creative Molecule Inc., respectively. Rapigest and solid-phase extraction (SPE) cartridges (50 mg Sep-Pak C18) were purchased from Waters Corporation (Milford, MA, U.S.A.). The Superdex Peptide PC 3.2/3.0 column was purchased from GE Healthcare (Piscataway, NJ).
Sample Preparation.Amounts of 0.3 mg/mL BSA and 1 mg BS3 d0/d12 were prepared in 20 mM HEPES at pH 7.6. The cross-linker was added to the protein and diluted to afinal concentration of 2.5 mM BS3 d0/d12. The sample was then incubated at room temperature for 40 min under mild agitation. Following incubation, the reaction was quenched by adding 1 M ammonium bicarbonate to afinal concentration of 50 mM. The samples were then evaporated to dryness in a vacuum concentrator and resuspended in 8 M urea at 1.1 mg/ mL concentration.
A solution of 1% RapiGest to afinal concentration of 0.1% was added to aid solubilization before digestion. The sample was then incubated with 10 mM dithiothreitol at 37°C for 30 min to denature the protein and reduce the disulfide bonds. Following incubation, the sample was cooled to room temperature. In order to prevent disulfide bond reformation iodoacetamide was added to afinal concentration of 20 mM. As iodoacetamide is unstable when exposed to light the mixture was incubated in the dark, at room temperature for 30 min. The sample was then diluted with 50 mM ammonium bicarbonate to reduce thefinal concentration of urea to <1 M. Trypsin 50:1 protein to enzyme was added to the sample. The reaction mixture was incubated overnight at 37°C with mild agitation. Following overnight incubation enzymatic activity was quenched by adding formic acid to afinal concentration of 2% (v/v). In preparation for size exclusion chromatography (SEC) fractionation the sample was purified using Sep-Pak SPE cartridges and evaporated to dryness.
Following SPE the sample was resuspended in 20μL of SEC buffer (degassed water/acetonitrile/TFA at 70/30/0.1 v/v/v). An amount of 15 μL of sample was injected onto an equilibrated Superdex Peptide column. Fractions of 100 μL were collected. The samples were then evaporated to dryness and resuspended in 10 μL of liquid chromatography−mass spectrometry (LC−MS) buffer: 95% H2O, 5% acetonitrile, and 0.1% formic acid.
LC−MS/MS Analysis.Samples were introduced using nano ultraperformance liquid chromatograph (10kPsi nanoACQ-UITY Waters) with buffers (A) MS grade water with 0.1% formic acid and (B) MS grade acetonitrile with 0.1% formic acid. Samples were desalted by a reversed-phase Symmetry C18 trap column (180μm internal diameter, 20 mm length, 5
μm particle size, Waters Corporation) at aflow rate of 8μL/ min for 3 min in 99% buffer A. Peptides were then separated using a linear gradient (0.3μL/min, 35°C; 97−60% buffer A over 90 min) using a BEH130 C18 nanocolumn (75 μm internal diameter, 400 mm length, 1.7μm particle size, Waters Corporation). The TOF analyzer was externally calibrated fromm/z175.11 to 1285.54 using [Glu1]-fibrinopeptide B at 500 fmol/μL.
Data-Dependent Acquisition. Samples were analyzed using a Waters Synapt G2-Si quadrupole time-of-flight mass spectrometer tuned to a resolution of 20 000 (fwhm). Accurate mass measurements were made using DDA. The top 10 most intense precursors with charge states between +3 and +7 were selected over a mass range of 50−3000 Da with a scan time of 0.15 s and an interscan delay of 0.05 s. MS2 spectra were acquired using collision energy ramps specified inTable 2.
Cross-Linking Analysis. Raw files were processed in PLGS v3.2.0 (Waters) using slow de-isotoping algorithm for both MS and MS2 data. After PLGS processing, thefiles are exported in mascot generic format (mgf) and further converted to mzXML format for input to xQuest.4 Conversion to mzXML was accomplished with MSConvert (v3.0.7414) using 32-bit binary encryption.
xQuest was designed and trained on sample data obtained from an Orbitrap mass analyzer operated with ion trap CID, as such modifications to the search parameters were necessary to accommodate QTOF data. These can be found inTables S3− S7. Briefly, data obtained from an Orbitrap mass analyzer differs from data obtained in a QTOF as it is not deconvoluted and contains multiple charge state fragment ions. Tolerance for peak matching was adjusted to 5 ppm for precursors and 10 ppm for fragment ions. Additional search parameters included the following: cross-linking was assumed to occur with lysines, tyrosine, serine, threonine, and the protein N′ terminus; two possible missed cleavages; variable modification of methionine oxidation; fixed modification of cysteine carbamidomethyla-tion. The mass spectrometry proteomics data have been deposited to the ProteomeXchange Consortium via the PRIDE28 partner repository with the data set identifier PXD011704.
ValidateXL.ValidateXL is available to download athttps:// github.com/ThalassinosLab/ValidateXL.
ValidateXL.py is a python script written in Python 3.5. ValidateXL.py analyses the xQuest merged_xquest.xml files which are generated and stored in the xQuest resultfile after a completed search.
[image:7.625.325.565.184.280.2]ValidateXL extracts information from the XMLfiles to assess the quality of a cross-link identification based upon the signal/ ratio of both the cross-linked and linear fragment ions. Itfilters cross-links and creates three CSVfiles: cross-links which are of significantly high quality to be used for modeling, cross-links that require manual validation, and cross-links that should be rejected. ValidateXL requires the XML and fastafiles for the protein of interest and will run on multiple xQuest search results. For full description and details on usage can be found in theSupporting Information.
Table 2. Overview of Collision Energy Ramps Tested
ramp
low mass (start−end) eV
high mass
(start−end) eV iTRAQ eV
high 6−9 67−84
high-iTRAQa 6−9 67−84 15
mid 10−20 30−60
mid-iTRAQa 10−20 30−60 15
low 6−9 10−20
wide 6−9 15−84
aFor details of iTRAQ method see text.
Analytical Chemistry Article
DOI:10.1021/acs.analchem.8b02319
■
ASSOCIATED CONTENT*
S Supporting InformationThe Supporting Information is available free of charge on the
ACS Publications website at DOI: 10.1021/acs.anal-chem.8b02319.
Details of PLGS parameter testing, score distributions and analysis of different scoring thresholds, intersection of technical repeats for all tested energy ramps, additional spectra for cross-links identified, heat map displaying full cross-link overlap across all six ramps, ValidateXL results, mean and standard deviation for all energy ramps following ValidateXL analysis, full modifications made to the xquest.def input file, and ValidateXL.py dependencies and operational guidelines (PDF)
Intersection of cross-link identifications from PLGS testing (XLSX)
Intersection of cross-links identified by the mid energy ramp (XLSX)
■
AUTHOR INFORMATION Corresponding Author*E-mail:[email protected].
ORCID
Juliette M. B. James:0000-0003-3946-9546
Konstantinos Thalassinos: 0000-0001-5072-8428
Author Contributions
All authors have given approval to the final version of the manuscript.
Notes
The authors declare no competingfinancial interest.
■
ACKNOWLEDGMENTSThe authors thank Hans Vissers for critical reviewing of the manuscript and Alexander Leitner for version 2.1.3 of xQuest and his support in interpreting the software. This work was supported by the Wellcome Trust 209250/Z/17/Z and 104913/Z/14/Z.
■
REFERENCES(1) Rappsilber, J.J. Struct. Biol.2011,173, 530−540.
(2) Degiacomi, M. T.; Schmidt, C.; Baldwin, A. J.; Benesch, J. L. P.
Structure2017,25, 1751−1757.
(3) Sinz, A.J. Mass Spectrom.2003,38, 1225−1237.
(4) Rinner, O.; Seebacher, J.; Walzthoeni, T.; Mueller, L.; Beck, M.; Schmidt, A.; Mueller, M.; Aebersold, R.Nat. Methods2008,5, 315− 318.
(5) Brodie, N. I.; Popov, K. I.; Petrotchenko, E. V.; Dokholyan, N. V.; Borchers, C. H.Sci. Adv.2017,3, e1700479.
(6) Mühlbacher, W.; Sainsbury, S.; Hemann, M.; Hantsche, M.; Neyer, S.; Herzog, F.; Cramer, P.Nat. Commun.2014,5, 4310.
(7) Iacobucci, C.; Sinz, A.Anal. Chem.2017,89, 7832−7835. (8) Beck, S.; Michalski, A.; Raether, O.; Lubeck, M.; Kaspar, S.; Goedecke, N.; Baess-Mann, C.; Hornburg, D.; Meier, F.; Paron, I.; Kulak, N. A.; Cox, J.; Mann, M.Mol. Cell. Proteomics2015,14, 2014− 2029.
(9) Zubarev, R. A.; Makarov, A.Anal. Chem.2013,85, 5288−5296. (10) Patel, V. J.; Thalassinos, K.; Slade, S. E.; Connolly, J. B.; Crombie, A.; Murrell, J. C.; Scrivens, J. H.J. Proteome Res.2009,8, 3752−3759.
(11) Pringle, S. D.; Giles, K.; Wildgoose, J. L.; Williams, J. P.; Slade, S. E.; Thalassinos, K.; Bateman, R. H.; Bowers, M. T.; Scrivens, J. H.
Int. J. Mass Spectrom.2007,261, 1−12.
(12) Kolbowski, L.; Mendes, M. L.; Rappsilber, J.Anal. Chem.2017,
89, 5311−5318.
(13) Walzthoeni, T.; Claassen, M.; Leitner, A.; Herzog, F.; Bohn, S.; Förster, F.; Beck, M.; Aebersold, R.Nat. Methods2012,9, 901−903. (14) Giese, S. H.; Fischer, L.; Rappsilber, J.Mol. Cell. Proteomics
2016,15, 1094.
(15) Leitner, A.; Walzthoeni, T.; Aebersold, R.Nat. Protoc.2014,9, 120−137.
(16) Leitner, A.; Reischl, R.; Walzthoeni, T.; Herzog, F.; Bohn, S.; Förster, F.; Aebersold, R. Mol. Cell. Proteomics 2012, 11, M111.014126.
(17) Wiese, S.; Reidegeld, K. A.; Meyer, H. E.; Warscheid, B.
Proteomics2007,7, 340−350.
(18) Iglesias, A. H.; Santos, L. F.; Gozzo, F. C. J. Am. Soc. Mass Spectrom.2009,20, 557−566.
(19) Trnka, M. J.; Baker, P. R.; Robinson, P. J.; Burlingame, A.; Chalkley, R. J.Mol. Cell. Proteomics2014,13, 420−434.
(20) Bullock, J. M. A.; Schwab, J.; Thalassinos, K.; Topf, M.Mol. Cell. Proteomics2016,15, 2491−2500.
(21) Neta, P.; Simon-Manso, Y.; Yang, X.; Stein, S. E.J. Am. Soc. Mass Spectrom.2009,20, 469−476.
(22) Normalized Collision Energy Technology. Thermo Scientific Product Support Bulletin, 2009; Vol.104.
(23) Giese, S. H.; Belsom, A.; Rappsilber, J.Anal. Chem.2016,88, 8239−8247.
(24) Müller, M. Q.; Dreiocker, F.; Ihling, C. H.; Schäfer, M.; Sinz, A.
Anal. Chem.2010,82, 6958−6968.
(25) Hage, C.; Iacobucci, C.; Rehkamp, A.; Arlt, C.; Sinz, A.Angew. Chem., Int. Ed.2017,56, 14551−14555.
(26) Kahraman, A.; Herzog, F.; Leitner, A.; Rosenberger, G.; Aebersold, R.; Malmstrom, L.PLoS One2013,8, e73411.
(27) Schmidt, C.; Robinson, C. V.Nat. Protoc.2014,9, 2224−2236. (28) Vizcaíno, J. A.; Csordas, A.; del-Toro, N.; Dianes, J. A.; Griss, J.; Lavidas, I.; Mayer, G.; Perez-Riverol, Y.; Reisinger, F.; Ternent, T.; Xu, Q. W.; Wang, R.; Hermjakob, H. Nucleic Acids Res. 2016, 44
(D1), D447−D456.
(29) Back, J. W.; Hartog, A. F.; Dekker, H. L.; Muijsers, A. O.; de Koning, L. J.; de Jong, L.J. Am. Soc. Mass Spectrom.2001,12, 222− 227.
(30) Trester-Zedlitz, M.; Kamada, K.; Burley, S. K.; Fenyo, D.; Chait, B. T.; Muir, T. W.J. Am. Chem. Soc.2003,125, 2416−2425.
(31) Pearson, K. M.; Pannell, L. K.; Fales, H. M.Rapid Commun. Mass Spectrom.2002,16, 149−159.