BIROn - Birkbeck Institutional Research Online
Tierney, Adam and Kraus, N. (2015) Neural entrainment to the rhythmic
structure of music. Journal of Cognitive Neuroscience 27 (2), pp. 400-408.
ISSN 0898-929X.
Downloaded from:
Usage Guidelines:
Please refer to usage guidelines at or alternatively
Uncorrected
Proof
Neural Entrainment to the Rhythmic Structure of Music
Adam Tierney and Nina Kraus
Abstract
■ The neural resonance theory of musical meter explains musical beat tracking as the result of entrainment of neural oscillations to the beat frequency and its higher harmonics. This theory has gained empirical support from experiments using simple, abstract stimuli. However, to date there has been no empirical evidence for a role of neural entrainment in the perception of the beat of ecologically valid music. Here we presented participants with a single pop song with a super-imposed bassoon sound. This stimulus was either lined up with
the beat of the music or shifted away from the beat by 25% of the average interbeat interval. Both conditions elicited a neural response at the beat frequency. However, although the on-the-beat condition elicited a clear response at the first harmonic of the beat, this frequency was absent in the neural response to the off-the-beat condition. These results support a role for neural entrainment in tracking the metrical structure of real music and show that neural meter tracking can be disrupted by the pre-sentation of contradictory rhythmic cues. ■
INTRODUCTION
Temporal patterns in music are organized metrically, with stronger and weaker beats alternating. This alternation takes place on multiple timescales, resulting in a complex sequence of stronger and weaker notes. Position within the metrical hierarchy affects how listeners perceive sounds; strong metrical positions are associated with higher goodness-of-fit judgments and enhanced duration discrimination (Palmer & Krumhansl, 1990). The musical beat is perceived where strong positions at multiple time-scales coincide, although individual differences exist in the scale at which listeners perceive the beat (Iversen & Patel, 2008; Drake, Jones, & Baruch, 2000).
Metrical processing begins early in life: Brain responses to rhythmic sounds in newborn infants are modulated by each soundʼs position in the metrical hierarchy (Winkler, Haden, Ladinig, Sziller, & Honing, 2009). Metrical per-ception is, therefore, a fundamental musical skill, and as such there have been numerous attempts to model how listeners track metrical structure. An influential model proposes a bank of neural oscillators entraining to the beat (Velasco & Large, 2011; Large, 2000, 2008; Van Noorden & Moelants, 1999; Large & Kolen, 1994), resulting in saliency oscillating on multiple timescales (Barnes & Jones, 2000; Large & Jones, 1999). This model is supported by work showing that beta oscillations are modulated at the rate of presentation of rhythmic stimuli (Fujioka et al., 2012), possibly reflecting auditory–motor coupling, as well as work showing enhanced perceptual discrimination and detection when stimuli are aligned with a perceived beat (Bolger, Trost, & Schön, 2013; Miller, Carlson, & McAuley,
2013; Escoffier, Sheng, & Schirmer, 2010; McAuley & Jones, 2003; Jones, Moynihan, MacKenzie, & Puente, 2002; Barnes & Jones, 2000).
There is, however, no direct evidence for neural en-trainment to metrical structure in real music. ( We define “neural entrainment” in this paper as phase-locking of neural oscillations to the rhythmic structure of music.) Most investigations of the neural correlates of rhythm pro-cessing have used simple stimuli such as tone sequences and compared evoked responses to stimuli in strong and weak metrical positions. Studies of simple stimuli have found that strong metrical percepts are associated with larger evoked potentials and higher-amplitude evoked and induced beta and gamma oscillations (Schaefer, Vlek, & Desain, 2011; Vlek, Gielen, Farquhar, & Desain, 2011; Fujioka, Zendel, & Ross, 2010; Geiser, Sandmann, Jäncke, & Meyer, 2010; Abecasis, Brochard, del Río, Dufour, & Ortiz, 2009; Iversen, Repp, & Patel, 2009; Ladinig, Honing, Háden, & Winkler, 2009; Potter, Fenwick, Abecasis, & Brochard, 2009; Winkler et al., 2009; Pablos Martin et al., 2007; Abecasis, Brochard, Granot, & Drake, 2005; Snyder & Large, 2005; Brochard, Abecasis, Potter, Ragot, & Drake, 2003). Studies of simple stimuli have also demonstrated neural entrainment to a perceived beat and its harmonics (Nozaradan, Peretz, & Mouraux, 2012; Nozaradan, Peretz, Missal, & Mouraux, 2011). Furthermore, a recent study has shown that alignment with the beat of real, ecologically valid music modulates evoked responses to a stimulus (Tierney & Kraus, 2013) such that on-the-beat stimuli elicit larger P1 responses; however, this result can either be attributed to enhancement of processing of the target stimulus or to neural tracking of the beat of the music. Thus, no study to date has demonstrated neural entrain-ment to the rhythmic structure of real music.
Uncorrected
Proof
We presented participants with a pop song with asuperimposed auditory stimulus either aligned with the beat of the music or shifted away from the beat by 25%. This particular song was chosen because despite being highly rhythmic, it contains a relatively flat amplitude contour. Because the song was in 4/4 time, in the off-the-beat condition the auditory stimulus was presented at one of the weakest points in the structural hierarchy (Palmer & Krumhansl, 1990). As a result, given that the auditory stimulus was presented at a higher amplitude than the background music and strong points in the struc-tural hierarchy in ecologically valid music are normally associated with higher amplitude values, the presentation of the shifted stimulus should disrupt the participantsʼ ability to track the rhythmic structure of the piece. Because this paradigm presents the subsequent stimulus before the brain response to the previous stimulus has subsided to baseline, it results in a steady-state evoked potential (Galambos et al., 1981). Steady-state evoked potentials are periodic, and so they can be analyzed either in the time domain or the frequency domain (Stapells et al., 1984), although it has been suggested that frequency-based ana-lyses better capture the characteristics of the steady-state response (Plourde et al., 1991). For the time domain ana-lysis, we predicted, following Tierney et al. (2013), that there would be a positive enhancement in the P1 time region in the on-the-beat condition compared with the off-the-beat condition. For the frequency domain analysis, we predicted that neural tracking of the beat frequency and its harmonics (2.4 Hz, 4.8 Hz, etc.) would be dimin-ished in the condition in which stimuli were presented off of the beat.
METHODS
Participants
Participants were high school students recruited from Chicago charter schools as part of an ongoing longitudinal study. Ninety-eight participants were tested (48 female) with a mean age of 16.3 years (standard deviation = 0.719). As a whole, participants possessed only minimal amounts of musical training: Of 98 participants, only five reported more than 3 years of musical training. Informed assent and parent consent were obtained for all testing
procedures. Participants were compensated 10 dollars per hour for their time. All procedures were approved by the Northwestern Institutional Review Board. All participants were right-handed, had IQ scores within the normal range ( Wechsler Abbreviated Scale of Intelli-gence; Wechsler, 1999; two-scale IQ = 76), had normal hearing (air-conduction bilateral hearing thresholds ≤ 20 dB HL at octave frequencies from 125 to 8000 Hz), and reported no history of neurological impairment or learn-ing disabilities.
Stimuli
The musical stimulus consisted of the song “Pills,” by Bo Diddley. This song is 171 sec in length and contains male vocals and standard rock instrumentation (bass, guitar, and drums). The recording was hard-limited in amplitude by 15 dB to eliminate large amplitude spikes associated with beat onsets. (As shown in Figure 1, this process produced a largely flat amplitude contour across the song.) To determine the time of onset for each beat throughout the song, a professional drummer tapped on a NanoPad2 midi tapping pad (Korg) while listening to the song, while tap times were recorded and aligned with the recording using custom-written software in Python. These tap times were then taken as an estimate of the songʼs beat onset times. The mean interbeat interval was 416.7 msec or 2.4 Hz (standard deviation = 14.3 msec). To further insure that the drummer marked a steady beat throughout the song, each stimulus was divided into fifteen 10-sec epochs, beginning at the onset time of the first beat, and the median beat frequency of each epoch was calculated. These beat frequencies ranged from 2.36 to 2.44. Thus, given that the frequency resolution of our neural analysis was 0.1 Hz (see below), we take 2.4 Hz as the stimulus beat frequency in each epoch.
[image:3.612.176.554.627.741.2]The musical stimulus was presented to participants in two conditions, adapted from a tapping test developed by Iversen and Patel (2008). In an on-the-beat condition, a 200-msec synthesized bassoon stimulus was super-imposed onto the music such that its onset times co-incided with beat onset times. The bassoon stimulus was presented at a signal-to-noise ratio of +11 dB relative to the average amplitude of the music. In an off-the-beat
Figure 1. Stimulus waveform. Amplitude across time of the first 50 sec of the background music (before the target stimulus is added). Hard-limiting the data ensured that amplitude was largely flat throughout the song.
Uncorrected
Proof
condition, bassoon stimulus onset times were shifted laterwith respect to the on-the-beat condition by 104.18 msec (25% of the mean interbeat interval); essentially, the stim-uli were“out of phase”with the beat. Thus, both condi-tions consisted of identical musical stimuli and identical sequences of bassoon stimuli; the conditions only differed in how the two acoustic streams were aligned.
To ensure that background music amplitudes during stimulus presentation did not differ between the two conditions, the average amplitude of the music during the 200 msec following each beat onset was calculated.
tTests revealed that amplitudes of the background music during stimulus presentation did not significantly differ between the two conditions (on-the-beat mean = 7.62, off the beat mean = 7.70, allps > .1). Similarly, the average amplitude of the background music during the 20 msec fol-lowing stimulus onset in the on-the-beat condition (mean amplitude = 7.51) did not differ from the average ampli-tude during the 20 msec following stimulus onset in the off-the-beat condition (mean amplitude = 7.63,p> .1), confirming that musical beats were not marked by sudden increases in amplitude.
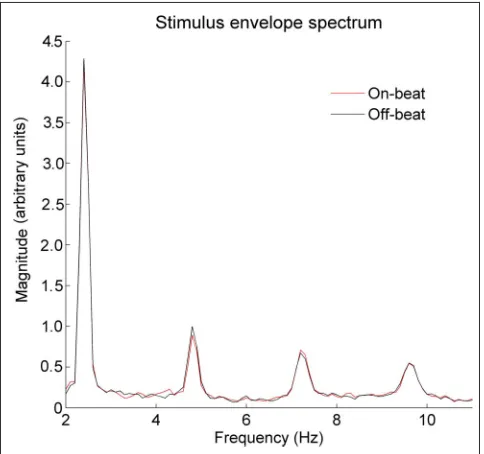
We predicted diminished neural tracking of the beat frequency and its harmonics in the off-the-beat condition relative to the on-the-beat condition. To ensure that any differences in the EEG spectrum are because of differ-ences in neural beat tracking rather than differdiffer-ences in the amplitude envelopes of the two stimuli, we divided the two sound files into 10-sec epochs, starting with the first presentation of the bassoon stimulus. Next, we iso-lated their amplitude envelopes using a Hilbert transform and examined their frequency spectra using a Hanning-windowed fast Fourier transform in MATLAB. This process revealed spectral components at the beat frequency (2.4 Hz) and its first three harmonics (4.8, 7.2, and 9.6 Hz). This procedure was done separately for each stimulus to ensure that any differences in the frequency content of neural responses between conditions were because of
[image:4.612.188.563.60.287.2]differ-ences in neural response rather than stimulus characteris-tics. (See Figure 2 for a representation of the average amplitude envelope of 10-sec epochs across the stimulus containing both the background music and the target stimulus. Figure 3 contains a display of the frequency content of the envelope for the background music target stimulus for both conditions.) Because a one-sample Kolmogorov–Smirnov test indicated that the data were not normally distributed, a Wilcoxon rank sum test was used to determine whether the frequency content at each of the four beat-related frequencies was identical in the two conditions. The two stimuli did not differ in spectral content at any of the four frequencies: 2.4 Hz, on-the-beat
Figure 2. Average stimulus envelope. Average envelope in 10-sec epochs across the entire stimulus in the on-the-beat (top) and off-the-beat (bottom) conditions.
[image:4.612.320.562.474.701.2]Uncorrected
Proof
median = 4.35, off-the-beat median = 4.39,p= .407, ranksum = 212; 4.8 Hz, on-the-beat median = 0.88, off-the-beat median = 1.10,p= .229, rank sum = 203; 7.2 Hz, on-the-beat median = 0.820, off-the-beat median = 0.72,
p= .534, rank sum = 248; 9.6 Hz, on-the-beat median = 0.55, off-the-beat median = 0.57,p= .967, rank sum = 231. Thus, we attribute any diminished EEG representation of beat-related frequencies in the off-the-beat condition to the breakdown of neural entrainment to the metrical structure of the piece and enhanced beat tracking in the on-the-beat condition to enhanced neural entrainment to metrical structure.
Electrophysiological Recording
Participants were seated in a comfortable chair in a sound-attenuated, electrically shielded room. To main-tain alertness, participants watched a movie of their choice during data collection, with the soundtrack pre-sented in soundfield at <40 dB SPL with subtitles provided. Participants were told that they would hear music, but that they did not have to attend and could, instead, concentrate on the movie. Participants were also instructed to keep their eyes open, stay awake, and minimize muscle move-ment. The music stimuli were presented binaurally at 80 dB over insert earphones (ER-3; Etymotic Research, Elk Grove Village, IL) via the stimulus presentation soft-ware Neuroscan Stim2 (Compumedics, Charlotte, NC).
Cortical EEG activity was collected using NeuroScan Acquire 4.3 (Compumedics) using a 31-channel tin-electrode cap (Electrocap International, Eaton, OH). Unlinked refer-ence electrodes were placed on the earlobes; the two ref-erences were then linked mathematically offline after data collection prior to data analysis. Electrodes placed on the superior and outer canthi of the left eye acted as eye-blink monitors. Contact impedance for all electrodes was kept below 5 kΩ. Data were collected at a sampling rate of 500 Hz.
Electrophysiological Data Processing
Removal of eye-blink artifacts was conducted using the NeuroScan Edit 4.3 spatial filtering algorithm. Continuous files were then filtered from 0.1 to 20 Hz to remove slow drift and isolate the lower-frequency components of the signal. Two different analyses of the data were conducted: a spectral analysis and a temporal analysis. First, for the spectral analysis, the response to the song in each condi-tion was then divided into fifteen 10-sec epochs, begin-ning with the first presentation of the bassoon stimulus. An artifact reject criterion of ±75 μV was applied. Next, a Hanning-windowed fast Fourier transform with a fre-quency resolution of 0.1 Hz was used to determine the frequency content of each epoch. The 15 resulting fast Fourier transforms for each condition were then averaged, producing an average frequency spectrum for each con-dition. To eliminate the contribution of noise and other
ongoing EEG activity and focus on frequency tracking of the stimulus, for each frequency we calculated the differ-ence between the amplitude at that frequency and the mean amplitude at four nearest neighboring frequencies (Nozaradan et al., 2011, 2012). (For example, for 2.4 Hz, the mean amplitude at 2.2, 2.3, 2.5, and 2.6 Hz would be subtracted from the amplitude at 2.4 Hz.) The assumption underlying the use of this procedure is that noise will be broadly distributed across frequencies, whereas frequency tracking will give rise to a narrow peak in the frequency spectrum. Finally, because we had no a priori hypothesis about the scalp distribution of beat tracking, spectra were averaged across all 31 channels.
Next, for the temporal analysis, the neural data were epoched from 50 msec before each bassoon stimulus presentation to 834 msec after, with a total of 387 epochs in each condition. This epoch spans two full beat cycles and, therefore, two stimulus presentations. An artifact reject criterion of ±75μV was applied. Next, these epochs were averaged, resulting in an average evoked waveform for each participant.
Data Analysis: Spectral
Visual inspection of the grand average spectra for the two conditions revealed frequency tracking only at the beat frequency (2.4 Hz) and the first harmonic (4.8 Hz). Data analysis was, therefore, limited to these two frequencies. A 2 × 2 ANOVA with frequency (2.4 vs. 4.8 Hz) and beat alignment (on-beat vs. off-beat) as within-subject factors revealed an interaction between frequency and beat alignment,F(1, 388) = 9.38,p= .0023, suggesting that alignment with the beat of the music affected the rep-resentation of the fundamental frequency and the first harmonic differently. Subsequent analysis, therefore, was conducted on each frequency separately. For the frequencies 2.4 and 4.8 Hz, a two-tailedt test was used to determine whether beat tracking in each condition was significantly greater than zero. Because this test was used on two conditions at two frequencies, we used a Bonferroni-corrected criticalpvalue of .0125. Next, for each frequency we used a two-tailed paired t test to determine whether beat tracking significantly differed between the two conditions, with a Bonferroni-corrected criticalpvalue of .025.
Data Analysis: Temporal
Visual inspection of the grand average waveforms for the two conditions revealed differences in four time regions: 0–215 msec, 260–370 msec, 418–633 msec, and 678– 788 msec. Data analysis was, therefore, limited to these four time regions. Pairedttests were conducted on each time region comparing amplitude in the on-the-beat con-dition to amplitude in the off-the-beat concon-dition. Because we had no a priori reason to select these two time regions,
Uncorrected
Proof
the criticalpvalue was set to the conservative thresholdof .001.
RESULTS
The spectra of the neural response in the on-the-beat and off-the-beat conditions are displayed in Figure 4. Neural tracking of the beat frequency (2.4 Hz) was significantly present in both the on-the-beat (mean magnitude = 0.0446, standard deviation = 0.0699;p< .001,t(97) = 6.32)
and off-the-beat (mean = 0.0581, standard deviation = 0.0783; p< .001,t(97) = 7.35) conditions. Beat tracking was not significantly different between the two conditions (p > .1, t(97) = −1.56). Participantsʼ brain responses, therefore, represented the beat frequency to an equal de-gree, regardless of whether the bassoon stimulus matched up with the beat.
Neural tracking of the first harmonic of the beat fre-quency (4.8 Hz) was present in the on-the-beat condition (mean = 0.0229, standard deviation = 0.0353;p< .001,
t(97) = 6.42), but was absent in the off-the-beat condition (mean = 7.90 × 10⁻⁴, standard deviation = 0.0317;p> .8,
t(97) = 0.246). Moreover, tracking of the first beat har-monic was greater in the on-the-beat condition, compared with the off-the-beat condition (p< .001,t(97) = 4.41). Participants, therefore, did not neurally track the higher-frequency components of the metrical structure of music when the musical beat and bassoon stimulus presented contradictory rhythmic information. Figure 5 illustrates neural tracking of the first harmonic of the beat frequency across the scalp in the two conditions, revealing robust tracking across electrodes in the on-the-beat condition and no identifiable tracking in the off-the-beat condition.
[image:6.612.63.303.63.248.2]The average waveforms evoked by the presentation of the bassoon stimulus in the on-the-beat and off-the-beat conditions are displayed in Figure 6. During the first half of the epoch, a positive enhancement from 0 to 215 msec is present in the on-the-beat condition, compared with the off-the-beat condition (on-the-beat mean amplitude = 0.640μV, off-the-beat mean amplitude = 0.352μV, tstat = 6.37,df= 97,p< .001). A second, later positive peak is also present in the on-the-beat condition but not in the off-the-beat condition (on-off-the-beat mean amplitude = 0.091μV,
Figure 4. Oscillatory activity modulated by phase relationship between stimuli and musical beat. In both the on-the-beat and off-the-beat conditions, neural activity tracked the beat frequency (2.4 Hz). However, the first harmonic of the beat frequency (4.8 Hz) was tracked only in the on-the-beat condition. The shaded line indicates theSEM.
[image:6.612.63.561.470.710.2]Uncorrected
Proof
off-the-beat mean amplitude =−0.431μV, tstat = 10.69,df= 97,p< .001). During the second half of the epoch, which begins with the second presentation of the target stimulus at approximately 418 msec, a positive enhance-ment from 418 to 633 msec is present in the on-the-beat condition, compared with the off-the-beat condition (on-the-beat mean amplitude = 0.670 μV, off-the-beat mean amplitude = 0.354μV, tstat = 4.72, df = 97, p< .001). A second, later positive peak is also present in the on-the-beat condition but not in the off-the-on-the-beat condition (on-the-beat mean amplitude = 0.111 μV, off-the-beat mean amplitude =−0.403μV, tstat = 8.19,df= 97,p< .001).
DISCUSSION
We presented participants with a pop song and an over-laid auditory stimulus in two conditions: one in which the stimulus was aligned with the beat and another in which it was shifted away from the beat. When the stimulus is shifted away from the beat, it is out of phase with the metrical structure of the music, such that there are two conflicting sources of information about which time regions contain strong and weak beats. Our prediction, therefore, was that the neural entrainment to the beat and its har-monics would be diminished in the off-the-beat condition. This prediction was only partially borne out. Neural entrain-ment to the beat frequency was present to the same degree in both conditions. Neural entrainment to the first har-monic of the beat frequency, however, was present when the stimuli were aligned with the beat but completely absent when the stimuli were misaligned with the beat. Because the stimuli in the two conditions do not differ in amplitude at this frequency, this difference can be attri-buted to a breakdown in metrical tracking. This, therefore, is the first direct evidence that the metrical structure of real, ecologically valid music is tracked via neural entrainment to
the beat on multiple timescales. As such, it provides strong evidence in support of theories explaining metrical percep-tion as resulting from entrainment of neural oscillapercep-tions (Velasco & Large, 2011; Large, 2000, 2008; Barnes & Jones, 2000; Large & Jones, 1999; Van Noorden & Moelants, 1999; Large & Kolen, 1994).
These results also suggest that the tracking of metrical structure on multiple timescales operates somewhat inde-pendently, such that the perception of a faster scale (the subdivision of the beat) can be disrupted whereas percep-tion of a slower scale (the beat itself ) remains unaffected. Tracking of beat (the slow pulse forming the most basic rhythmic element of music) and meter (the alternation of stronger and weaker beats that takes place on a faster timescale) may, therefore, be somewhat separable pro-cesses. This idea is also supported by a dissociation between beat and meter processing found in the neuro-psychological literature on rhythm: Wilson, Pressing, and Wales (2002) report that a patient with a right temporo-parietal infarct was impaired in synchronizing movements to a beat but could correctly classify metrical and non-metrical rhythms. As this patient showed preserved motor function, this deficit was likely indicative of an inability to perceptually track the beat of music. To our knowledge no researcher has yet reported a case of a patient with impaired metrical perception and intact beat perception/ synchronization. However, there have been several cases in which patients have shown impaired metrical percep-tion and preserved discriminapercep-tion of rhythmic patterns but have not been tested on beat perception or synchro-nization tasks (Liégeois-Chauvel, Peretz, Babaï, Laguitton, & Chauvel, 1998; Peretz, 1990). Future studies on such patients, therefore, could include a test of beat perception to determine whether there is truly a double dissociation between beat perception and the tracking of metrical structure.
[image:7.612.52.293.63.209.2]Our results can be viewed in one of two ways. First, when considered as a response evoked by the bassoon stimulus in the time domain, the effect of the stimulus being aligned with the beat of the music can be seen as an enhancement of the P1 response and the presence of a later positive peak centered around 300 msec that is completely absent in the off-the-beat condition. Second, the difference between conditions can be seen as a peri-odic component at 4.8 Hz present in the on-the-beat condi-tion but not the off-the-beat condicondi-tion. We favor the latter interpretation for several reasons. First, the frequency-based interpretation is more parsimonious: the difference between conditions can be accounted for by a change in a single parameter (frequency content at 4.8 Hz) rather than two changes (P1 enhancement and the presence of the second later positive peak). Second, the frequency-based interpretation accounts for the fact that the time between the onset of the P1 peak and the onset of the second posi-tive peak is very close to halfway between a single beat cycle, a fact that the time domain analysis can only explain as a coincidence. And finally, a frequency-based interpretation
Figure 6. Average evoked waveforms. There is a positive enhancement centered around 90 msec in the on-the-beat condition, relative to the off-the-beat condition. Moreover, there is a second positive-going wave in the on-the-beat condition centered around 300 msec that is absent in the off-the-beat condition. These same two effects are repeated in the second half of the evoked response at roughly 510 and 700 msec.
Uncorrected
Proof
directly ties the difference in neural response betweenconditions to the metrical structure of the background music. In any case, these two interpretations may not be mutually exclusive. The 40-Hz steady-state response, for example, may be a composite of the several waves, making up the middle-latency response (Conti et al., 1999; Franowicz et al., 1995; Pantev et al., 1993; Plourde et al., 1991; Galambos et al., 1981). Similarly, it has been suggested that steady-state waves in the theta range could be produced by the same neural generators that underlie the P1 (Draganova et al., 2002).
It is possible that sudden changes in stimulus param-eters other than amplitude could be contributing to our results. For example, sudden changes in pitch aligned with beat onset could give rise to obligatory response components. Future work could account for this possibility by using carefully constructed electronic music, but with our current data set we cannot completely rule out the influ-ence of obligatory responses to sudden acoustic events.
Nevertheless, the evoked responses to the target stim-ulus elicited in the on-the-beat and off-the-beat condi-tions do not display the pattern of results that would be expected if obligatory responses to events in the back-ground music were having a major effect. The largest difference between the evoked responses in the two con-ditions is at 300 msec, at which time there is a positive peak in the response to the on-the-beat condition but a negative peak in the response to the off-the-beat condi-tion. The positive peak in the on-the-beat condition could be the result of a response to the background music if there were a prominent acoustic event at the halfway point between beats. (The halfway point would be 208 msec after beat onset, and the latency of P1 in this data set is approximately 90 msec). This is plausible, as the song is in 4/4 time, and as a result, the halfway point has a greater degree of prominence than surrounding points. However, given that in the off-the-beat condition the stimulus is presented approximately 100 msec later, if this prominent acoustic event existed, it should lead to an obligatory P1 response in the off-the-beat condition peaking at around 200 msec. However, at 200 msec responses to the two conditions are matched—and the trend that exists is for the response in the off-the-beat condition to be more negative than the response in the on-the-beat condition. We conclude, therefore, that the difference between conditions can be attributed largely to a difference in neural entrainment to the first harmonic of the beat of the background music.
Because the stimulus in the off-the-beat condition was delayed by 25% of the beat, it was aligned with a par-ticularly weak portion of the metrical grid (Palmer & Krumhansl, 1990). The on-the-beat and off-the-beat con-ditions, therefore, are analogous to the strongly metrical and weakly metrical sequences (Povel & Essens, 1985) that have been used to study the effects of metrical strength on behavioral performance. Metrical strength has been linked to improved duration discrimination
per-formance (Grahn, 2012; Grube & Griffiths, 2009), less variable beat synchronization (Patel, Iversen, & Chen, 2005), and more accurate rhythm reproduction (Fitch & Rosenfeld, 2007). Our results suggest an explanation for why metrically strong sequences are easier to dis-criminate and remember: metrically strong sequences enable metrical tracking on multiple timescales simul-taneously, whereas metrically weak sequences disrupt beat subdivision. Entrainment of low-frequency neural oscillations can facilitate auditory perception at oscilla-tory peaks (Ng, Schroeder, & Kayser, 2012; Lakatos, Karmos, Mehta, Ulbert, & Schroeder, 2008). Entrainment of multiple neural oscillators at several timescales could facilitate auditory perception at a greater number of time points throughout the sequence than entrainment of a single neural oscillator. Our results, therefore, support theories (Keller, 2001) that propose that metrical organi-zation acts as a framework to guide music listening.
Beat perception has been explained in terms of atten-tion oscillating on multiple timescales (Barnes & Jones, 2000; Large & Jones, 1999). An attentional framework could help explain the perceptual advantages experienced when stimuli are presented aligned with an expected beat versus shifted away: Attention has been directed to that point in time, facilitating perception. This possibility is supported by the finding that a beat percept induced by an auditory beat can have cross-modal effects on percep-tual skill, for example, enhancing visual word recognition (Brochard, Tassin, & Zagar, 2013). Studies of perceptual streaming have found that, when participants attend to an auditory stream occurring at a certain rate, embedded in distractors not occurring at that rate, the neural response at the target rate is enhanced (Elhilali et al., 2009), demon-strating that attention can induce an effect similar to that found in the current study. It is currently unknown whether such an enhancement of target rate primarily reflects attentional enhancement of evoked components, which has been shown to take place during auditory streaming tasks (Snyder et al., 2006) or is best described as a speci-fically oscillatory mechanism (and, as we argue above, such a distinction may be a false dichotomy). Unfortunately, the role of attention in driving the current results is unclear, as participants were simply asked to watch a subtitled movie during stimulus presentation. As a result, it is difficult to determine whether or not participants were attending to the stimuli. Future work could pinpoint the role of attention in driving this rhythm tracking by presenting the on-the-beat and off-the-beat stimuli while participants either actively attend to the stimuli or perform a simul-taneous unrelated task. If attention is a necessary compo-nent of rhythm tracking, the first harmonic beat tracking in the on-the-beat condition may be absent when partici-pants are required to direct their attention away from the stimuli.
Uncorrected
Proof
participants with a high degree of musical expertise,therefore, remains a promising avenue for future research using this paradigm. One possibility is that improved stream segregation in expert musicians (Zendel & Alain, 2009) may enable tracking of the musical rhythm and the out-of-phase stimulus simultaneously, leading to enhanced tracking of beat harmonics on the off-the-beat condition and a smaller difference in metrical tracking between the two conditions. Another open question is whether the ability to track rhythmic structure despite conflicting information relates to language skills. Dura-tional cues can be a useful cue for word segregation (Mattys, 2004; Cutler & Butterfield, 1992; Smith, Cutler, Butterfield, & Nimmo-Smith, 1989; Nakatani & Schaffer, 1977), espe-cially when speech is presented in noise (Spitzer, Liss, & Mattys, 2007). Thus, the ability to ignore distractor stimuli (background talkers) when tracking rhythm from a par-ticular sound source (a target talker) may be useful for both music and speech processing.
Acknowledgments
The research was supported by NSF Grant 1015614, the Mathers Foundation, and the Knowles Hearing Center of Northwestern University.
Reprint requests should be sent to Nina Kraus, Auditory Neuro-science Laboratory, Northwestern University, 2240 Campus Drive, Evanston, IL 60208, or via e-mail: nkraus@northwestern.edu.
REFERENCES
Abecasis, D., Brochard, R., del Río, D., Dufour, A., & Ortiz, T. (2009). Brain lateralization of metrical accenting in musicians.Annals of the New York Academy of Sciences, 1169,74–78.
Abecasis, D., Brochard, R., Granot, R., & Drake, C. (2005). Differential brain response to metrical accents in isochronous auditory sequences.Music Perception, 22,549–562. Barnes, R., & Jones, M. (2000). Expectancy, attention, and time.
Cognitive Psychology, 41,254–311.
Bolger, D., Trost, W., & Schön, D. (2013). Rhythm implicitly affects temporal orienting of attention across modalities.
Acta Psychologica, 142,238–244.
Brochard, R., Abecasis, D., Potter, D., Ragot, R., & Drake, C. (2003). The“ticktock”or our internal clock: Direct brain evidence of subjective accents in isochronous sequences.
Psychological Science, 14,362–366.
Brochard, R., Tassin, M., & Zagar, D. (2013). Got rhythm… for better and for worse. Cross-modal effects of auditory rhythm on visual word recognition.Cognition, 127,
214–219.
Cutler, A., & Butterfield, S. (1992). Rhythmic cues to speech segmentation: Evidence from juncture misperception.
Journal of Memory and Language, 31,218–236.
Drake, C., Jones, M., & Baruch, C. (2000). The development of rhythmic attending in auditory sequences: Attunement, referent period, focal attending.Cognition, 77,251–288. Escoffier, N., Sheng, D., & Schirmer, A. (2010). Unattended
musical beats enhance visual processing.Acta Psychologica, 135,12–16.
Fitch, W., & Rosenfeld, A. (2007). Perception and production of syncopated rhythms.Music Perception, 25,43–58.
Fujioka, T., Zendel, B., & Ross, B. (2010). Endogenous neuromagnetic activity for mental hierarchy of timing.
Journal of Neuroscience, 30,3458–3466.
Geiser, E., Sandmann, P., Jäncke, L., & Meyer, M. (2010). Refinement of metre perception-training increases hierarchical metre processing.European Journal of Neuroscience, 32,1979–1985.
Grahn, J. (2012). See what I hear? Beat perception in auditory and visual rhythms.Experimental Brain Research, 220,
51–61.
Grube, M., & Griffiths, T. (2009). Metricality-enhanced temporal encoding and the subjective perception of rhythmic sequences.Cortex, 45,72–79.
Iversen, J., & Patel, A. (2008). The Beat Alignment Test (BAT): Surveying beat processing abilities in the general population. In K. Miyazaki (Ed.),Proceedings of the 10th International Conference on Music Perception & Cognition(pp. 465–468). Adelaide: Causal Productions.
Iversen, J., Repp, B., & Patel, A. (2009). Top–down control of rhythm perception modulates early auditory responses.
Annals of the New York Academy of Science, 1169,58–73. Jones, M., Moynihan, H., MacKenzie, N., & Puente, J. (2002).
Temporal aspects of stimulus-driven attending in dynamic arrays.Psychological Science, 13,313–319.
Keller, P. (2001). Attentional resource allocation in musical ensemble performance.Psychology of Music, 29,20–38. Ladinig, O., Honing, H., Háden, G., & Winkler, I. (2009).
Probing attentive and preattentive emergent meter in adult listeners without extensive music training.Music Perception, 26,377–386.
Large, E. (2000). On synchronizing movements to music.
Human Movement Science, 19,527–566.
Large, E. (2008). Resonating to musical rhythm: Theory and experiment. In S. Grondin (Ed.),The psychology of time
(pp. 189–232). West Yorkshire, UK: Emerald.
Large, E., & Jones, M. (1999). The dynamics of attending: How people track time-varying events.Psychological Review, 106,119–159.
Large, E., & Kolen, J. (1994). Resonance and the perception of musical meter.Connection Science, 6,177–208. Liégeois-Chauvel, C., Peretz, I., Babaï, M., Laguitton, V., &
Chauvel, P. (1998). Contribution of different cortical areas in the temporal lobes to music processing.Brain, 121,1853–1867. Mattys, S. (2004). Stress versus coarticulation: Toward an
integrated approach to explicit speech segmentation.
Journal of Experimental Psychology: Human Perception and Performance, 30,397–408.
McAuley, J., & Jones, M. (2003). Modeling effects of rhythmic context on perceived duration: A comparison of interval and entrainment approaches to short-interval timing.
Journal of Experimental Psychology: Human Perception and Performance, 29,1102–1125.
Miller, J., Carlson, L., & McAuley, J. (2013). When what you hear influences when you see: Listening to an auditory rhythm influences the temporal allocation of visual attention.
Psychological Science, 24,11–18.
Nakatani, L., & Schaffer, J. (1977). Hearing“words”without words: Prosodic cues for word perception.The Journal of the Acoustical Society of America, 63,234–245.
Ng, B., Schroeder, T., & Kayser, C. (2012). A precluding but not ensuring role of entrained low-frequency oscillations for auditory perception.Journal of Neuroscience, 32,12268–12276. Nozaradan, S., Peretz, I., Missal, M., & Mouraux, A. (2011).
Tagging the neuronal entrainment to beat and meter.The Journal of Neuroscience, 31,10234–10240.
Nozaradan, S., Peretz, I., & Mouraux, A. (2012). Selective neuronal entrainment to the beat and meter embedded in a musical rhythm.Journal of Neuroscience, 32,17572–17581.
Uncorrected
Proof
Pablos Martin, X., Deltenre, P., Hoonhorst, I., Markessis, E.,Rossion, B., & Colin, C. (2007). Perceptual biases for rhythm: The mismatch negativity latency indexes the privileged status of binary vs non-binary interval ratios.Clinical Neurophysiology, 118,2709–2715.
Palmer, C., & Krumhansl, C. (1990). Mental representations for musical meter.Journal of Experimental Psychology: Human Perception and Performance, 16,728–741.
Patel, A., Iversen, J., & Chen, Y. (2005). The influence of metricality and modality on synchronization with a beat.
Experimental Brain Research, 163,226–238. Peretz, I. (1990). Processing of local and global musical
information by unilateral brain-damaged patients.Brain, 113,1185–1205.
Potter, D., Fenwick, M., Abecasis, D., & Brochard, R. (2009). Perceiving rhythm where none exists: Event-related potential (ERP) correlates of subjective accenting.Cortex, 45,103–109. Povel, D., & Essens, P. (1985). Perception of temporal patterns.
Music Perception, 2,411–440.
Schaefer, R., Vlek, R., & Desain, P. (2011). Decomposing rhythm processing: Electroencephalography of perceived and self-imposed rhythmic patterns.Psychological Research, 75,95–106.
Smith, M., Cutler, A., Butterfield, S., & Nimmo-Smith, I. (1989). The perception of rhythm and word boundaries in noise-masked speech.Journal of Speech and Hearing Research, 32,912–920.
Snyder, J., & Large, E. (2005). Gamma-band activity reflects the metric structure of rhythmic tone sequences.Cognitive Brain Research, 24,117–126.
Spitzer, S., Liss, J., & Mattys, S. (2007). Acoustic cues to lexical segmentation: A study of resynthesized speech.The Journal of the Acoustical Society of America, 122,3678–3687. Tierney, A., & Kraus, N. (2013). Neural responses to
sounds presented on and off the beat of ecologically valid music.Frontiers in Systems Neuroscience, 7. doi:10.3389/ fnsys.2013.00014.
Van Noorden, L., & Moelants, D. (1999). Resonance in the perception of musical pulse.Journal of New Music Research, 28,43–66.
Velasco, M., & Large, E. (2011).Pulse detection in syncopated rhythms using neural oscillators. Paper presented at the 12th International Society for Music Information Retrieval Conference (October, Miami).
Vlek, R., Gielen, C., Farquhar, J., & Desain, P. (2011).
Sequenced subjective accents for brain-computer interfaces.
Journal of Neural Engineering, 8. doi:10.1088/1741-2560/8/ 3/036002.
Wechsler, D. (1999).Wechsler Abbreviated Scale of Intelligence ( WASI). San Antonio, TX: The Psychological Corporation. Wilson, S., Pressing, J., & Wales, R. (2002). Modelling rhythmic
function in a musician post-stroke.Neuropsychologia, 40,
1494–1505.
Winkler, I., Haden, G., Ladinig, O., Sziller, I., & Honing, H. (2009). Newborn infants detect the beat in music.
Proceedings of the National Academy of Sciences, 106,
2468–2471.