IJPSR (2019), Volume 10, Issue 6 (Research Article)
Received on 01 October 2018; received in revised form, 14 April 2019; accepted, 28 April 2019; published 01 June 2019
ASSESSMENT OF QUALITY OF LIFE IN DIALYSIS AND NON-DIALYSIS CHRONIC KIDNEY DISEASE PATIENTS
N. Venkateswaramurthy *, M. Saiful Islam, R. C. Habeeba and R. Sambathkumar
Department of Pharmacy Practice, J. K. K. Nattraja College of Pharmacy, Kumarapalayam - 638183, Tamil Nadu, India.
ABSTRACT: Quality of life is an essential measure that proves the effectiveness of health care, health level, and well-being. Kidney diseases are one of the major health problems that affect Quality of life. This study aimed to assess the quality of life in dialysis (CRF-D) and non-dialysis (CRF-ND) chronic renal failure (CRF) patients using Kidney Disease Quality of Life-short form (KDQOL-SFTM) and identify the differences in disease symptoms between these two groups. 200 CRF patients were included in the study. Our findings showed that some symptom burden was higher in the non-dialysis group compared to the dialysis group, but most of the symptoms did not reach statistical significance. Similarly, our results indicate no differences in quality of life and symptoms between CRF patients with dialysis and without dialysis.
INTRODUCTION: Chronic renal failure is one of the slow, gradual, and irrevocable loss of renal function, contributing to the failure of kidneys to accomplish their basic functions. The incidence and prevalence in patients with chronic kidney disease (CKD) are growing worldwide. The problem is associated with high morbidity and mortality throughout the procession from the early stage of the disease. Although very much progress has been made in prevention, detection, and treatment, CKD remains a major public health issue. Its global prevalence is generally estimated at 5-10%. CKD prevalence is contentious. Statistics from the American National Health and Nutrition Examination Survey show that in the period of
QUICK RESPONSE CODE
DOI:
10.13040/IJPSR.0975-8232.10(6).2970-74
The article can be accessed online on
www.ijpsr.com
DOI link: http://dx.doi.org/10.13040/IJPSR.0975-8232.10(6).2970-74
1999 to 2004, the prevalence of CKD stages 1 to 4 increased significantly when compared to their previous report (13·1 versus 10·0%). Prevalence is increased mainly due to the aging population; it is also connected with increases in prevalence of hypertension and diabetes mellitus 1-3. Because of cardiovascular morbidity and mortality, the global burden of CKD-associated diseases is alarmingly large.
The World Health Organization (WHO) has defined Quality of life (QOL) as "an individual's perception of their position in life in the context of the culture and value systems in which they live and about their goals, expectations, standards, and concerns” 4
. QOL is an important outcome, utilized as a valuable parameter to measure health and well-being. Research conclusions have shown that lower results on QOL were firmly associated with a higher risk of fatality and hospitalization than clinical parameters such as serum protein levels in cases of CKD sufferers. Numerous studies have shown that individual with CKD had reduced QOL
Keywords:
Quality of life, Chronic renal failure, Dialysis Correspondence to Author: N. Venkateswaramurthy
Professor,
Department of Pharmacy Practice, J. K. K. Nattraja College of Pharmacy, Kumarapalayam - 638183, Tamil Nadu, India.
compared to healthy people. Therefore, improving CKD patients’ life span as well as QOL features utmost significance. Health-related QOL contains physical, psychological, and social domains of health, every of which includes diversity in components. Moreover, each element can be expressed in different approaches according to the individual perception of every patient, resulting in a different evaluation of QOL. Two patients with the same clinical conditions may assess QOL differently because the perception is the result of the communication between the patient’s living conditions and how these are perceived by the patient. This study aimed to assess the quality of life in dialysis D) and non-dialysis (CRF-ND) chronic renal failure (CRF) patients. Kidney Disease Quality of Life-short form (KDQOL-SFTM) version 1.3 was used in this to study the QOL of two group patients. KDQOL-SFTM is a multidimensional, reliable, and validated questionnaire proposed for dialysis patients 5. It has 43 domains. In KDQOL-SFTM two questions connecting to dialysis staff encouragement and patient satisfaction that are usually part of the disease-specific component of the KDQOL-SFTM were excluded as they were not relevant to the population under assessment as reported earlier 6. The question associated with the sexual function was also excluded.
METHODOLOGY:
Study Design: Observational and prospective study.
Study population covered of 200 patients with CRF collected from nephrology department of a tertiary care hospital, Erode. CRF patients undergoing dialysis and not on dialysis aged 18 years and above of either sex and be able to provide informed consent to participate were included in the study. Renal transplant patients were excluded. The entire work was carried out according to the approval granted by the Institutional Human ethics committee (IEC approval number (JKKNCP/IEC/ 54892J17). Written consent was attained from participants before the study. Demographic data recorded were age, gender, educational status, financial status, and co-morbidities were collected. The patients were divided into two groups, CRF on dialysis (CRF-D, n = 74) and CRF not on dialysis (CRF-ND, n = 126). The KDQOL-SFTM existed in
the English version. Even though KDQOL-SF™ is a self-reported questionnaire, seeing the high proportion of illiterate participants, in this study, questionnaires were administered by an interview to all the study participants. The interviewer only explained the meaning of questions for illiterate patients. The scoring algorithm was used to compute scores ranging from 0 to100. The scores signify the percentage of the total possible score achieved, with 100 representing the highest quality of life.
(17.5%) and less than 40 years (12.1%). CRF-ND patients were more in the age group of more than 60 years (37.3%) followed by 51-60 years (24.6%), 41-50 years (21.4%) and less than 40 years (16.6%). In both groups, most of the participants were over 60 years. In general, older people have more risk factor for the development of CKD. After the age of 40 years, glomerular filtration reduced approximately 1% per year 11. This age-related decline in renal function reduces the kidney function in the elder population.
TABLE 1: DEMOGRAPHIC CHARACTERISTICS OF STUDY POPULATION
Gender CRF-ND
(n=126)
CRF-D (n=74) Male 71(56.3%) 44(59.4%) Female 55(43.6%) 30(40.5%)
Age (in years)
<40 21(16.6%) 09(12.1%) 41-50 27(21.4%) 13(17.5%) 51-60 31(24.6%) 19(25.6%) >60 47(37.3%) 33(44.5%)
Co-morbidities
Hypertension 107(84.9%) 69(93.2%) Ischemic Heart Disease 63(50.0%) 47(63.5%) Diabetes Mellitus 93(73.8%) 59(79.7%) Anaemia 98(77.7%) 63(85.1%) Others 47(37.3%) 27(36.4%)
Educational status
Illiterate 53(42.0%) 31(41.8%) School 45(35.7%) 25(33.7%) Degree 28(22.2%) 18(24.3%)
Monthly per capita income (INR)
<5000 48(38.0%) 28(37.8%) 5000 – 15000 64(50.7%) 37(50.0%) >15000 14(11.1%) 09(12.1%)
Marital Status
Married 95(75.3%) 56(75.6%) Divorced 22(17.4%) 11(14.8%) Single 9(7.1%) 7(9.4%)
TABLE 2: LABORATORY DATA OF STUDY POPULATION Laboratory
Data
CRF- ND (Mean ± SD)
CRF- D (Mean ± SD)
P Value Hb(g/dl)* 11.7±1.2 11.2 ± 1.8 0.01
Serum Urea(mg/dl)*
82.4 ± 32.9 127 ± 30.3 0.03
Serum calcium (mg/dl)*
9.1 ± 0.5 9.0 ± 1.0 0.01
Serum albumin (mg/dl)*
3.8 ± 0.5 3.6 ± 0.6 0.04
Serum Phosphorous
(mg/dl)*
4.1 ± 0.7 4.9 ± 0.8 0.01
*P<0.05. CKD ND: CKD –D
Hypertension, Ischemic Heart Disease, Diabetes Mellitus, and Anemia are the co-morbid diseases commonly found with CKD patients. In this study,
most of the CRF-D patients have hypertension (93.2%), followed by anemia (85.1%), Diabetes mellitus (79.7%), Ischemic Heart Disease (63.5%) and other diseases (36.4%). Most of the CRF-ND patients have hypertension (84.9%), followed by anemia (77.7%), Diabetes Mellitus (73.8%), Ischemic Heart Disease (50.0%) and other diseases (37.3%). Diabetes, hypertension, and CRF are significantly interlinked. About one-third of diabetic patients develop diabetic kidney disease. The prevalence of CRF was 10.6% and 12% in the hypertensive and diabetic patients, respectively. There is a strong link between hypertension CKD. Hypertension alters the systemic and renal micro and macro vasculature; it leads to the damage of renal auto-regulation with raise of intraglomerular capillary pressure and the resulting hyperfiltration mediated renal injury. And also hypertension activates the intrarenal renin-angiotensin system, which increases the release of cytokines and stimulates apoptosis and induces interstitial fibrosis in kidney 12. Diabetes is the one primary risk factor of kidney disease. Approximately 40% of adults with diabetes have renal disease. Diabetes changes the thickness of the glomerular basement membrane, which leads to renal damage.
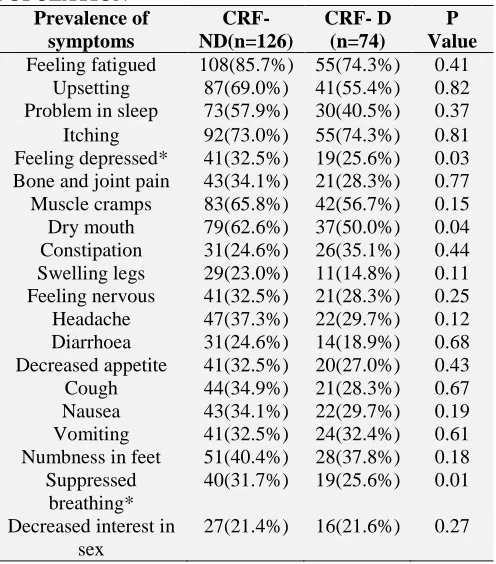
TABLE 3: PREVALENCE OF SYMPTOMS IN STUDY POPULATION
Prevalence of symptoms
CRF- ND(n=126)
CRF- D (n=74)
P Value Feeling fatigued 108(85.7%) 55(74.3%) 0.41
Upsetting 87(69.0%) 41(55.4%) 0.82 Problem in sleep 73(57.9%) 30(40.5%) 0.37 Itching 92(73.0%) 55(74.3%) 0.81 Feeling depressed* 41(32.5%) 19(25.6%) 0.03 Bone and joint pain 43(34.1%) 21(28.3%) 0.77 Muscle cramps 83(65.8%) 42(56.7%) 0.15 Dry mouth 79(62.6%) 37(50.0%) 0.04 Constipation 31(24.6%) 26(35.1%) 0.44 Swelling legs 29(23.0%) 11(14.8%) 0.11 Feeling nervous 41(32.5%) 21(28.3%) 0.25 Headache 47(37.3%) 22(29.7%) 0.12 Diarrhoea 31(24.6%) 14(18.9%) 0.68 Decreased appetite 41(32.5%) 20(27.0%) 0.43 Cough 44(34.9%) 21(28.3%) 0.67 Nausea 43(34.1%) 22(29.7%) 0.19 Vomiting 41(32.5%) 24(32.4%) 0.61 Numbness in feet 51(40.4%) 28(37.8%) 0.18
Suppressed breathing*
40(31.7%) 19(25.6%) 0.01
Decreased interest in sex
27(21.4%) 16(21.6%) 0.27
[image:3.612.48.299.238.558.2] [image:3.612.317.565.452.734.2]In severe diabetes, it causes interstitial, and glomerulopathy coalesces, which finally causes segmental and global sclerosis 13. In our study majority of patients were affected by Anemia. It may be vitamin deficiencies such as B12 and folate are relatively and erythropoietin deficiency 14, 15. In our study, 41.8% D) and 42.0% (CRF-ND) patients were Illiterates. 35.7% (CRF-(CRF-ND) and 33.7% (CRF-D) of patients had education up to school level. About 75% of the D and ND patients are married. D (9.4%) and CRF-ND (7.1%) patients are single in the study population. Only 20% of the study population completed degree. The Individual monthly incomes of 50% of the CRF-D and CRF-ND patients were between 5000 and 15000 rupees per month. Only CRF-D (12.1%) and CRF-ND (11.1%) have a monthly wage of 15000 rupees. Prevalence of symptoms was studied in the study population. Feeling fatigued and lack of energy, worrying, Itching, feeling depressed, bone and joint pain, muscle cramps, dry mouth, constipation, swelling legs, feeling nervous, headache, diarrhea, decreased
appetite, nausea, vomiting, numbness in feet, suppressed breathing, decreased interest in sex are the prevalence of symptoms connected with the study population.
The most prevailing symptoms in the dialysis patients were feeling fatigued and lack of energy (74.3%), itching (74.3%), worrying (55.4%), and muscle cramps (56.7%). Non-dialysis patients generally felt like feeling tired and lack of energy (85.7%), worry (69.0%), itching (73.0%), and muscle cramps (65.8%). Feeling fatigued and lack of energy was the most prevalent symptom across all groups.
[image:4.612.57.373.390.703.2]In this study, nausea and decreased appetite were reported frequently. This study shows that certain symptoms were higher in the non-dialysis patients, compared to the dialysis group, but most of the symptoms are not statistically significant. Feeling depressed (p<0.03) and suppressed breathing (p<0.01) have significant difference in the CRF-D and CRF-ND patients. Similar results were obtained by Abdel-Kader et al.16
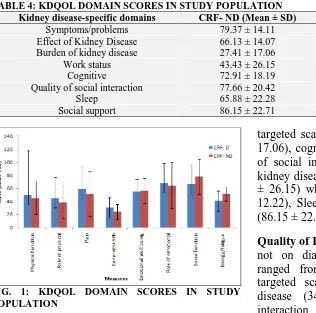
TABLE 4: KDQOL DOMAIN SCORES IN STUDY POPULATION
Kidney disease-specific domains CRF- ND (Mean ± SD) CRF- D (Mean ± SD) P Value
Symptoms/problems 79.37 ± 14.11 77.35 ± 12.25 0.60
Effect of Kidney Disease 66.13 ± 14.07 74.66 ± 13.44 0.11 Burden of kidney disease 27.41 ± 17.06 34.15 ± 21.07 0.55
Work status 43.43 ± 26.15 40.39 ± 32.62 0.12
Cognitive 72.91 ± 18.19 62.52 ± 20.17 0.23
Quality of social interaction 77.66 ± 20.42 75.91 ± 19.72 0.22
Sleep 65.88 ± 22.28 65.22 ± 18.37 0.29
Social support 86.15 ± 22.71 78.21 ± 23.86 0.16
FIG. 1: KDQOL DOMAIN SCORES IN STUDY POPULATION
Quality of Life in Patients not on Dialysis: In Patients not on dialysis the KDQOL-SFTM scale were ranged from 40.39 to 81.37. In kidney disease
targeted scales burden of kidney disease (27.41 ± 17.06), cognitive function (72.91 ± 18.19), quality of social interaction (77.66 ± 20.42). Effects of kidney disease (66.13 ± 14.07), work status (43.43 ± 26.15) whereas symptom/problem list (81.37 ± 12.22), Sleep (65.88 ± 22.28) and social support (86.15 ± 22.71).
12.25), sleep (65.22 ± 18.37), social support (78.21 ± 23.86) had mean score of above 50. There was no significant change in the KDQOL-SFTM overall scores among the two group patients. A similar study was conducted by Cheung et al. 17
CONCLUSION: The exact measure of QOL in patients with renal disease is very challenging. Some items like subjective and objective tools, generic and disease-specific scales are commonly used to measure QOL in patients with renal disease. A challenge rests on making these domains clinically significant. Our findings show that some symptom burden was higher in the non-dialysis group compared to the dialysis group, but most of the symptoms did not reach statistical significance. Similarly, our results indicate no differences in quality of life and symptoms between CRF patients with dialysis and without dialysis. But the individual assessment of the quality of life is multifactorial, and the development of renal dysfunction may not be the only factor. Some limitations of the present study are the comparatively lesser sample size to identify significant changes between the two groups. The cross-sectional design was conducted to define the associations between variables and not causal relationships. Longitudinal studies are required to get a better understanding of the effect of the CKD on QOL.
ACKNOWLEDGEMENT: We would like to
especially thank all the study participants.
CONFLICT OF INTEREST: The authors declare there are no conflicts of interests regarding this study.
REFERENCES:
1. Coresh J, Selvin E, Stevens LA, Manzi J, Kusek JW and Eggers P: Prevalence of chronic kidney disease in the United States. JAMA 2007; 298(17): 2038-47.
2. Etgen T, Chonchol M, Forstl H and Sander D: Chronic Kidney Disease and Cognitive Impairment: A Systematic Review and Meta-Analysis. American Journal of Nephrology 2012; 35(5): 474-82.
3. Coresh J, Astor BC, Greene T, Eknoyan G and Levey AS: Prevalence of chronic kidney disease and decreased kidney function in the adult US population: Third National Health and Nutrition Examination Survey. American Journal of Kidney Diseases 2003; 41(1): 1-12.
4. World Health Organization Quality Of Life (WHOQOL) Group. Development of the WHOQOL: rationale and current status. Int J Ment Health 1994; 23(3): 24-56 5. Hays RD, Kallich JD, Mapes DL, Coons SJ and Carter
WB: Development of the kidney disease quality of life (KDQOL) instrument. Qual Life Res 1994; 3(5): 329-38 6. Mujais SK, Story K and Brouillette J: Health-related
Quality of Life in CKD Patients: Correlates and Evolution over Time. Clin J Am Soc Nephrol 2009; 4(8): 1293-01. 7. Iseki K, Nakai S and Shinzato T: Increasing gender
difference in the incidence of chronic dialysis therapy in Japan. Ther Apher Dial 2005; 9(5): 407-11.
8. USRDS: USRDS, 2007 Annual Data Report. National Institutes of Health, National Institute of Diabetes and Digestive and Kidney Diseases 2007: 84.
9. Neugarten J: Effect of gender on the progression of the nondiabetic renal disease a meta-analysis. J Am Soc Nephrol 2000; 11(2): 319-29
10. Goldberg I and Krause I: The role of gender in chronic kidney disease. EMJ 2016; 1(2): 58-64.
11. Fox CS, Larson MG, Leip EP, Culleton B, Wilson PW and Levy D: Predictors of new-onset kidney disease in a community-based population. Jama 2004; 291(7): 844-50. 12. Morgado E and Neves PL: Hypertension and chronic
kidney disease: cause and consequences- therapeutic consideration, antihypertensive drugs, Prof. Hossein Babaei (Ed.) 2012. ISBN: 978-953-51-0462-9, InTech, Available from: https//www.intechopen.com/books/ antihypertensivedrugs/hypertensionin–chronic–kidney– disease–cause–and– consequence –therapeutic-consideration
13. Rossing P, Fioretto P, Feldt-Rasmussen B and Parving HH: Diabetic nephropathy. In: Brenner and Rector’s, eds. Skorecki K, Chertow GM, Marsden PA, Yu ASL, Taal MW. The Kidney. 10th Ed. Philadelphia, Elsevier 2015: 1283-81. https://www.elsevier.com/books/brenner-and- rectors-the-kidney-2-volume-set/skorecki/978-1-4557-4836-5
14. Mehdi U and Toto RD: Anemia, Diabetes, and Chronic Kidney Disease. Diabetes Care 2009; 32(7): 1320-26. 15. Ellis PA and Cairns HS: Renal impairment in elderly
patients with hypertension and diabetes. QJM-INT J MED 2001; 94(5): 261-65.
16. Abdel-Kader K, Unruh ML and Weisbord SD: Symptom burden, depression, and quality of life in chronic and end-stage kidney disease. Clin J Am Soc Nephrol 2009; 4(6): 1057-64.
17. Cheung YB, Seow YY, Qu LM and Yee AC: Measurement properties of the Chinese Version of the kidney disease quality of life-short form (KDQOL-SF™) in end-stage renal disease patients with poor prognosis in Singapore. J Pain Symptom Manage 2012; 44(6): 923-32.
All © 2013 are reserved by International Journal of Pharmaceutical Sciences and Research. This Journal licensed under a Creative Commons Attribution-NonCommercial-ShareAlike 3.0 Unported License.
This article can be downloaded to Android OS based mobile. Scan QR Code using Code/Bar Scanner from your mobile. (Scanners are available on Google Play store)
How to cite this article: