N A N O E X P R E S S
Open Access
Analysis of p-Si macropore etching using
FFT-impedance spectroscopy
Emmanuel Ossei-Wusu
*, Jürgen Carstensen and Helmut Föll
Abstract
The dependence of the etch mechanism of lithographically seeded macropores in low-doped p-type silicon on water and hydrofluoric acid (HF) concentrations has been investigated. Using different HF concentrations (prepared from 48 and 73 wt.% HF) in organic electrolytes, the pore morphologies of etched samples have been related toin situimpedance spectra (IS) obtained by Fast Fourier Transform (FFT) technique. It will be shown that most of the data can be fitted with a simple equivalent circuit model. The model predicts that the HF concentration is responsible for the net silicon dissolution rate, while the dissolution rate selectivity at the pore tips and walls that ultimately enables pore etching depends on the water content. The‘quality’of the pores increases with decreasing water content in HF/organic electrolytes.
Keywords:p-Si macropores, HF concentration, water content or concentration, organic electrolytes, impedance spectroscopy
Background
The formation of macropores in silicon was first discov-ered by Lehmann and Föll in the 1990s [1]; macropores in this case were etched into n-type silicon under back-side illumination using HF/aqueous electrolytes. They came up with a model (usually referred to as the Leh-mann model) that essentially relied on the geometry of the space charge region to explain pore formation. The model is only applicable to n-type silicon, and it took al-most half a decade before Propst and Kohl succeeded for the first time in etching macropores in p-type silicon (with rather ‘bad’ pore morphologies) using acetonitrile as a base for an almost water-free electrolyte [2]. Since then, the use of electrolytes based on organic solvents such as dimethylformamide (DMF), dimethylacetamide (DMA), dimethyl sulfoxide, and ethanol have been shown to enable macropore etching in p-type silicon, and several models emerged dealing with this. For ex-ample, Ponomarev and Lévy-Clément [3,4] attempted to correlate the etching of macropores in p-type Si to a covering (and thus passivation) of the pore walls by the organic molecules, whereas Wehrspohn et al. empha-sized differential current flow based on the resistivity of
the wafer and the electrolytes and even reported the first p-macropores etched by using aqueous electrolytes [5]. In 2000, Christophersen et al. proposed H-termination as the passivation mechanism of the pore walls [6]. Meanwhile, it was shown that lithographically pre-structuring the sample has a major influence on the ease of macropore etching in p-type substrates and the qual-ity of the pores (far more pronounced than in n-type substrates) [7-10]. Not much data seem to exist about the role of the HF concentration in p-macropore formation.
In this investigation, emphasis was placed on the effect of the HF and water concentrations while using organic solvents as major ingredient of the electrolytes. The dif-ferent morphologies of the pores etched, as well as the importance on the dissociation rate of HF in the solvents, will be reported. FFT impedance spectra, which were taken in situ every 2 s, were analyzed and compared to the final pore morphologies.
Methods
The starting material for this investigation was mono-crystalline, boron-doped p-type silicon wafers with {100} orientation, a resistivity of nominally 20 Ωcm (doping concentration 1014 cm−3), and a standard backside aluminum metallization for good ohmic contacts. In
* Correspondence:[email protected]
Institute for Materials Science, Christian-Albrechts-University of Kiel, Kaiserstrasse 2, Kiel 24143, Germany
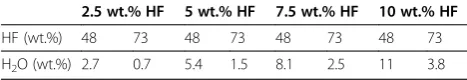
order to ensure uniform pore growth from the very be-ginning [8], lithographically pre-structured p-Si wafers were used. Structuring of the wafers was done by our group (using the standard technology), resulting in a cubic arrangement of inverted pyramids with a spacing of 2 to 3 μm. Details of the structuring procedure are described elsewhere [11]. The wafers were cut into 2 × 2 cm2 pieces for the pore etching, with an effective etching area of 1 cm2. Etching was performed at a con-stant temperature of 20 °C. Electrolytes were based on either DMF or DMA. Hydrofluoric acid was added to produce four different concentrations: 2.5, 5, 7.5, and 10 wt.%, respectively. Two kinds of HF were used: 48 and 73 wt.%. This results in eight kinds of electrolyte that differ not only in their HF concentration but also in the residual nominal water concentration. Table 1 lists the resulting properties. In what follows, we use a short-hand description for electrolytes by using a string that lists solvent/HF concentration/(water concentration). Note that the water concentration in a DMF 5%(5.4%) electrolyte is about the same as in a DMF 10%(3.8%) electrolyte and that this allows evaluation of the influ-ence of the HF concentration independently from the in-fluence of the water concentration.
Concentrations are always given in weight percent so that differences in the densities of the organic electro-lytes were not relevant. The experiments with DMA 2.5%(x) electrolytes always produced rather ‘bad’ pore morphologies and were therefore ignored.
While the use of these organic solvents is not new in the electrochemistry of silicon [2,3,8,12,13], in this work, we used only newly prepared electrolyte to perform the experiments, and the volume of the organic solvents used for each preparation was the same (190 ml) for all the experiments, ensuring comparable residual contents of water. The pores were etched for 30 min with a con-stant current density of j =10 mA/cm2. In situ FFT-IS measurements were performed every 2 s; recording a spectrum took 1 s. The IS employed 24 frequencies in a range of 5 Hz to 20 kHz. All spectra could be fitted quite well by a simple equivalent circuit consisting of one series resistance in series with three circuits with a resistor parallel to a capacitor (RpCpcomponents). Thus,
there are seven independent R/Cparameters, and these parameters were extracted in situ. From these para-meters, three time-constant τ=RC that were also dis-played in situ could be constructed. To the best of our
knowledge, this is thus the first investigation of p-macropores where relevant data other than currents and potentials were obtained during etching. A detailed de-scription of the model and procedures with respect toin
situ FFT impedance are described in [14-16]. A fully integrated laboratory etching system of ET&TE GmbH (Kiel, Germany) controlled all parameters of the etching procedure. The pore morphologies were examined by a scanning electronic microscope and were compared with the FFT-IS measurements for further analysis.
Results
Pore morphology and geometry
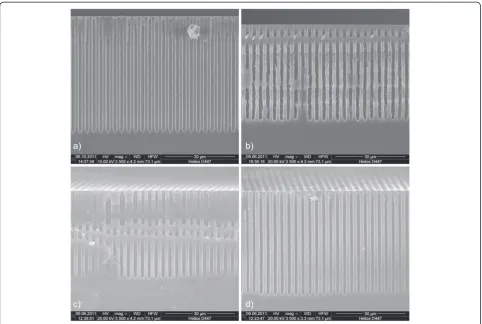
The parameters for etching the ‘best’ macropores are used as reference. The best pores are pores with straight and smooth walls, having a constant cross-section, and growing deep and uniform into the substrate. The best pores were obtained with a DMF 5%(5.4%) electrolyte at a temperature of 20 °C and a current density of 10 mA/cm2 applied for 30 min. These best pores have smooth walls, a constant diameter (around 1.4 μm), and pore lengths of around 50 μm (Figure 1a). Against expectations, experiments using the same parameters except for an increased HF concentration, i.e., DMF 10%(11%) instead of DMF 5%(5.4%), produced pores with shorter lengths (around 42μm), rougher walls, and larger diameters, as shown in Figure 1b.
On the other hand, maintaining the HF/water concen-tration at 10%(11%) and repeating the experiment using DMA as a solvent, the etched pores had much smoother pore walls (Figure 1c) similar to those etched with DMF 5%(5.4%) (Figure 1a) but were shorter in length (around 40μm) and slightly bigger in diameter (around 1.7 μm). Further, the morphology of the pores etched using DMA 10%(3.8%) shown in Figure 1d was nearly identical to that of the pores etched with DMF 5%(5.4%) in Figure 1a. This shows that both the HF concentration and the water content are important for the pore formation. For almost the same water content, DMA needs approxi-mately double the HF concentration in comparison to DMF to produce the same pore structure. We postulate that this is linked to the different dissociation rates of the HF in the solvents, which is well known to have a big impact on the pore etching [13,17]. It should be mentioned that pores etched with DMA 5%(5.4%) elec-trolyte had smooth walls but shorter lengths (around 20μm) and bigger diameters (around 2.2μm) than those produced with DMA 10%(3.8%).
[image:2.595.56.290.693.733.2]To double-check the effect of water content on the pore lengths, two experiments were designed for produ-cing very deep pores. DMF 5%(5.4%) and DMF 5%(1.5%) electrolytes were employed for this. The etching time was 540 min, and an optimized current density profile was used. Etching started with 3 mA/cm2 for 2 min, Table 1 HF and water concentrations in the various
electrolytes used
2.5 wt.% HF 5 wt.% HF 7.5 wt.% HF 10 wt.% HF
followed by a sharp increase (within 1 min) to 23 mA/cm2, a linear decrease to 10 mA/cm2within 120 min, and finally another linear decrease to 5.7 mA/cm2within 417 min. As
[image:3.595.57.540.88.412.2]expected, pores etched with DMF 5%(1.5%) with less water concentration were found to be around 520μm deep and, thus, 70 μm deeper and smoother than those etched with Figure 1Macropore morphologies obtained with DMA- and DMF-based electrolytes and different HF and water concentrations.The pores were etched into 20-Ωcm p-Si {100} with nuclei distance of 3μm andj= 10 mA cm−2.a) DMF 5%(5.4%) resulted in pores with smooth walls and constant diameter.b) DMF 10%(11%) resulted in pores with rougher walls, larger diameter, and shorter lengths.c) DMA 10%(11%) resulted in pores with smooth walls, constant but bigger diameter, and shorter lengths.d) DMA 10%(3.8%) resulted in pores with geometries nearly identical to that of (a).
[image:3.595.58.539.539.713.2]the DMF 5%(5.4%) where the water content was relatively high. The pores obtained are shown in Figure 2.
FFT-IS results
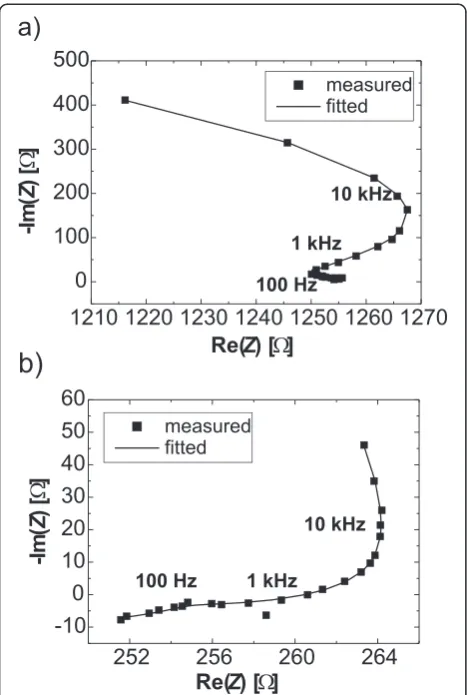
For all experiments, FFT-IS has been performed every 2 s. Many-thousand spectra could be well fitted to a model containing three (RpCp) components and one Rs
in series; the Nyquist plots in Figure 3 show examples. These plots resulted during pore etching with DMF 5% (5.4%) and DMF 10%(11%) electrolytes. Those pores do not only differ in quality, as outlined above, but also in the quantitative impedance data. Not only the shape of the curves is rather different, but the impedance values also differ by a factor of 10 and 5, respectively, on the imaginary and real axes. Nevertheless, the data can be fitted rather well with one model, as outlined above.
The model fits the overwhelming majority of the remaining many-thousand impedance spectra just as well. Note that it was not possible to use models with less than three (RpCp) components to fit all
pore-etching experimental parameters. The spectra thus generated seven individual parameters plus several cal-culated ones, e.g., time constants or (Rp2+Rp3) as a
function of time. These parameters were extracted in
situ and displayed during the etching. Figure 4 shows a typical example with data generated during pore etching with DMF 5%(5.4%).
[image:4.595.57.291.88.436.2]The individual parameter curves generated stay ra-ther constant during the bulk of etching (the ‘noise’ visible in Figure 4 is mostly due to the expanded scales and relatively small in absolute values), which demonstrates the stability of the etching process dur-ing the complete etchdur-ing time of 30 min. From these curves, the steady state values (indicated by straight Figure 3Nyquist plots showing the high-quality fitting (solid
line) for substantially different HF and water concentrations.
Pores were etched into 20Ωcm p-Si {100) atj= 10 mA/cm2.a) DMF 5%(5.4%) andb) DMF 10%(11%).
[image:4.595.59.540.521.696.2]horizontal lines) of all fitting parameters have been extracted and plotted versus HF and/or water concen-trations, as shown in Figure 5.
Discussions
Pore etching is a very complicated process in which all the parameters involved should be in their optimal re-gime to produce comparable results. Pore formation mechanisms, which have been studied in detail by many authors [1,2,18-20], take into consideration the nucleation of the pores, oxide formation and dissol-ution, diffusion limitations and thus local changes of, e.g., the HF concentration as the pores get longer, current flow at the pore tips related to local field
strengths, the leakage current (current that flows in the dark) through the pore walls, the selectivity of the hydrogen (H2) passivation of the pore walls and tips,
and much more.
[image:5.595.58.543.273.675.2]Detailed descriptions of the importance of doping con-centration, lithography pre-structuring KOH etch pits, and the kind of solvent can be found in [8,9,21-25]. None of the models, however, has anything to say on the impedance underlying the etching process. Here, we will limit the discussion to the data presented, except to point out that, without the seeded nucleation, no good pores would have been obtained in most cases and that most of the models mentioned above do not consider the influence of nucleation on pores.
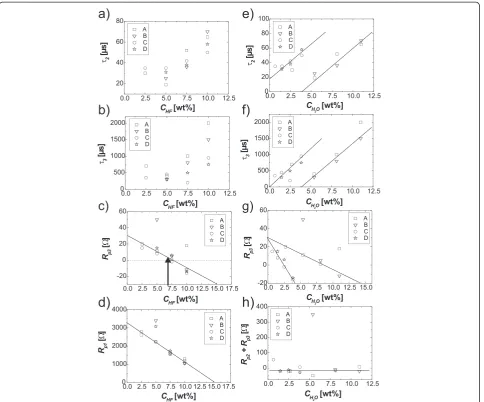
Figure 5The effect of HF and/or water concentrations on six fitting parameters (extracted from Figure 4).A, 48 wt.% HF/DMF; B, 48 wt.% HF/DMA; C, 73 wt.% HF/DMF; and D, 73 wt.% HF/DMA electrolytes.a) andb) show no clear dependence of the time constants (τ2andτ3) on the HF concentration;c) andd) show that the HF concentration is proportional to the transient resistances (Rp1andRp3);e) andf) show the effect of water on the time constants (τ2andτ3);g) shows no clear effect of the water concentration onRp3; andh) shows that neither the HF
DMF 5%(5.4%) and DMA 10%(3.8%) produced nearly identical pores as far as morphologies are concerned. This most likely indicates that the dissociation rate of HF in a particular solvent is an (obviously) important parameter, which has impact on the pore formation (as it has also been mentioned by [13,17]). If, for the time being, one accepts this as the reason for the difference between the solvents, it follows that the HF dissociation in DMA should be smaller than in DMF.
In this paper, we will only address some more general features, which can be extracted from the FFT impedance data shown in Figure 5. Most astonishing is the result shown in Figure 5h; the sum of the transfer resistances
Rp2andRp3is constant and thus independent of the water
concentration (and of the HF concentration). Although the reason for this is not clear, it cannot be treated as a trivial or self-explaining result. Like in the case of energy conservation, system parameters that do not change but are conserved hint at fundamental properties of a system. Here, the sum of the two transfer resistances that are related to the large time constantsτ2andτ3(i.e., the slow
processes) stays constant. To some extent, this can be seen as a necessity for etching ‘good’ macropores in p-Si since constancy of Rp2+Rp3 is not a general feature of
macropore formation. Many experiments that produce only ‘bad’ pores do not show this effect. This indicates strongly that the slow processes related to the large time constants are essential for the formation of good macro-pores in p-Si. Comparing Figure 5a and Figure 5e or Figure 5b and Figure 5f, respectively, the two large time constants show a simple dependence on the water con-centration (two straight lines), while the relation to the HF concentration is not that clear. Thus, it is probably the water concentration which has the most direct impact on the two slow processes.
Comparing Figure 5c and Figure 5g, the transfer resist-ance Rp3 depends linearly on the HF concentration,
while two straight lines are found as a function of water concentration, so in contrast to the time constants, the transfer resistances depend mainly on the HF concentra-tion. The sum of the three transfer resistances just describes the linear response in the steady state (i.e., ω≥0); in other words, the amount of silicon etched away depends, as clearly expected, mainly on the HF concen-tration. In contrast, the pore quality depends decisively on the water concentration. High pore quality is achieved if etching proceeds only at pore tips and not at the pore walls; the results thus give strong indications that, for p-Si, the water concentration in the organic solvent has a strong impact on the passivation of the pore walls. The results shown in Figure 2 may be seen as a direct check of this statement. Although the electro-lyte DMF 5%(5.4%) allows for very good pore formation when etching for 30 min, reaching a pore depth of
50 μm, strong differences in using DMF 5%(1.5%) are found when etching for much longer times (540 min), reaching pore depths of 450 and 520 μm, respectively. The insets show the large differences especially in the morphology of the pore walls. In the experiment using higher water concentration, the walls are rougher close to the pore tips, and close to the top, the pore walls are nearly destroyed, while for DMF 5%(1.5%), the pore walls are much more stable and smoother.
Conclusions
It has been demonstrated that the HF concentration and the water content of DMA- and DMF-based electrolytes are essential for the quality of macropores etched into lithographically pre-structured low-doped p-type silicon. The achievable pore lengths, pore diameters, and the pore wall smoothness depend on both parameters (and the solvent). Fromin situimpedance data, it can be con-cluded that the HF concentration is mainly responsible for the volume of silicon dissolved, while the water con-tent is instrumental for the selectivity of the etching be-tween pore tips and walls. The water content is thus instrumental for the pore wall stability and, therefore, the maximum achievable lengths of the pores.
Competing interests
The authors declare that they have no competing interests.
Acknowledgements
The authors thank the FhG ISIT for the silicon wafers used in this work. We also express our sincere appreciation to Dr. E. Quiroga-González, J. Bahr, and Mrs. K. Brandenburg for the lithographical structuring of the wafers, fruitful discussions, and technical help.
Authors’contributions
All authors have contributed equally to this work, read, and approved the final manuscript.
Received: 30 April 2012 Accepted: 20 June 2012 Published: 20 June 2012
References
1. Lehmann V, Föll H:Formation mechanism and properties of electrochemically etched trenches in n-type silicon.J Electrochem Soc 1990,137(2):653–659.
2. Propst EK, Kohl PA:The electrochemical oxidation of silicon and formation of porous silicon in acetonitrile.J Electrochem Soc1994,141
(4):1006–1013.
3. Ponomarev EA, Levy-Clement C:Macropore formation on p-type Si in fluoride containing organic electrolytes.Electrochem Solid-State Lett1998,
1(1):42–45.
4. Ponomarev EA, Lévy-Clément C:Macropore formation on p-type silicon. J Por Mat2000,7:51–56.
5. Wehrspohn RB, Chazalviel J-N, Ozanam F:Macropore formation in highly resistive p-type crystalline silicon.J Electrochem Soc1998,145:2958–2961. 6. Christophersen M, Carstensen J, Feuerhake A, Föll H:Crystal orientation
and electrolyte dependence for macropore nucleation and stable growth on p-type Si.Mater Sci Eng B2000,69–70:194–198.
7. Chao KJ, Kao SC, Yang CM, Hseu MS, Tsai TG:Formation of high aspect ratio macropore array on p-type silicon.Electrochem Solid-state Lett2000,
3(10):489–492.
9. Zheng J, Christophersen M, Bergstrom PL:Thick macroporous membranes made of p-type silicon.Phys Stat Sol (a)2005,202(8):1402–1406. 10. Astrova EV, Borovinskaya TN, Tkachenko AV, Balakrishnan S, Perova TS,
Rafferty A, Gun’ko YK:Morphology of macro-pores formed by electrochemical etching of p-type Si.J Micromech Microeng2004,
14:1022–1028.
11. Quiroga-González E, Ossei-Wusu E, Carstensen J, Föll H:How to make optimized arrays of Si nanowires suitable as superior anode for Li-ion batteries.J Electrochem Soc2011,158(11):E119–E123.
12. Lehmann V, Rönnebeck S:The physics of macropore formation in low doped p-type silicon.J Electrochem Soc1999,146(8):2968–2975. 13. Föll H, Christophersen M, Carstensen J, Hasse G:Formation and application
of porous silicon.Mat Sci Eng R2002,39(4):93–141.
14. Popkirov GS, Schindler RN:A new impedance spectrometer for the investigation of electrochemical systems.Rev Sci Instrum1992,
63:5366–5372.
15. Foca E, Carstensen J, Popkirov G, Föll H:Controlling macropores etching in n-Si by means of FFT in-situ voltage- and photoimpedance
spectroscopy.ECS Trans2007,6(2):345–353.
16. Carstensen J, Foca E, Keipert S, Föll H, Leisner M, Cojocaru A:New modes of FFT impedance spectroscopy applied to semiconductor pore etching and materials characterization.Phys Stat Sol (a)2008,205(11):2485–2503. 17. Lust S, Lévy-Clément C:Chemical limitations of macropore formation on medium doped p-type silicon.J Electrochem Soc2002,149(6):C338–C344. 18. Niwano M, Miura T, Miyamoto N:Hydrogen exchange reaction on
hydrogen-terminated (100) Si surface during storage in water.J Electrochem Soc1998,145:659–661.
19. Carstensen J, Christophersen M, Hasse G, Föll H:Parameter dependence of pore formation in silicon within a model of local current bursts.Phys Stat Sol (a)2000,182(1):63–69.
20. Carstensen J, Christophersen M, Föll H:Pore formation mechanisms for the Si-HF system.Mat Sci Eng B2000,69–70:23–28.
21. Chazalviel J-N, Ozanam F, Gabouze N, Fellah S, Wehrspohn RB:Quantitative analysis of the morphology of macropores on low-doped p-Si Minimum resistivity.J Electrochem Soc2002,149(10):C511–C520.
22. Föll H, Leisner M, Cojocaru A, Carstensen J:Macroporous semiconductors. Materials2010,3:3006–3076.
23. Kochergin V, Föll H:Porous Semiconductors: Optical Properties and Applications. London: Springer; 2009.
24. Foell H, Carstensen J, Foca E, Leisner M:Understanding and controlling pore etching in semiconductors.ECS Trans2007,6(2):309–322. 25. Leisner M, Carstensen J, Föll H:FFT impedance spectroscopy analysis of
the growth of anodic oxides on (100) p-Si for various solvents.J Electroanal Chem2008,615(2):124–134.
doi:10.1186/1556-276X-7-320
Cite this article as:Ossei-Wusuet al.:Analysis of p-Si macropore etching
using FFT-impedance spectroscopy.Nanoscale Research Letters20127:320.
Submit your manuscript to a
journal and benefi t from:
7Convenient online submission
7Rigorous peer review
7Immediate publication on acceptance
7Open access: articles freely available online
7High visibility within the fi eld
7Retaining the copyright to your article