N A N O E X P R E S S
Open Access
Insulin-producing cells could not mimic the
physiological regulation of insulin secretion
performed by pancreatic beta cells
Qiping Shi
1†, Simin Luo
1†, Haiying Jia
1, Lie Feng
1, Xiaohua Lu
1, Lixin Zhou
2and Jiye Cai
2*Abstract
Objective:The aim of this study was to compare the difference between insulin-producing cells (IPCs) and normal human pancreatic beta cells both in physiological function and morphological features in cellular level.
Methods:The levels of insulin secretion were measured by enzyme-linked immunosorbent assay. The insulin gene expression was determined by real-time quantitative polymerase chain reaction. The morphological features were detected by atomic force microscopy (AFM) and laser confocal scanning microscopy.
Results:IPCs and normal human pancreatic beta cells were similar to each other under the observation in AFM with the porous structure features in the cytoplasm. Both number of membrane particle size and average roughness of normal human beta cells were higher than those of IPCs.
Conclusions:Our results firstly revealed that the cellular ultrastructure of IPCs was closer to that of normal human pancreatic beta cells, but they still could not mimic the physiological regulation of insulin secretion performed by pancreatic beta cells.
Keywords:Insulin-producing cells, Human normal pancreatic beta cells, Atomic force microscopy
Background
Diabetes is caused by absolute or relatively insufficient insulin secretion. Hitherto, there is no cure for diabetes. Treatment with insulin prolongs survival and improves glycemic control, and current standard diabetes treat-ment regimens with insulin replacetreat-ment remain away from ideal. Transplantation of either isolated islets or the whole pancreas provides another mode for insulin replacement [1] but is often accompanied by many un-desirable side effects [2-4]. Insulin-producing cells (IPCs) from pluripotent stem cells offer the potential to treat diabetes by providing a source for injured pancre-atic beta cells without the limitations of current thera-peutic modalities. To be successful, yet, IPCs must possess physiologically appropriate regulation of insulin secretion [5,6], including sensing circulating glucose concentrations and secreting insulin in response to
physiological glucose concentrations appropriately with-out risk of neoplastic transformation [7,8]. Nowadays, unresolved obstacles associated with differentiation of stem cells into IPCs include maturation of the insulin secretory pathways and mechanisms responsible for sensing ambient glucose concentrations as well as lack of sufficient development of the insulin processing ma-chinery [9,10].
Atomic force microscopy (AFM) has been widely used in cell biology studies, especially of both cellular and subcellular structures and topographical morphology [11,12], because of its ability to image biological samples at nanometer resolutions. Differences in cell morphology can likely reveal the reason why there is great difference in cellular function. Thus, we compared the differences in morphology and function between normal human pancreatic beta cells and IPCs derived from human adipose-derived stem cells (hADSCs). Moreover, we examined the relationship between cell morphology and function. At the molecular level, we found that although IPCs had a similar distribution of membrane proteins to * Correspondence:tjycai@jnu.edu.cn
†Equal contributors
2
Institute for Nano-Chemistry, Department of Chemistry, Jinan University, Guangzhou 510632, China
Full list of author information is available at the end of the article
normal pancreatic beta cells, they still could not mimic the physiological regulation of insulin secretion performed by normal pancreatic beta cells. We propose that the dif-ference in physiological function between these two kinds of cells is due to the difference in the nanostructure of their cell membranes.
Methods
Isolation and differentiation of MSCs from human adipose tissue
Human adipose tissue was obtained from four donors, two males and two females. Informed consent was obtained from participating donors according to procedures ap-proved by the Ethics Committee at the Chinese Academy of Medical Sciences. Experiments were performed ac-cording to the ethical standards formulated in the Helsinki Declaration. The isolated and differentiated procedure was described by Shi et al. [13]. In order to authenticate the phenotypes of mesenchymal stem cells (MSCs), flow cytometric analysis of hADSCs was performed using anti-bodies for CD59, CD34, CD44, CD45, CD105, CD13, and HLA-DR (BD Biosciences, Franklin Lakes, NJ, USA).
Culture of normal human pancreatic beta cells
Normal human pancreatic beta cells were obtained com-mercially (HUM-CELL-0058, Wuhan Pricells Biotech-nology & Medicine Co., Ltd., Wuhan, China). Expansion medium contained MED-0001 and 5 ng/mL rhEGF, 5μg/mL rhinsulin, 5μg/mL transferrin, 10 nM T3, 1.0μM epinephrine, 5 μg/mL hydrocortisone, 10% fetal bo-vine serum (all expansion media were from Wuhan Pricells Biotechnology & Medicine Co., Ltd.). The cells were cultured in complete medium in T-25 tissue culture flasks that have been coated with collagenase at 37°C in 5% CO2. Culture medium was
changed every other day.
Insulin assay
Both normal human pancreatic beta cells and IPCs were preincubated in Dulbecco's phosphate-buffered saline (D-PBS, without glucose), low-glucose Dulbecco's modi-fied Eagle's medium (DMEM; 5.5 mM, Gibco, Grand Island, NY, USA), or high-glucose DMEM (25 mM, Gibco) for 1 h or 30 min. The buffers from six wells of cells were collected separately. The amount of insulin in the buffer of each well was determined by ultrasensitive insulin enzyme-linked immunosorbent assay (ELISA) and normalized by the number of cells in each well.
Quantitative gene expression analysis
Total RNA was collected from cells using TRIzol reagent (Invitrogen, Carlsbad, CA, USA) and treated with DNase. Total RNA (1 μg) was analyzed by quantitative reverse transcription-polymerase chain reaction (qRT-PCR) in an
ABI 7000 Real-Time PCR System (Applied Biosystems, Foster City, CA, USA) using the Sybr-Green primers. Real-time PCR was performed using a real-time PCR Taq core kit (Takara, Dalian, China). The reaction consisted of 50 μL, containing 25 μL Sybr-Green, 16 μL H2O, 5 μL
cDNA, 2μL sense primer (10μM), and 2μL antisense pri-mer (10μM). The conditions were set in accordance with the manufacturer's protocol. Expression was calculated relative to glyceraldehyde-3-phosphate dehydrogenase (GAPDH). All primers were from Invitrogen (Table 1).
Sample preparation for AFM
To detect the morphological changes of beta cells and IPCs before and after glucose stimulation, cells were separated into five groups: glucose-free culture medium group (D-PBS), 30-min low-glucose stimulation group, 1-h low-glucose stimulation group, 30-min high-glucose stimulation group, and 1-h high-glucose stimulation group. Cell samples were preincubated for 1 h or 30 min in D-PBS, low-glucose DMEM (Gibco), or high-glucose DMEM (Gibco). They were then washed in distilled water twice before being fixed with 2.5% glutaraldehyde for 20 min. The samples were washed in distilled water three times again, then air-dried for AFM scanning.
AFM measurement
An Autoprobe CP AFM (Veeco, Plainview, NY, USA) was used in contact mode to detect the immobilized IPCs and normal human pancreatic beta cells at room temperature. Silicon nitride tips (UL20B, Park Scientific Instruments, Sunnyvale, CA, USA) were employed in all AFM measurements. An optical microscope was used to help select the desired cells and direct the position of the AFM tip. Single-cell imaging was repeated for six cells, and each cell was scanned for three times. All images were analyzed by the instrument-equipped soft-ware (Image Processing Softsoft-ware Version 2.1) to gain in-formation on the topography. ‘Ra’ denotes the average roughness in the analytical area. All parameters were directly generated by the software IP2.1.
LCSM and observation
[image:2.595.305.537.695.733.2]Cells were fixed in 2.5% glutaraldehyde for 30 min, washed in PBS, and then permeabilized in 0.1% Triton X-100 at room temperature for 30 min. After, cells were washed in PBS thoroughly. Cells were then incubated with 1μM phalloidin-rhodamine (Biotium, Inc., Hayward, CA, USA) at 4°C overnight to label F-actin. After several washes in PBS, the labeled cells were scanned by LCSM
Table 1 Sequences of primers for real-time qRT-PCR
Primer Sense (50-30) Antisense (50-30)
Insulin 50-GCAGCCTTTGTGAAC CAACA-30
(510 Meta Duo Scan, Carl Zeiss, Oberkochen, Germany) using 545-nm (He-Ne) excitation. Emission was detected above 600 nm.
Statistical analysis
All data were presented as mean values ± standard devi-ation taken from ten different cells. The morphologic parameters between the different groups were compared usingttest (via SPSS 11). Differences with Pvalues less than 0.05 were considered to be statistically significantly.
Results
Morphology and phenotypes of cultured hADSCs
Isolated hADSCs exhibited a spindle shape, began to ap-pear in culture, and reached 90% confluence in about 10 to 12 days. The second passage of hADSCs expanded rapidly and developed a uniform morphology that re-sembled that of fibroblasts. FACS analysis of hADSCs at the third passage showed that these cultured cells were positive for CD13 (98.88%), CD44 (98.9%), CD59 (98.4%), and CD105 (71.24%). In addition, expression of HLA-DR (0.98%) was not detected. Furthermore, hADSCs exhibited low expression of hematopoietic lineage markers CD45 (1.03%) and CD34 (2.88%).
Differentiation of IPCs
Insulin cannot be used as a differentiating medium, so the insulin that appeared in media after glucose stimula-tion was synthesized de novo and secreted by IPCs. Figure 1 shows that the expression of insulin gene mas-sively increased. Insulin mRNA expression in IPCs increased 16-fold, from day 0 to day 12 (P < 0.05). To verify whether IPCs could secrete insulin as a result of sensing physiological glucose concentrations as beta cells
do, we first detected the quantity of insulin secretion in different glucose concentrations and under different stimulating time frames. ELISA (Table 2) showed that beta cells and IPCs from all four donors secreted insulin after 30 min or 1 h of stimulation, with no difference existing between 30 min and 1 h of stimulation in high glucose concentrations. However, in low glucose con-centrations, the amount of insulin was obviously lower than that in high-glucose stimulation for 30 min or 1 h. Interestingly, normal human pancreatic beta cells re-sponded to low glucose concentrations after 30 min of stimulation, and the amount of insulin was similar to the amount resulting from 1 h of stimulation. On the other hand, IPCs hardly secreted any insulin (0.46 ± 0.04 μU/mL) after low-glucose stimulation for 30 min and only secreted a little insulin (1.01 ± 0.11 μU/mL) after 1 h of stimulation in low glucose concentrations. Our data illustrated that insulin secretion from both normal beta cells and IPCs were regulated by glucose. However, the amount of insulin secreted by beta cells was much higher than that by IPCs (P< 0.05).
Morphology of cells as observed by AFM
For each group, two coverslips containing six cells each were analyzed. There was not much difference in ap-pearance between the beta cells and IPCs observed via an inverted microscope. Single-membrane proteins may reveal the details of cell surface structures which can be observed by AFM. Therefore, we analyzed the nano-structures of beta cells and IPCs through AFM in con-tact mode. IPCs had similar morphological features to beta cells which appeared as polygons, ovals, or circles. IPCs were bigger than beta cells (P< 0.05; Table 3).
Figures 2 and 3 show a characteristic structure with many holes located in the cytoplasm in beta cells and IPCs. The porous structure was more obvious in the glucose-stimulated group. We measured the Ra in the analytical area. The statistical results showed that the Ra of the beta cells was bigger than that of the IPCs, re-gardless of whether glucose stimulation was provided (Table 4). We also measured the nanoparticle size of cells through AFM. The data indicate that the nanoparticle size of beta cells was bigger than that of IPCs, regardless of whether they were subject to glucose stimulation. More-over, for normal human pancreatic beta cells, the Ra
[image:3.595.305.538.662.726.2]Figure 1Gene expression analysis.Insulin gene expression by two groups of cells was 0.04 ± 0.004 for hADSCs and 0.65 ± 0.036 for IPCs; cycle threshold values of PCR assay were 14.12 ± 0.45 and 14.33 ± 0.37, respectively. Gene expression was normalized to GAPDH. The asterisk denotesP< 0.05.
Table 2 Insulin secretion of cells (μU/mL)
L-glucose L-glucose H-glucose H-glucose
(30 min) (1 h) (30 min) (1 h)
Normal human pancreaticβcells
9.25 ± 1.14 9.65 ± 1.12 23.43 ± 4.12 25.81 ± 2.57
IPCs 0.46 ± 0.04 1.01 ± 0.11 1.20 ± 0.13 1.50 ± 0.23
values were similar to each other when comparing 30-min stimulation with 1-h stimulation within the same glucose concentration (P< 0.05). However, in the IPCs group, Ra values were much lower when cells were stimulated for 30 min by low glucose concentrations, which was similar to the case observed in a non-glucose state (P> 0.05). Par-ticle size trends resembled those of the Ra values. Mean-while, due to the nanometer-scale resolution of AFM, we observed single-membrane proteins and revealed details of the cellular surface structure. Figures 2 (A3) and 3 (A3) showed that the membrane proteins of both beta cells and IPCs exhibited a homogeneous granular distribution. Figures 2 (B1 to B4, C1 to C4, D1 to D4, E1 to E4) and 3 (B1 to B4, C1 to C4, E1 to E4) evidenced that the cell surface architecture of the normal human pancreatic beta cells and IPCs had been changed and membrane pro-teins exhibited some extent of aggregation after glucose
stimulation, except for IPCs stimulated for 30 min in low glucose concentrations (Figure 3 (D1 to D4)).
Observation of cytoskeleton in human normal pancreatic beta cells and IPCs
[image:4.595.56.291.100.153.2]To prove whether exocytosis in IPCs and beta cells was enhanced after glucose stimulation, we analyzed the distribution of the cytoskeleton in these two cell populations. IPCs and beta cells were stained with phalloidin-rhodamine in order to visualize the intra-cellular actin distribution (Figure 4). When both the beta cells and IPCs were not stimulated with glucose, the F-actin network mainly consisted of parallel, dense, and continuous fibers (Figure 4 (A1, B1)). After 30 min or 1 h of glucose stimulation, regardless of concen-tration, the subcellular distribution of F-actin in beta cells was sparse and disorganized. However, the cortical actin network did not depolymerize in IPCs after 30 min of low-glucose stimulation (Figure 4 (B4)), but did depolymerize after 1 h of stimulation. Our results showed that the distribution of the cortical actin network in IPCs closely resembled that in beta cells. This process suggested that IPCs might have a similar insulin secretion mechan-ism as normal beta cells.
Table 3 Characteristic of cells
Normal human pancreaticβcells IPCs
Length (μm) 55.46 ± 4.84 73.45 ± 2.08*
Width (μm) 34.71 ± 1.57 40.78 ± 1.09*
Height (nm) 505.39 ± 12.01 421.46 ± 19.25*
*Compared with normal human pancreaticβcells, the difference was
[image:4.595.59.540.403.684.2]significant,P< 0.05.
Discussion
[image:5.595.56.540.89.377.2]We successfully extracted hADSCs from human adipose tissue according to the method reported in the literature [14,15] and characterized the phenotypes of hADSCs through flow cytometry. After that, we used a simple chemical method not involving insulin to differentiate hADSCs into IPCsin vitro. In order to assess the func-tion of IPCs, we tested the glucoinduced insulin se-cretion of IPCs and beta cells in vitro. Our data show that regardless of whether they were stimulated for 30 min or 1 h, the beta cells could release a certain amount of insulin after stimulation with high or low glucose concentrations. However, only when stimulated for 1 h in low glucose concentrations did IPCs secrete a little bit of insulin. The results indicate that IPCs can secrete insulin in response to glucose stimulation, similar to, but not as well as beta cells. Even though we only compared beta cells and one kind of IPC which was derived from one source using one differentiation method, our results made evident the difference in physiological function between these IPCs and beta cells. This evidence led to the question: ‘What were the reasons for the difference between IPCs and beta cells?’We conjectured that these differences were due to the differences in cellular structure. To confirm our
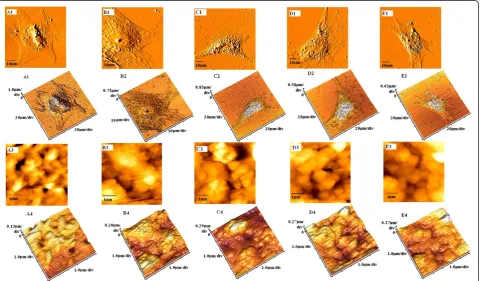
Figure 3Morphological changes of IPCs, as detected by AFM.Treated with D-PBS (A1 to A4), glucose medium for 1 h (B1 to B4), high-glucose medium for 30 min (C1 to C4), low-high-glucose medium for 1 h (D1 to D4), low-high-glucose medium for 30 min (E1 to E4). A1, B1, C1, D1, and E1 show the morphology of the whole cell; A3, B3, C3, D3, and E3 show surface ultrastructures on corresponding cells in images A2, B2, C2, D2, and E2; A4, B4, C4, D4, and E4 show 3D structures of the cells.
Table 4 Morphological features of three groups of cells
Normal human pancreaticβcells
IPCs
Ra (nm) N-glucose 107.05 ± 10.77 30.50 ± 1.61
H-glucose (30 min)
135.05 ± 6.46* 41.88 ± 2.38*
H-glucose (1 h)
138.26 ± 11.76* 49.41 ± 7.42*
L-glucose (30 min)
115.81 ± 46.86* 30.76 ± 1.29
L-glucose (1 h)
129.99 ± 15.33* 36.58 ± 2.99*
Particle size (nm) N-glucose 215 ± 7.9 152 ± 5.7
H-glucose (30 min)
345 ± 9.35* 225 ± 7.9*
H-glucose (1 h)
360 ± 8.0* 233 ± 10.4*
L-glucose (30 min)
221 ± 12.94* 160 ± 7.90
L-glucose (1 h)
229 ± 14.74* 169 ± 9.62
*Compared with N-glucose, the difference was significant,P< 0.05. N, none;
[image:5.595.56.291.490.715.2]hypothesis, we first used AFM to detect cell surface ultra-structure of beta cells and IPCs.
AFM images indicated the changes in morphological properties of IPCs and beta cells stimulated by glucose. The morphologies of IPCs and beta cells were similar to each other, as observed via AFM. They all were polyg-onal and contained visibly porous features in the cyto-plasm. AFM is a common method used to observe cell morphology. However, few studies have reported that these porous structures existed naturally on the cell sur-face [16-20]. Pores on the cell sursur-face generally appeared after treatment with some drugs [21,22]. Nevertheless, the pores observed after drug treatment were not the same as the porous structures we detected. The porous structures in the IPCs and beta cells were organized and well distributed around the nuclei. The pores that appear after drug treatment are dispersed and isolated. Kim et al. deemed that these isolated holes on the cell surface after drug treatment might be one form of cell apoptosis [22]. Additionally, we speculated that these uniform holes arranged in the cytoplasmic membrane might be dependent onto the type of cells. Beta cells are endocrine cells, while IPCs are artificially synthesized copies of endo-crine cells. The pores in the cytoplasmic membrane might be indicative of the exocytosis process through which the hormone is released into the extracellular space.
Simultaneously, we used AFM to compare the cell membrane particle size and Ra of the membrane surface before or after glucose stimulation of IPCs and beta cells. Our results revealed that both membrane particle size and Ra of beta cells were larger than those of IPCs. When both two groups of endocrine cells were stimulated by glucose,
the membrane particle size and Ra were higher than those not stimulated, except for IPCs that were stimulated for 30 min with low glucose concentration. The magnitude of cellular Ra, as well as the types, structure, and quantity of membrane protein molecules, directly influenced the inclines and declines of the membrane surface [23]. We speculated that the reason for the lower membrane par-ticle size and Ra in IPCs might be due to their lower membrane protein content. The cell membrane accom-plishes its biological function through membrane liquidity, and exocytosis is one of the functions that depend on membrane liquidity [24,25]. IPCs and beta cells secreted insulin through exocytosis. In the meantime, their plasma membranes were replenished via membrane liquidity. We inferred that the change in membrane liquidity might cause the increase in cell membrane particle size and Ra after glucose stimulation.
Beta cells secrete insulin through exocytosis. In beta cells, actin filaments form a dense network under plasma membrane. This actin network acts as a barricade, preventing passive diffusion of insulin follicles to the plasma membrane. Thus, the actin network ultimately lessens insulin secretion via reduction of exocytosis [26]. On the contrary, F-actin depolymerization can increase exocytosis, which increases insulin secretion. We proposed that the pores we observed that were located in the cyto-plasmic membrane were one of the characteristics of insu-lin exocytosis, and increased evidence of porous structures may be related to the enhancement of insulin exocytosis.
[image:6.595.61.538.90.283.2]To prove that exocytosis had been enhanced after glu-cose stimulation of IPCs and beta cells, we demonstrated that without glucose stimulation, the actin network
underneath the plasma membrane was continuous and dense. After glucose stimulation, the actin network de-polymerized and became discontinuous. After F-actin depolymerization, inhibition of exocytosis was relieved and insulin secretion increased. Interestingly, in the IPCs group, the cortical actin network did not depolymerize in low glucose concentrations after 30 min of stimulation. The actin network became discontinuous and depoly-merized only after low-glucose stimulation for 1 h.
Conclusions
In conclusion, our data proved that only normal human pancreatic beta cells could release insulin after low- and high-glucose stimulation for 30 min and 1 h. The cellular ultrastructure and function of IPCs resembled closely those of the normal human pancreatic beta cells. However, there is still so much diversity between the two groups of cells. These differences might provide a future research direction to figure out how to optimize differentiation into IPCs. In our study, we only tested the difference between one kind of IPC and normal human pancreatic beta cells. Therefore, our results are not enough to elucidate the re-lationship between cellular ultrastructure and function. In order to explore the relationship between cellular struc-ture and cell function, we need to study the links between cell function and more cell membrane proteins, as well as analyze various types of endocrine cells by looking for the common cellular surface ultrastructure.
Competing interests
The authors declare that they have no competing interests.
Authors' contributions
QPS and SML carried out the fabrication of samples and the AFM and LSCM measurements and drafted the manuscript. XHL carried out the
immunoassays. HYJ performed the molecular genetic studies and participated in the sequence alignment. JYC, LXZ, and LF initiated, planned, and controlled the research process. All authors read and approved the final manuscript.
Acknowledgments
This work was funded by the Guangdong Provincial Science and Technology Project of China (2010B031600105, 2011B031800066), granted from the Guangdong Provincial Medical Scientific Research Foundation (B2011161), and supported by the National Natural Science Foundation of China (973 program projects, 2010CB833603) and the Fundamental Research Funds for the Central Universities.
Author details
1The First Affiliated Hospital, Jinan University, Guangzhou 510632, China. 2Institute for Nano-Chemistry, Department of Chemistry, Jinan University, Guangzhou 510632, China.
Received: 31 January 2013 Accepted: 13 February 2013 Published: 19 February 2013
References
1. Venstrom JM, McBride MA, Rother KI, Hirshberg B, Orchard TJ, Harlan DM: Survival after pancreas transplantation in patients with diabetes and preserved kidney function.JAMA2003,290:2817–2823.
2. Campbell PM, Senior PA, Salam A, LaBranche K, Bigam DL, Kneteman NM, Imes S, Halpin A, Ryan EA, Shapiro AMJ:High risk of sensitization after failed islet transplantation.Am J Transplant2007,7:2311–2317. 3. Korsgren O, Nilsson B, Berne C, Felldin M, Foss A, Kallen R, Lundgren T,
Salmela K, Tibell A, Tufveson G:Current status of clinical islet transplantation.Transplantation2005,79:1289–1293.
4. Ryan EA, Lakey JR, Rajotte RV, Korbutt GS, Kim T, Imes S, Rabinovitch A, Elliott JF, Bigam D, Kneteman NM, Warnock GL, Larsen I, Shapiro AJ:Clinical outcomes and insulin secretion after islet transplantation with the Edmonton protocol.Diabetes2001,50:710–719.
5. Porat S, Dor Y:New sources of pancreatic beta-cells.Curr Diab Rep2007, 7:304–308.
6. Rolletschek A, Kania G, Wobus AM:Generation of pancreatic insulin-producing cells from embryonic stem cells—“proof of principle”, but questions still unanswered.Diabetologia2006,49:2541–2545. 7. Fujikawa T, Oh SH, Pi L, Hatch HM, Shupe T, Petersen BE:Teratoma
formation leads to failure of treatment for type I diabetes using embryonic stem cell derived insulin-producing cells.Am J Pathol2005, 166:1781–1791.
8. Kroon E, Martinson LA, Kadoya K, Bang AG, Kelly OG, Eliazer S, Young H, Richardson M, Smart NG, Cunningham J, Agulnick AD, D'Amour KA, Carpenter MK, Baetge EE:Pancreatic endoderm derived from human embryonic stem cells generates glucose-responsive insulin-secreting cells in vivo.Nat Biotechnol2008,26:443–452.
9. Fellous TG, Guppy NJ, Brittan M, Alison MR:Cellular pathways toβ-cell replacement.Diabetes Metab Res Rev2007,23:87–99.
10. Santana A, Ensenat-Waser R, Arribas MI, Reig JA, Roche E:Insulin-producing cells derived from stem cells: recent progress and future directions. J Cell Mol Med2006,10:866–883.
11. Bushell GR, Cahill C, Clarke FM, Gibson CT, Myhra S, Watson GS:Imaging and force-distance analysis of human fibroblasts in vitro by atomic force microscopy.Cytometry1999,36:254–264.
12. Domke J, Dannohl S, Parak WJ, Muller O, Aicher WK, Radmacher M: Substrate dependent differences in morphology and elasticity of living osteoblasts investigated by atomic force microscopy.Colloids Surf B Biointerfaces2000,19:367–379.
13. Shi P, Luo S, Jin H, Cai J, Jia H, Feng L, Lu X:Insulin-producing cells from human adipose tissue-derived mesenchymal stem cells detected by atomic force microscope.Appl Microbiol Biotechnol2012,94:479–486. 14. Linscheid P, Seboek D, Nylen ES, Langer I, Schlatter M, Becker KL, Keller U,
Müller B:In vitro and in vivo calcitonin I gene expression in parenchymal cells: a novel product of human adipose tissue.Endocrinology2003, 144:5578–5584.
15. Timper K, Seboek D, Eberhardt M, Linscheid P, Christ-Crain M, Keller U, Müller B, Zulewski H:Human adipose tissue-derived mesenchymal stem cells differentiate into insulin, somatostatin, and glucagon expressing cells.Biochem Biophys Res Commun2006,341:1135–1140.
16. Wozniak MJ, Kawazoe N, Tateishi T, Chen GP:Monitoring of mechanical properties of serially passaged bovine articular chondrocytes by atomic force microscopy.Micron2009,40:870–875.
17. Cross SE, Jin YS, Tondre WR, Wong R, Rao JY, Gimzewski JK:AFM based analysis of human metastatic cancer cells.Nanotechnology2008,19:384003. 18. Azeloglu EU, Bhattacharya J, Costa KD:Atomic force microscope
elastography reveals phenotypic differences in alveolar cell stiffness. J Appl Physiol2008,105:652–661.
19. Parpura V, Haydon PG, Henderson E:Three-dimensional imaging of living neurons and glia with the atomic force microscope.J Cell Sci1993, 104:427–432.
20. Luo S, Shi Q, Zha Z, Ping Y, Lin H, Liu N, Wu H, Jin H, Cai JY:Morphology and mechanics of chondroid cells from human adipose-derived Stem cells detected by atomic force microscopy.Mol Cell Biochem2012, 365:223–231.
21. Wang M, Ruan YX, Chen Q, Li SP, Wang QL, Cai JY:Curcumin induced HepG2 cell apoptosis-associated mitochondrial membrane potential and intracellular free Ca2+ concentration.Eur J Pharmacol2011,650:41–47. 22. Kim KS, Cho CH, Park EK, Jung MH, Yoon KS, Park HK:AFM-detected
apoptotic changes in morphology and biophysical property caused by paclitaxel in Ishikawa and HeLa cells.PLoS One2012,7:e30066. 23. Brammer KS, Oh S, Cobb CJ, Bjursten LM, van der Heyde H, Jin S:Improved
24. Kubina M, Lanza F, Cazenave JP, Laustriat G, Kuhry JG:Parallel investigation of exocytosis kinetics and membrane fluidity changes in human platelets with the fluorescent probe, trimethylammonio-diphenylhexatriene.Biochim Biophys Acta1987,901:138–146. 25. Hirano K:Change in membrane fluidity of sand dollar egg cortices
caused by Ca2+-induced exocytosis: microscopic analysis with fluorescence anisotropy.Dev Growth Differ1991,33(5):451–458. 26. Olofsson CS, Håkansson J, Salehi A, Bengtsson M, Galvanovskis J, Partridge
C, SörhedeWinzell M, Xian X, Eliasson L, Lundquist I, Semb H, Rorsman P: Impaired insulin exocytosis in neural cell adhesion molecule−/−mice due to defective reorganization of the submembrane F-actin network. Endocrinology2009,150(7):3067–3075.
doi:10.1186/1556-276X-8-90
Cite this article as:Shiet al.:Insulin-producing cells could not mimic the physiological regulation of insulin secretion performed by pancreatic beta cells.Nanoscale Research Letters20138:90.
Submit your manuscript to a
journal and benefi t from:
7Convenient online submission 7Rigorous peer review
7Immediate publication on acceptance 7Open access: articles freely available online 7High visibility within the fi eld
7Retaining the copyright to your article