ISSN: 1992-8645 www.jatit.org E-ISSN: 1817-3195
ON-LINE PORTFOLIO SELECTION VIA MEAN REVERSION
STRATEGY
1, 2 LI GAO, 1 WEIGUO ZHANG
1School of Business Administration, south China University of Technology, Guangzhou 510640,
China
2School of Science, South China University of Technology, Guangzhou 510640, China
ABSTRACT
This paper presents a novel adaptive algorithm using mean reversion strategy without transaction cost. The antiocr algorithm only exploits the property of “reversal to the mean” and its performance not only significantly depends on the size of window but also fluctuates wildly according to the different size of window. To overcome these limitations, this proposed algorithm is designed to deal with the portfolio selection problem by fully exploiting both the price momentum and the price reversal in Chinese stock markets. Equipped with several parameters, the proposed mean reversion strategy can better track the changing stock market. Extensive experiments on real stock data from Chinese markets demonstrate the effectiveness of our strategies in comparison with the anticor algorithm without knowledge of the investment duration.
Keywords: Online Portfolio, Universal, Mean Reversion, Momentum, Reversal
1. INTRODUCTION
Portfolio selection (PS) problem, which has recently attracted increasing interests in machine, online algorithms and computational finance, is a practical financial engineering problem to seek the best allocation of wealth among several stocks in the long run by maximizing cumulative wealth or risk-adjusted return. In this article, we investigate
sequential portfolio selection (also termed on-line
portfolio selection) strategies, which sequentially
determine portfolios based on past price of stocks [1].
Classical approaches for portfolio selection have been based on the assumption of knowing probability distribution of the stocks. In addition, risk references of investors also play an important role in portfolio optimization. Different ways to model these reactors result in different approaches in traditional portfolio optimization, such as the mean-variance analysis pioneered by Markowitz [2].
Markowitz’s model concerns distributional
assumptions about the behavior of stock prices and depends on some objective function and/or utility function defined according to the investor’s goal. This conceptual model has proved in the past to be useful by finance practitioners, private investors and researchers. However, this approach about
distributional assumptions encounters many
difficulties because the future evolution of stock prices is notoriously difficult to predict, while the
selection of a distribution class inevitably brings a measure of arbitrariness.
Cover [3] has proposed a different approach to overcome the problems related to the necessity of making statistical assumptions about the stock prices behavior, which is completely based on their past. Within Cover’s investment framework, portfolio selection is based completely on the sequence of past prices, which is taken as is, with little, if any, statistical processing. To emphasize this independence from statistical assumptions, such portfolios are called universal portfolios [3-9]. The optimal growth rate of wealth is achieved by a best constant rebalanced portfolio (BCRP) that is an asset allocation algorithm which keeps the same distribution of wealth among a set of stocks from period to period. Later, this problem has also been actively studied from a learning to select portfolio perspective, with roots in the fields of machine learning, data mining, information theory and statistics.
In contrast to universal portfolios which have focused on finding a good portfolio vector that it is fixed, switching algorithms have provided instead an investment regime that switches form one weight vector to another with the market changing, according to a prior distribution [10-14].
Due to the sequential nature, recent on-line
portfolio selection techniques often design
ISSN: 1992-8645 www.jatit.org E-ISSN: 1817-3195
15]. Borodin et al. [15] present the anticor algorithm to exploit the statistical information from the historical stock price relatives and adopt the classical mean reversion trading idea. The underlying motivation is to bet on the consistency of positive lagged cross-correlation and negative autocorrelation. However, the anticor algorithm cannot fully exploit the potential of price fluctuation in stock markets. On the other hand, the anticor algorithm is parameterized by the window size, which significantly affects the algorithm’s performance. Obviously, the size of window cannot be chosen at the beginning of the trading period; thus, it is very difficult or impossible to choose a suitable size of the time window for investors. By compounding the algorithm, Borodin et al. [15] smooth the parameter. But unfortunately, it brings about large scale computation. So it is difficult to apply for the anticoralgorithm in practice.
Over the last ten years, an extensive body of recent behavioral finance literature has documented the major findings, which seem to be diametrically opposed, that the price momentum and reversals coexist in Chinese stock markets in short term, which means that investors can make abnormal returns from these momentum strategies or contrarian strategies1. Under the contrarian strategy, past losers are bought and past winners are shorted or sold. Under the momentum strategy, past winners are bought and past losers are shorted or sold.
To overcome the limitations in anticor algorithm and achieve more wealth, we present a new approach for online portfolio selection, named “ant-colony algorithm”. The basic idea is to capture the property that the price momentum and reversals coexist in Chinese stock markets in short term. The ant-colony algorithm is not only simple in nature, but also has a reasonable update and is empirically validated via extensive experiments on real markets. The experiments show that the ant-colony algorithm can achieve better performance (in terms of cumulative wealth) than the anticor algorithm, and more importantly, would hardly be affected by the window size.
1 Consistent use of terminology suggests that a
process of mean reversion leads to profitable contrarian investment strategies; and a process of continuation leads to profitable momentum investment strategies. We prefer, however, the more common use of the term momentum to indicate both the process and the strategy)
The remainder of this paper is organized as follows. Section 2 describes formally defines the problem of on-line portfolio selection. Section 3 reviews related work and highlights their limitations Section 4 presents the methodology employed in this paper. Section 5 discusses data sources and presents the results of a set of numerical experiments. Section 6 concludes the study.
2. PROBLEMSETTING
One framework for studying sequential investment strategies consists of the following market model and investment. We model the market as a sequence of price relative vectors xt =( (1),xt xt(2),,x mt( )), ,
m t
x ∈R+
1, 2,
, ,
t
=
n
where mR+ is the positive orthant. The
th
i entry x i( )
t of a price relative vector xt
represents the ratio of closing to opening price for the
t
th trading day.An investment on the
t
th period is specified by a portfolio vector bt =( (1), (2),bt bt , ( )),b mt where( )
b it represents to the portion of the wealth
invested in the stock x jt( ) at day t. Typically, we
assume the portfolio is self-financed and no margin/short is allowed, therefore each entry of a portfolio is non-negative and adds up to one, that is,
t m
b∈ ∆ , where
1
{ m, m ( ) 1}
m bt R+ i=b it
∆ = ∈
∑
= . Theinvestment procedure is represented by a portfolio
strategy, that is, b1 11
m
= and following sequence of
mappings ( 1)
:
t
m t m
b R+ − → ∆ , t=2,3,..., ,n where
1
( t )
t t
b =b x− is the th
t portfolio given past market
sequence xt 1 ( ,x x1 2, ,xt 1)
−
−
= .We denote by
1 2
( , , , )
n
n
b = b b b the strategy for nperiods.
On the tth period, a portfolio bt produces a portfolio period return St , that is, the wealth
increases by a factor of
1 ( ) ( )
m T
t t t i t t
S =b ⋅ =x
∑
=b i x i .Since we reinvest and adopt price relative, the portfolio wealth would multiplicatively grow. Thus, after n periods, a portfolio strategy bn produces a portfolio cumulative wealth ofSn, which increases
the initial wealth by a factor of
1
n T t t t=b ⋅x
∏
, that is0 1
( n, n) n T
n t t t
ISSN: 1992-8645 www.jatit.org E-ISSN: 1817-3195
where S0is set to RMB 1 for convenience.
Finally, let us formulate the online portfolio selection problem. In this task, a portfolio manager is a decision maker, whose goal is to produce a portfolio strategy bn , aiming to maximize the
cumulative wealth Sn . He/she computes the
portfolios sequentially. On each period t, the manager has access to the sequence of previous price relative vectors xt−1 . On the basis of this historical information, he/she computes a new portfolio bt for next price relative vectorxt, where
the decision criterion varies among different managers. The portfolio bt is scored based on portfolio period return St . Note that without historical information, the initial portfolio is set to uniform. The resulting portfolio is evaluated by its portfolio daily return. This procedure is repeated until the end, and the portfolio strategy is finally scored according to portfolio cumulative wealthSn. The step of on-line portfolio selection algorithm:
● Initialize S0 =1, bt (1 1, , ,1)
m m m
=
● foreach trading day t=1, 2,,ndo (1) Portfolio manager learns the portfolio bt
based on historical information
(2) Market reveals the market price relative xt
(3) Portfolio incurs a portfolio daily return
T
t t
s =b x
For a given trading day t, consider the most recent past w trading days, where w (the window) is some integer parameter.
We define
1 [log( 2 1),...log( )]
T
t w t w
LX = x− + x−
2 [log( 1),..., log( )]
T
t w t
LX = x− + x
where log(xk) denotes log(xk(1),xk(2),... ( ))x mk .
Set 1
wt= −[t 2w+1,t−w] and
2
wt = − +[t w 1, ]t be
two consecutive windows, We denote the jth
column of LXk by LXk(j). Moreover, let
( (1),..., ( ))
k k k m
µ
=µ
µ
be the vectors of averages ofcolumns of LXk and let sk =(sk(1),...,sk( ))m be
the vector of standard deviations of columns of LXk.
In the above portfolio selection model, we make several general assumptions as follows.
1. Transaction cost: we assume no transaction cost or taxes exist in this portfolio selection model;
2. Market liquidity: we assume that one can buy and sell required quantities at last closing price of any given trading period;
3. Impact cost: we assume that market behavior is not affected by a portfolio selection strategy in our study.
3. THE ANTICOR ALGORITHM
The Anticor algorithm [15] evaluates changes in stocks’ performance by dividing the sequence of previous trading days into equal-sized periods called windows, each with a length of w days. w is an adjustable parameter called the window size. The Anticor algorithm is based on a “ mean reversion” assumption: both a stock’s high and low prices are temporary and that a stock’s price will tend to move to the average price over time, namely, stock growth rates are stable in the long term and occasional larger return rates will be followed by smaller rates (and vice versa).
Specifically, whenever the algorithm [15] detects that (i) a stock i outperformed a stock j during the last window, but (ii) i’s performance in the last window is anti-correlated to j’s performance in the second-to-last window, then it transfers wealth from i to j.
For a given trading day, the growth rate of any stock i during a window of time is measured by the product of relative prices during this window. The cross-correlation matrix (and its normalization) between column vectors in LX1 and LX2 are
defined as
cov 1 1 2 2
1
( , ) ( ( ) ( )) ( ( ) ( ))
1
(1)
T T
M i j LX i i LX j j
w µ µ
= − −
−
otherwise cov
1 1
1 2
( , )
( ), ( ) 0
( ) ( )
( , ) (2)
0
cor
M i j
i j i j
M i j s s s s
≠
=
where Mcor( , )i j ∈ −[ 1,1] measures the correlation between log-relative prices of stock i over the first
window and stock j over the second window.
Moreover, if
µ
2( )i ≥µ
2( )j andMcor( , )i j >0, then A. Borodin et al. set( , ) ( , ) ( , ) (3)
i j cor cor cor
claim→ =M i j +M − i i +M − j j
1( ) (4)
i j t i j j i j
transfer→ =b− i claim⋅ →
∑
claim→where Mcor ( , ) max{ Mcor( , ), 0}
− ⋅ ⋅ = − ⋅ ⋅
ISSN: 1992-8645 www.jatit.org E-ISSN: 1817-3195
(4). Finally, the update rule for the antior algorithm is
1( ) ˆ( ) ( ) (5)
t t j i j i i j
b+ i =b i +
∑
≠ transfer→ −transfer→The anticor algorithm exploits the statistical information from the historical stock price relatives and adopts the classical mean reversion trading idea to transfer the wealth in the portfolio. Although it does not provide any theoretical guarantee, these empirical results in [15] show that this algorithm can “beat the market” and moreover, can beat the best stock in the market. However, the performance of the anticor algorithm significantly depends on the size of window and fluctuates wildly according to the different size of window. In fact, the size of window cannot be chosen in advance. Thus, it is very difficult or impossible to choose a suitable size of the time window for investors. By compounding the algorithm, Borodin et al. [15] smooth the parameter. But unfortunately, this method brings about large scale computation. So it is difficult to
apply for the anticor algorithm in practice,
especially for multiple stocks in the long term.
4. THE ANT-COLONY ALGORITHM
4.1 Motivation And Overview
The anticor algorithm exploiting the mean reversion property can achieve good results on most datasets at the time and may better fit the markets. However, they rely on the assumption of price path. Though it is empirically effective on most datasets, the anticor algorithm causes three potential problems. Firstly, the performance of the anticor algorithm changes dramatically along with the changing of the window size. Second, it cannot fully exploit the potential of mean reversion in the real world. Finally, in the short term, the strategy fails when it merely adopt the philosophy of the mean reversion, but does not the price momentum. Thus, these three problems in the anticor algorithm call for a more powerful approach to effectively exploit the price fluctuation.
Momentum has received substantial attention in the finance literature since firstly discovered by Jegadeesh and Titman [17]. Many later studies have confirmed the existence and stability of momentum profitability in most developed markets. In a comprehensive investigation, Conrad and Kaul [18] find both momentum and contrarian profits in the U.S. market, depending on the time horizon investigated. Specifically, the contrarian strategy is profitable for short-term (weekly, monthly) and
long-term (2-5 years, or longer) intervals, while the momentum strategy is profitable for medium-term (3-12-month) holding periods. Kang et al. [19] find statistically significant short-term reversal and intermediate-term momentum profits in Chinese stock markets over the period 1993-2000. Balvers and Wu [20] demonstrate that mean reversion and momentum can simultaneously occur to the same set of assets in 18 developed countries. They also report momentum persists longer than previously found in isolation and mean reversion takes place quicker. Lu et.al [21] find that there exist an ultra-short-term momentum and a ultra-short-term reversal besides the intermediate-term momentum and the long-term reversal in Chinese stock markets. Pan et.al. [22] find economically significant momentum profits in weekly returns in Chinese A-share market and generate robust momentum profit in weekly returns using return interval ranking strategy. They argue that the weekly momentum lasts for about 1 year and more than half of the profit is realized in the first 3 weeks. Yan et al. [23] report that the portfolio with the formation period of 1 week and the holding period of 1~3 weeks demonstrates significant momentum effect, the portfolio with the formation period beyond 1 week and the holding period over 3 weeks begins to display return reversal effect, and the portfolio with formation period and holding period extend to 12~26 weeks shows no remarkable momentum effect. Pan et al. [24] find the ultra-term momentum, the short-term mean reversion exist in Chinese stock markets. In summary, ultra-short-term momentum, the short-term price momentum and reversals coexist in Chinese stock markets. In this paper, we adopt the properties of not only the price reversal but also the price momentum in the ultra-short term and the short term.
To investigate the price fluctuation in stock markets, we sort each pair of stocks into two categories based on the past ultra-term, short-term price changing (from day t−2w+1 to dayt−1): price reversal path and price momentum path. Price reversal path is presented in paper [15], and price momentum path is introduced in this paper to exhibit price continuation during these two windows. We will apply the contrarian strategy to both price paths at dayt+1.
4.2 Motivation And Overview
ISSN: 1992-8645 www.jatit.org E-ISSN: 1817-3195
of stock will take place for all price paths at the next period. So, we will take the contrarian strategy at dayt+1. Secondly, we introduce the parameters
1 1
, [0,1), , ( 1, 0]
α β
∈α β
∈ − to describe the strengthof this correlation as well as the strength of the “self-anti-correlations”. If
µ
2( )i ≥µ
2( )j and( , )
cor
M i j >α (price reversal path), then we improve the formulation (3) as follows,
1 1
, ,
( , ) ( , ) ( , )
(6)
i j cor cor cor
claim→ =M i j +M α− i i +M α− j j
where
1
1 ,
( , ) ( , )
( , )
0 else
cor cor
cor
M M
M α
α
− ⋅ ⋅ = − ⋅ ⋅ ⋅ ⋅ <
For the price momentum path, we describe the algorithm as follows: if Mcor( , )i j <
β
andµ
2( )i ≥µ
2( )j , then the formulation (3) or (6) becomes,1 1
, ,
( , ) ( , ) ( , )
(7)
i j cor cor cor
claim→ =M i j +M β+ i i +M β+ j j
where
1
1 ,
( , ) ( , )
( , )
0 else
cor cor
cor
M M
M β
β
+ ⋅ ⋅ = ⋅ ⋅ ⋅ ⋅ >
.
Combining with equations (4) (5) (6) (7), we depict the ant-colony algorithm in table I.
5. SELECTION AND SIMULATION RESULTS
I
n this section, we present numerical experiments which illustrate the performance of the ant-algorithm. For each experiment, the data are obtained from Shanghai Stock Exchange (SHSE) and Shenzhen Stock Exchange (SZSE) in ChineseStock Markets and Accounting Research
Databse(2012), published by Wind Information Co., Ltd (Wind Info). We collect daily individual stock prices (adjusted in the usual manner for dividends) for all “A” share stocks traded at the SHSE and SZSE, which started on January 30, 1991 and ended on January 11, 2012 with 5,132 daily return observations. Those data in the first 3 months are excluded because it was not stable in this time when ‘‘A’’ shares began trading after the initial setup of the two exchanges2. In
2 There are two types of shares traded at the Chinese stock markets: ‘‘A’’ shares and ‘‘B’’ shares. ‘‘A’’ shares are quoted in
[image:5.612.320.557.150.471.2]this paper, we randomly pick four datasets to constitute four portfolios in the above data. Table II details the four experimental datasets.
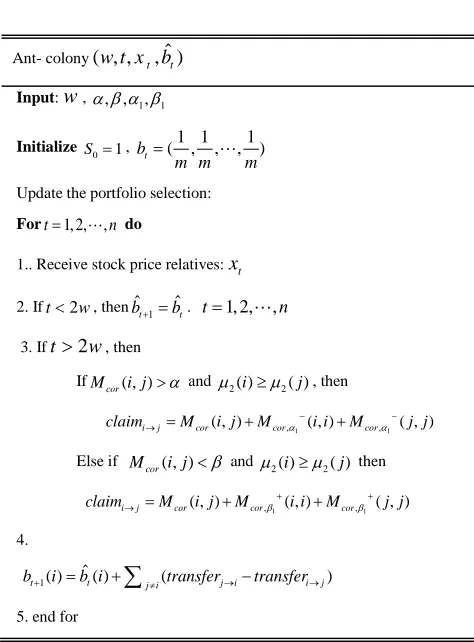
TABLE I: The Ant-Colony Algorithm
TABLE II: Summary Of 4 Real Datasets From Chinese Markets
Dataset Market Time frame #Days #Assets
SHSE (9)
SHSE July 26th 2000- Jan
11th 2012 2776 9
SHSE (18)
SHSE Nov 2nd 1999- Jan
11th 2012
2949 18
SZSE (10)
SZSE Dec 8th 1997- Jan
11th 2012
3410 10
SZSE (26)
SZSE Jan 19th 2001- Jan
11th 2012
2655 26
the domestic currency unit (RMB) and are traded only by domestic Chinese citizens, while ‘‘B’’ shares are quoted in US dollar terms and can be traded only by foreigners.
Ant- colony( , ,w t x bt, )ˆt
Input:w, α β α β, , 1, 1
InitializeS0=1, bt (1 1, , ,1)
m m m
=
Update the portfolio selection:
Fort=1, 2,,n do
1..Receive stock price relatives:xt
2. Ift<2w, thenbˆt+1=bˆt. t=1, 2,,n
3. Ift>2w, then
IfMcor( , )i j >α and µ2( )i ≥µ2( )j , then
1 1
, ,
claimi j Mcor( , )i j Mcorα ( , )i i Mcorα ( , ) j j
− −
→ = + +
Else if Mcor( , )i j <β and µ2( )i ≥µ2( )j then
1 1
, ,
claimi→j=Mcor( , )i j +Mcorβ+( , )i i +Mcorβ+( , ) j j
4.
bt+1( )i =b iˆt( )+
∑
j i≠(transferj→i−transferi→j) [image:5.612.313.528.526.653.2]ISSN: 1992-8645 www.jatit.org E-ISSN: 1817-3195
In our experiments, we implement the proposed ant-colony algorithm and the anticor algorithm with the window size w from 2 to 60. The experiment evaluates the cumulative wealth at the end of the
trading period during different windows,
respectively.
If 0<
α β
, 1<0.2, -0.2<α β
1, <0 , then thestrength of the correlation or the strength of the self-anti-correlation is too weak and further lead to obvious nonsense for the ant-colony algorithm. Hence, we set
α β
= 1=0.2, ,α β
1 = −0.2 for the ant-colony algorithm). We plot the wealth curve of cumulative wealth and compare the final wealth of cumulative wealth in the figure 1, where Antior represents the anticor algorithm, Ant-colony represents the ant-colony algorithm where colony algorithm whereα β
= 1=0.2, ,α β
1 = −0.2and Ant-Colony* represents the ant-colony algorithm where1 0, ,1 0
α β
= =α β
= . The x-axis represents thesize of the time windows within the coordinate and the y-axis represents the wealth achieved by these algorithms for an initial investment of RMB 1 within the logarithmic coordinate.
From the experimental results shown in Figure 1, we can draw several observations below. First of all, we observe that Ant-Colony* perform better than Antior on some periods and occasionally worse, which shows that Ant-Colony* is sensitive to the window size for portfolio selection, but on the other hand, validates the importance of exploiting the price momentum property in Chinese financial markets by an effective online learning strategy. Second, Colony performs better than Ant-Colony* and further better than Anticor (with a few point exceptions). Finally, the cumulative wealth achieved by Ant-Colony has little to do with the window size in the short term, which demonstrates that Ant-Colony doesn’t depend significantly on the window size. Moreover, this also shows that to achieve better investment return, it is more powerful and promising to not only exploit the price momentum and mean reversion property but also capture the strength of the correlation or self-anti-correlations for portfolio selection.
Theoretically, our proposed algorithm does not need to smooth the parameter by compounding, so it enjoys linear computational time complexity. Empirically, it takes the least times on all datasets. Such time efficiency supports its large-scale real applications.
(a) SHSE(9)
(b) SHSE(18)
(c) SZSE(10)
(d) SZSE(26)
0 20 40 60
0.1 1 10 100
T
ot
al
R
et
ur
n
Window Size(w) Anticor
Ant-colony Ant-colony*
0 20 40 60
1 10 100
T
ot
al
R
et
ur
n
Window Size(w) Anticor Ant-Conoly Ant-Conoly*
0 20 40 60
1 10 100
T
ot
al
R
et
ur
n
Window Size(w) Anticor Ant-conlony Ant-conlony*
0 20 40 60
1 10 100
T
ot
al
R
et
ur
n
Window Size(w) Anticor
Ant-colony Ant-colony*
ISSN: 1992-8645 www.jatit.org E-ISSN: 1817-3195
6. CLONCLUSION
In this paper, we propose a novel on-line portfolio selection strategy named “ant-colony algorithm”, which successfully applied machine learning techniques for on-line portfolio selection by exploiting the mean reversion property of the financial markets. Unlike the anticor algorithm using only price reversal, the ant-colony algorithm exploits both price reversal and price momentum in Chinese stock markets in the short term. Empirically the ant-colony algorithm surpasses the anticor technique from real markets. We also find the ant-colony algorithm is hardly affected by the size of window. Moreover, this proposed mean reversion strategies can better track the changing stock market
.
ACKNOWLEDGEMENTS
This work was supported by the Major Program of the National Social Science Foundation of China (Grant No.11&ZD156) and the General Project of Program of the National Natural Science Foundation of China (Grant No. 71171086).
REFRENCES:
[1] B.Li, P.Zhao, S.C.H. Hoi, “Passive aggressive mean reversion strategy for portfolio selection,” Machine Learning, Vol. 87, No. 2, 2012, pp.221–258
[2] M. H. Markowitz, “Portfolio selection”, Journal of Finance, Vol. 8, pp.77-91, 1952.
[3] T.M. Cover, “Universal portfolio”,
Mathematics Finance, Vol. 1, No. 1, 1991, pp.1-29.
[4] T.M. Cover, “Universal data compression and portfolio selection”, Proceedings of the 37th IEEE Symposium on Foundations of Computer Science, 1996, pp. 534-538.
[5] T.M. Cover, E. Ordentlich, “Universal
portfolios with side information”, IEEE Transactions on Information Theory, Vol. 42, No.2, 1996, pp. 348-363.
[6] E. Ordentlich, T. M. Cover, “The cost of achieving the best portfolio in hindsight”, Mathematics of operations research, Vol. 23, No.4, 1996, pp.960-982.
[7] A.Kalai, S.Vempala, “Efficient Algorithms for Universal Portfolios,” Jounal of Maching Learning research, Vol. 3, No. 3, 2003, pp. 423-440.
[8] G. Iyengar, “Universal investment in markets with transaction costs,” Mathematcal Finance, Vol. 15, No. 2, 2005, pp. 359–371.
[9] E. Fagiuoli, F. Stella, A. Ventura, “Constant rebalanced portfolios and side-information”, Quantitative Finance, Vol. 7, No. 2, 2007, pp.161–173.
[10] Y. Singer, “Switching portfolios”, Proceedings of the 14th Conference on Uncertainty in Artificial Intelligence, 1998, pp. 1498–1519.
[11]S. S. Kozat, A. C. Singer. “Universal constant rebalanced portfolios with switching”, Proceedings of the international conference on Acoustics, Speech and Signal Processing, 2007, pp. 1129–1132.
[12] S. S. Kozat, A. C. Singer, “Universal switching linear least squares prediction”, IEEE Transaction on Signal Processing, Vol. 56, No. 1, 2008, pp.189-204.
[13] S. S. Kozat, A. C. Singer, “Switching
strategies for sequential decision problems with multiplicative loss with application to portfolios,” IEEE Transactions on Signal Processing, Vol. 57, No. 6, 2009, pp. 2192-2208.
[14] S. S.Kozat, A. C. Singer, “Factor graph switching portfolios under transaction costs”, Proceedings of the international conference on Acoustics, Speech and Signal Processing, 2011, pp.5748-5751.
[15] A. Borodin, R. El-Yaniv, V. Gogan, “Can We Learn to Beat the Best Stock,” Journal of Artificial Intelligence Research, Vol.21, No. 1, 2004, pp. 579-594.
[16] W.F.M. DeBondt, R. Thaler, “Does the stock market overreact?”, Journal of Finance, Vol. 40, 1985, pp.793–805.
[17] N. Jegadeesh, S. Titman, “Returns to buying winners and selling losers: Implications for stock market efficiency”, Journal of Finance, Vol. 48, 1993, pp.65-91.
[18] J. Conrad, G. Kaul, “An anatomy of trading strategies”. Review of Financial studies, Vol. 11, 1998, pp. 489-519.
[19] J. Kang, M. H. Liu, S. X. Ni, “Contrarian and momentum strategies in the China stock market: 1993–2000”, Pacific-Basin Finance Journal, Vol.10, 2002, pp.243– 265.
[20] R. J. Balvers, Y. Wu, “Momentum and mean reversion across national equity markets”, Journal Empirical Finance, Vol.13, No. 1, 2006, pp.24-48.
ISSN: 1992-8645 www.jatit.org E-ISSN: 1817-3195
[22] L. Pan, Y. Tang, J. Xu, “Weekly momentum by return interval ranking”, Pacific-Basin Finance Journal(In Press), 2012.
[23] T. Yan, L. Liang, “Study on Momentum
Effect of Shanghai Stock Market: Based on Weekly Data During 1995–2009,” Technology Economics, Vol. 30, No. 5, 2011, pp. 109-114.
[24] L. Pan, J. Xu, “Price Continuation and