A DYNAMIC ON-DEMAND MULTIPATH ROUTING
ALGORITHM FOR LOW EARTH ORBIT SATELLITE
NETWORKS
1, 2
HOUTIAN WANG, 1, 2QI ZHANG, 1, 2XIANGJUN XIN, 1, 2YONGJUN WANG, 1, 2LIJIA ZHANG
1
School of Electronic Engineering, Beijing University of Posts and Telecommunications (BUPT), Beijing, 100876, China
2
State Key Lab of Information Photonics and Optical Communication (BUPT), Beijing, 100876, China
ABSTRACT
Compared with Geostationary Orbit (GEO) satellite systems and Medium Earth Orbit (MEO) satellite systems, Low Earth Orbit (LEO) satellite systems provide lower propagation delay as well as higher throughput. Because of these reasons, LEO satellite systems can play a pivotal role in providing services to areas where there is no substantial terrestrial infrastructure. In this paper, a novel kind of Dynamic On-demand Multipath Routing algorithm (DOMR) is proposed for LEO satellite networks. The performance of LEO satellite networks based on DOMR algorithm is simulated and analyzed. Moreover, the packet delivery ratio of LEO satellite networks when running DOMR and Dynamic Source Routing Algorithm for LEO Satellite Networks (DSR-LSN) is compared. The packet delivery ratio is about 6.39% higher when running DOMR. Simulation results show that on-demand multipath routing algorithm has a good performance in drop rate and the end-to-end delay of packet delivery.
Keywords: Low Earth Orbit, Satellite Networks, Dynamic On-demand Multipath Routing, Drop Rate,
Packet delivery radio
1. INTRODUCTION
The current trend toward the migration to all IP-based services opens new opportunities to Low Earth Orbit (LEO) satellite systems. LEO satellite networks have a feature of covering a wide range of area. And it can meet the requirements of high bandwidth and low end-to-end delay. So transmitting data via satellite link has attracted world-wide attention. How to design an efficient, reliable and flexible routing algorithm is a big challenge to the satellite networks.
Routing mechanism of satellite networks is divided into two categories, namely static routing mechanism and dynamic routing mechanism. The static routing algorithm [1] makes use of the periodicity and predictability of the LEO satellite networks and packets are sent according to the routing table pre-calculated, so this algorithm can keep complexity and signaling overhead to a low level. But sometimes the optimal path cannot be found because the static routing algorithm isn’t able to adapt the diversification of the inter-satellite links and network load. The dynamic routing algorithm [2-8] can adaptively update its path when network traffic or link delay changes, thus it can ensure the efficiency of packet forwarding.
On-demand routing is a reactive dynamic routing mechanism [9-13].In recent years, how to
implement on-demand routing protocol in the satellite networks is one of the hot topics in the fields of satellite communication. A location-assisted on-demand routing (LOAR) protocol for LEO satellite networks that employs inter-satellite link (ISL) has been proposed [11]. LOAR can be viewed as a variant of the ad-hoc on-demand distance vector (AODV) routing algorithm. Dynamic Source Routing algorithm in LEO satellite networks (DSR-LSN) is also proposed [9]. This algorithm adopts the strategy of constructing virtual nodes and uses the concept of restricted route request area to minimize the related overhead. But when the satellite network is congested, the performance of this algorithm descends.
2. THE PRINCIPLE OF DOMR ALGORITHM
DOMR algorithm consists of four processes. (1) Request area formation process, (2) Path discovery process, (3) Route reply process, (4) Data transmission process.
2.1 Request Area Formation Process
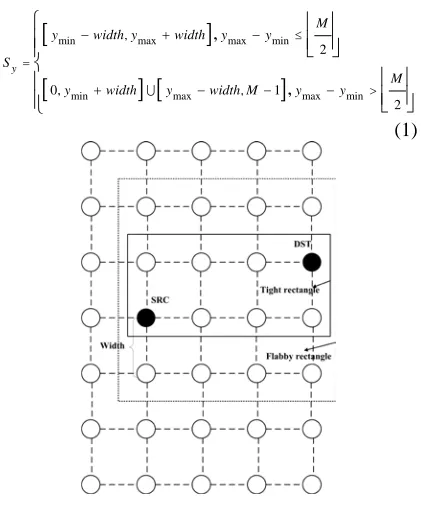
As is shown in Fig.1, LEO satellite networks can be modeled as a graph G (V, E). V is the set of satellite nodes and E is the set of inter-satellite links (ISLs). It is clear that the size of V is V =N×M, where N is the number of the orbital planes and M
is the number of satellites per plane. In this graph, each satellite is uniquely defined by the pair of virtual coordinates (x, y), where x and y denote the orbital plane and the position of the satellite in this plane respectively. Clearly, x∈[0,N),y∈[0,M). Assume that a ground terminal served by the jth satellite in the ith orbital plane (hereafter referred to as the source satellite with virtual coordinates xsrc=i
and ysrc=j) communicates with a ground terminal that is covered by the lth satellite in the kth orbital plane (hereafter referred to as the destination satellite with virtual coordinates xdst=k and ydst=l).
Sx and Sy are used to represent the sets of acceptable values for virtual coordinates of satellites in Request area. It is clear that Sx=[xmin,xmax] with
xmin=min[xsrc, xdst] and xmax=max[xsrc,xdst]. As far as
Sy is concerned, there are two alternatives for defining the rectangle area containing the source and destination satellites, that is,
[
]
[
]
[
]
min max max min
min max max min
,
,
2
0, 1
2
,
, y
M y width y width y y S
M y width y width M y y
≤
=
>
− + −
+ − − −
(1)
(a)
max min / 2
y −y ≤
M
[image:2.612.90.305.486.739.2](b) ymax −ymin >
M/ 2
Figure 1: Request Area Formation
When width=0, the rectangle is defined as tight rectangle and when width>0, the rectangle is defined as flabby rectangle, as is shown in Fig.1. Tight rectangle is used to find the shortest path and flabby rectangle is used to find the alternate path.
2.2 Path Discovery Process
Each satellite maintains a table ReqT where it stores information regarding route requests originated by other network nodes. The table contains one entry for each satellite in the network and each entry has the following fields.
reqt_orig - the address of the satellite that originated a route request. The existence of the entry implies that a request originated by node reqt_orig was received by the current satellite in the past.
reqt_seqnum - the last heard sequence number carried in a route request from satellite reqt_orig. Each route request is uniquely identified by the sequence number.
reqt_count - record the route request number originated by the same network node. We use this field to minimize the recording overhead brought by route request signaling.
reqt_time - record the time to receive one route request packet.
When an intermediate satellite receives a RREQ packet, it must decide whether to accept or not the RREQ packet. Such a packet is accepted in the following two cases.
(1) The field which uniquely identifies a RREQ packet is greater than the last known sequence number for the source satellite. (This number is stored in the corresponding entry of table ReqT).
(2) The table ReqT doesn’t store the address consistent with the field of RREQ packet which records the address of SRC.
In any other cases the RREQ is not acceptable and is suppressed. By using these criteria, DOMR avoids loops in the formation of the path and can make sure each port in the satellite receives only one RREQ packet.
If the RREQ is accepted by the intermediate satellite, the port number and the time to receive this packet is recorded. Then, the address of this satellite will be recorded in the RREQ packet. After finishing all these tasks, the intermediate satellite sends the RREQ packet to the neighboring satellite in the rectangle area.
2.3 Path Reply Process
MRREP denotes that route reply message contains information about the shortest path. ARREP denotes that route reply message contains information about the alternate path.
In DOMR, link-cost metric is calculated based on the ISL’s propagation delay. Then the first RREQ packet that arrives at the destination satellite has come through the minimum delay path. DST reads the shortest path information contained in RREQ and writes this information in the MRREP packet. When the satellite in the shortest path becomes congestion or fails, this path will be of no use. Therefore, ARREP packet is produced to generate an alternate path. In this section, the relationship between the alternate path’s availability and the number of the same satellites contained in the shortest path as well as the alternate path will be discussed.
Theorem. The utility of the alternate path
reduces as the number of the same satellites contained in the shortest path as well as the alternate path increases.
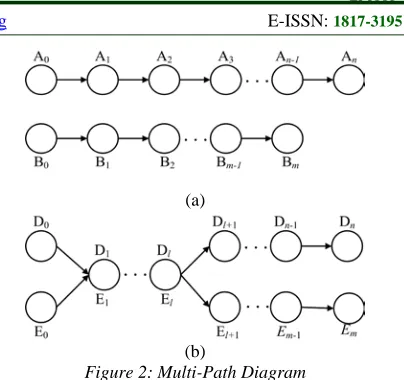
Proof. MP0 is a set of paths without same
satellite nodes, such as Path P(A0A1A2…An) and P(B0B1B2…Bm) in Fig. 2 (a). MPl is a set of paths with l same satellite nodes, such as Path P(D0D1D2…Dn) and P(E0E1E2…Em) in Fig. 2 (b).
(a)
(b)
Figure 2: Multi-Path Diagram
Define p as the congestion probability of one satellite in the network, and then the probability of path breaking p(Pbreak) is p(Pbreak)=1-(1-p)k, where k
is the number of satellites contained in one path. (1) In MP0, the probability of both paths becoming failure is given by
0 0 1 0 1
( [ [ (
[1 (1 ) ][1 (1 )
) ( ... )] ... )]
]
break n break n
n m
p MP p P A A A p P B B B
p p
− − − −
= =
(2) (2) In MPl, define
1 { 0 1} { l l1, l1 l2,..., n1 n}
l D D D D D D D D
P l l l l
+ + + −
→ → → →
= (3)
2 { 0 1} { l l1, l1 l2,..., n1 n}
l E E E E E E E E
P l l l l
+ + + −
→ → → →
= (4)
3 { ( )1 ( )2, ( )2 ( )3,..., ( )l1 ( )l} l D E D E D E D E D E D E
P l l l
−
→ → →
= (5)
0, 1,
i i
i l l
l
P is not available P
P is available
=
(6)
[image:3.612.320.522.71.261.2]The condition that both paths becoming failure is shown in Table. 1.
Table 1 : The Condition That Both Paths Becoming Failure
Pl1 Pl2 Pl3
0 0 1
0 1 1
1 0 1
1 1 1
1 1 0
1 2 3
1 2 3
1 2 3
1
( ) {1
1 {1 1 ( ) } ( ) ( ) { ( ) } ( ) ( ) ( ) } ( ) ( ) { ( ) }
l break break break
break break break
break break break
break break
l l l
l l l
l l l
l
p MP p P P p P P p P P
p P P p P P p P P
p P P p P P p P P
p P P p P
− − − − = + + + 2 3
1 2 1 3
1 (1 ) (1 ) (1 )
( ) ( )
{ ( ) } ( ) { ( ) }
break
break break break
m n n m l
l l
l l l
P p P P
p P P p P P p P P
p p p + −
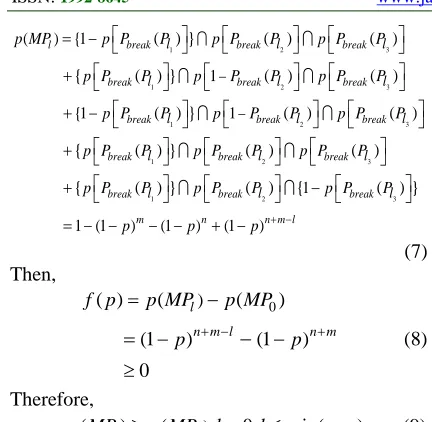
− − − − − − + = + (7) Then, 0 ) ( ) ( ( )
(1 ) (1 )
0
l
n m l n m
f p p MP p MP p + − p +
= −
− −
≥
= − (8)
Therefore,
p MP( l)≥ p MP( 0),l>0,l≤min( , )n m (9) From (9), it can be concluded that the utility of the alternate path reduces as the number of the same satellites contained in the shortest path as well as the alternate path increases.
In [1], LEO satellite network is modeled as a Finite State Automation (FSA) based on the observation that the orbit movement in LEO satellite networks is periodic. Since satellite networks run regularly in space, the running cycle is divided into s time intervals and the network topology for each time period is taken as static. During the period that two ground terminals communicate with each other, the end-to-end delay of the shortest pathTm delay− =[ ,T T1 2, ...,Ts]and the
end-to-end delay of the alternate path
' ' ' 1 2
[ , , ..., ]
a delay s
T− = T T T . Define a as the same satellites in the two paths. DOMR aims to minimize the value of a, while making the difference between transmission delays on the two paths as small as possible.
That is,
2
min
. . 0 11
0 11
m delay a delay
main alternate main alternate
T T a
s t l l l l − − − + ≤ ≤ ≤ ≤ ≤ (10)
Where 2is 2-norm, lmain stands for the number of satellites in the shortest path and lalternate stands for the number of satellites in the alternate path. One feature of the Iridium system is that the maximum number of hops between any two nodes in the network is 11. Let D be the number of hops between any two nodes in the satellite networks, thenD= +P S, where P is the horizontal hops of
this path and S is the vertical hops of this path. Because there exists cross-seam ISLs and the number of satellites per plane is 11, so P≤5,
6
S≤ .We can conclude that D≤11.
The principle of Route reply process is described in Fig.3. When the RREQ packet eventually reaches DST, DST has to decide on whether the RREQ packet is acceptable or not. If the RREQ packet is accepted by DST, the satellite will find the shortest path to the source satellite and produce a MRREP message.
In route reply process, the destination compares the time of four ports to receive the RREQ packet and chooses the sub-optimal port to send the ARREP packet.
When an intermediate satellite receives a route reply message, the following steps will be carried out.
If this satellite (for example satellite i in Fig.3) receives a MRREP packet, it will read this packet to find out which satellite is the next hop and mark the port of receiving this packet as primary.
If this satellite receives an ARREP packet and has never received MRREP before (for example satellite j in Fig.3), it will read ARREP to decide whether to accept it or not. If the address of this satellite has already been recorded in ARREP, then the ARREP packet is not acceptable and is suppressed. In other cases, the intermediate satellite will compare the time of four ports to receive the RREQ packet and choose the optimal port to forward the ARREP packet.
[image:4.612.85.301.83.294.2] If this satellite receives an ARREP packet and has received MRREP before (for example, satellite k in Fig.3), it will read ARREP to decide whether to accept it or not. If this ARREP packet is accepted, the intermediate satellite will compare the time of four ports to receive the RREQ packet and choose the sub-optimal port to forward the ARREP packet.
2.4 Data Transmission Process
When the MRREP and ARREP finally reach the source satellite, SRC will read the Data field of these two packets and store the path information into route cache. In this way, SRC can establish the shortest path and the alternate path. When transmitting data packets, SRC will first use the shortest path. Once this path becomes useless, SRC will enable the alternate path.
3. SIMULATION RESULTS
In this section, the end-to-end delay of DOMR and the performance of the alternative path are studied. The system we use is Iridium system. The simulation tool OPNET has been adopted for developing a satellite simulator and testing the performance of the proposed algorithms. OPNET simulator has three logical levels: Network Level (a LEO satellite system has been considered, together with Satellite Terminals), Node Level (consisting of all the algorithms of the protocol stack), and Process Level (Finite State Machine (FSM) developed in C that implement the proposed algorithms and the associated protocols).
[image:5.612.309.527.77.241.2]Table.2 tabulates the parameters of this traffic bursts. According to Table.2, the chosen bit rates produce average (over both On and Off periods) bit rate values that is about 60~160Kb/s per earth station, which can be considered reasonable for a real-life scenario.
Table 2: Traffic Generator’s Parameters
Packet size 1500 bytes
“On” period 0.2s
“Off” period 0.8s
Bit rate during “On” period 60~160kb/s
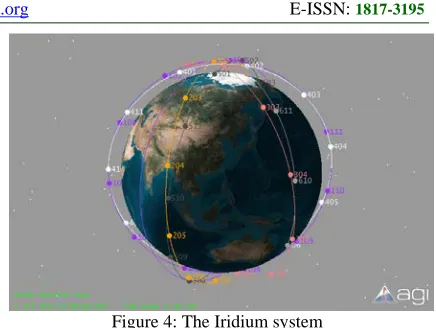
The Iridium system is shown in Fig.4. As is shown in Fig. 4, the number of orbits is 6, the number of satellites per plane is 11 and satellite altitude is 780Km.
The simulation model is shown in Fig.5. There are two intra-plane ISLs (namely, links to the adjacent satellites in the same orbital plane) and two inter-plane ISLs (that is, links to the neighboring satellites in the right-hand and left-hand orbital planes).While intra-plane ISLs are maintained for the whole satellite period, inter-plane ISLs are broken as satellites come close to the poles due to adverse pointing and tracking conditions, when satellites move to lower latitudes, inter-plane ISLs are reestablished. Moreover, cross-seam ISLs, namely links between satellites in counter-rotating orbits, are not used.
Figure 4: The Iridium system
3.1 The end-to-end Delay Performance
In this subsection, data packets are sent from the region (15N, 30E) to the region ( 30S, 45W). The Iridium period is about 90min, so the simulation time is taken as 5400s.
[image:5.612.317.513.374.656.2]Fig.6 shows the number of hops versus the simulation time. It becomes evident from this figure that the number of hops changes over time, because the satellite network topology is not fixed. Table.3 shows the ratio of different number of hops.
Figure 5: The LEO satellite networks
Figure 6: The Average Number Of Hops Versus The Simulation Time
[image:5.612.84.304.480.527.2]between two satellites in the same orbit is about 13.47ms and the transmission delay between two satellites in different orbit is about 11.58 cos× jms, where j is the latitude of the satellite.
Table 3 : The Ratio Of Different Number Of Hops
Hops Ratio
5 5.01%
6 50.18%
7 20.16%
8 17.21%
9 7.44%
Fig.7 depicts the initial path. As is shown in Fig.7, l11→21 and l21→31 are inter-plane ISLs,
31 32
l → and l32→33are intra-plane ISLs. By using the
data provided in Ref. [9], we can calculate that the minimum routing delay is 36.14ms and the maximum routing delay is 62.72ms. In this scenario, data is transmitted between two satellites in different orbits when these two satellites are located in low latitude area. As a result, the initial transmission delay is about 60ms.
Figure 7: The Schematic Diagram Of The Initial Path
According to the statistics of Table.3, the end-to-end delay of the satellite network is about 64.82ms. Fig.8 depicts the end-to-end delay versus the simulation time. As is shown in Fig.8, the mean end-to-end delay of the satellite network is between 60ms and 70ms, it can be concluded that the simulation result is consistent with the theoretical calculation.
[image:6.612.84.297.173.243.2]
Figure 8: The End-To-End Delay Of The Network
In this subsection, the end-to-end delay of the satellite network has also been studied when the number of hops between SRC and DST is maximum.
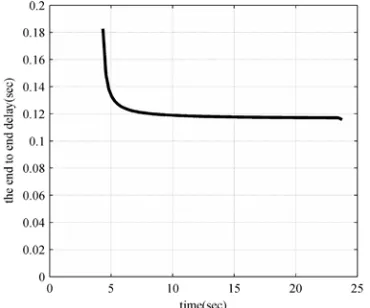
In the simulation model, when data packets are sent from the satellite 101 in Fig.4 to the satellite 606 in Fig.4, the number of hops is 11. Because the number of hops between SRC and DST is not fixed due to unstable topology of LEO satellite network, the setting value of simulation time is 25s. In this simulation time, the data packet from the ground terminal is routed from satellite 101 to satellite 606. The end-to-end delay of the network with 11 hops is shown in Fig.9. From Fig.9, it can be seen the average end-to-end delay converges to 120ms. This fact proves that DOMR meets the need of real-time service which requires the end-to-end delay is less than 400ms.
Figure 9: The End-To-End Delay When The Number Of Hops Is 11
3.2 The Performance of Alternate Path
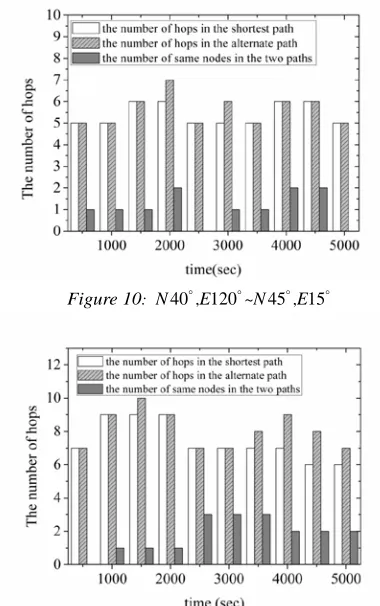
[image:6.612.130.252.381.550.2] [image:6.612.322.507.477.631.2]In each scene, the location of the source user terminal and the destination user terminal is iconic and both user terminals are distributed according to the hot spot scenario described in Ref. [14]. We add up the hops as well as the number of same satellites contained in the shortest path and the alternate path. Fig.10, Fig.11, Fig.12 and Fig.13 show the simulation results.
In section 2, we calculate that the probability of the shortest path and the alternate path becoming failure simultaneously is 1-(1-p)m-(1-p)n+(1-p)n+m-l, which includes the case that one satellite in the shortest path and another satellite in the alternate path become failure at the same time and the probability is very small. Only if the satellite is one intersection of the two paths and become failure, the unavailability of the shortest path will also make alternate path become useless. Therefore, the probability of alternate path becoming failure which is due to the failure of the shortest path (Pbreak) can be calculated by formula i/n, where i is the number of intersections of the two paths and n
[image:7.612.308.527.330.485.2]is the total number of nodes in the two paths (we assume that the probability of every satellite in the network becoming failure or congested is the same). Table.4 shows the maximum value of Pbreak in the above four cases.
Figure 10: N40,E120~N45,E15
Figure 11: N40 W100, ~N40,E120
Figure 12: N45 E15 ~S15 W50, ,
It can be calculated from Table.4 that the average maximum value of Pbreak is about 20.75%. And when the shortest path becomes failure, the probability that we can make use of the alternate path is about 79.25%.
[image:7.612.94.284.414.717.2]Figure 13: N40 W100, ~S15 W50,
Table 4 : The Maximum Value Of Pbreak
the maximum value of Pbreak
40 , 120 ~ 45 , 15
N E N E 16%
40 ,W100 ~ 40 , 120
N N E 21%
45 ,E15 ~S15 ,W50
N 25%
40 ,W100 ~S15 ,W50
N 21%
In this subsection, the performance of DOMR and DSR-LSN is also compared when a satellite in the shortest path is unavailable. The reason we choose DSR-LSN is that DSR-LSN consists of such main mechanisms as path discovery process and path reply process, which is similar to DOMR and it is also designed for LEO satellite networks. Fig.14 shows the throughput of the ground terminal that receives data packets.
[image:7.612.310.528.510.596.2]throughput of the ground terminal that receives data packets is the same when we run DOMR and DSR-LSN. After the network congests, the packet drop rate is lower when running DOMR. As time goes by, the packet drop rate tends to be the same for both algorithms. The reason is that the shortest path from SRC to DST is not fixed due to the instability of the satellite network.
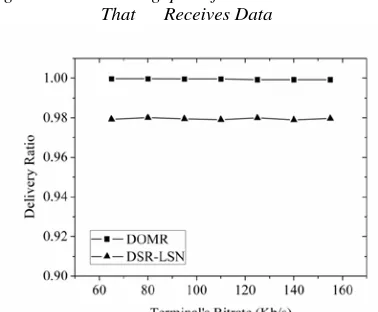
[image:8.612.108.295.296.429.2]Fig.15 presents the delivery ratio versus the terminal’s bit rate and Table.5 provides a tabulation of the delivery ratio for the DOMR and DSR-LSN. When the satellite networks become congested, DOMR appears to be immune to such a decrease. Furthermore, it can be concluded from Table.5 that the packet delivery ratio is about 6.39% higher when running DOMR.
[image:8.612.101.290.441.597.2]Figure 14: The Throughput Of The Ground Terminal That Receives Data
[image:8.612.94.294.638.739.2]Figure 15: Delivery Ratio Versus Terminal’s Bit Rate
Table 5 : The delivery ratio for the DOMR and DSR-LSN
DOMR DSR-LSN
65(Kb/s) 0.9997 0.9793
80(Kb/s) 0.9997 0.9801
95(Kb/s) 0.9996 0.9795
110(Kb/s) 0.9997 0.9791
125(Kb/s) 0.9996 0.9800
140(Kb/s) 0.9992 0.9790
155(Kb/s) 0.9992 0.9797
4. CONCLUSIONS
In this work, we evaluated the performance of a dynamic on-demand multipath routing algorithm (DOMR) for LEO satellite networks. In order to diminish the signaling overhead induced in the system, DOMR utilizes a route request area that aims to reduce the number of satellites in the path discovery process. According to DOMR, the shortest path discovery procedure is invoked independently for each individual communication request to provide estimation of the network. Furthermore, DOMR proposes a method to store the information on alternate paths in satellite networks. The good characteristic of the DOMR algorithm is that even if the number of hops between the source satellite and the destination satellite is maximum, the average end-to-end delay meets the need of real-time communication. The proposed algorithm was compared to DSR-LSN and the effect of DOMR in avoiding congested points is better than DSR-LSN. This fact renders it an excellent method to improve the robustness of the satellite networks.
ACKNOWLEDGEMENTS
This work was supported by the National Natural Science Foundation of China (No.60977002) and the Fundamental Research Funds for the Central Universities (No. 2011PTB-00-32)
REFERENCES:
[1]. H.S.Chang, B.W.Kim, C.G.Lee, S.L.Min, Y.Choi, H.S.Yang, D.N.Kim, and C.S.Kim, “FSA-based link assignment and routing in low-earth orbit satellite networks”, IEEE Transactions on vehicular technology, Vol. 47, No. 5, 1998, pp. 1037-1048.
[2]. Zhian Yang, Fei Long, Fuchun Sun and Dianjun Wang, “A dynamic QoS routing mechanism based on Steiner trees for LEO satellite networks”, International Conference on Networking, Sensing and Control (ICNSC), 2010, pp. 153-158.
[3]. T.Taleb, N.Kato, and Y.Nemoto, “Recent trends in IP/NGEO satellite communication systems: transport, routing, and mobility management concerns”, IEEE Wireless Communications, Vol. 12, 2005, pp. 63-69.
satellite constellations”, Global Telecommunications Conference, November,
2006, pp. 1-5.
[5]. M.Werner, “A Dynamic Routing Concept for ATM-Based Satellite Personal Communication Networks”, IEEE Journal on Selected Areas in Communications, Vol. 15, No. 8, 1997, pp. 1636-1648.
[6]. T.Taleb, A.Jamalipour, N.Kato and Y.Nemoto, “IP traffic load distribution in NGEO broadband satellite networks”, Lecture Notes in Computer Science 2006, 2006, pp. 113-123.
[7]. Korcak Ö, Alagöz F, “Priority-based adaptive shortest path routing in IP over LEO satellite
networks”, 23rd AIAA international
Communication Satellite Systems Conference (ICSSC’05), Rome, Italy, September 2005, pp. 1-9
[8]. Jianjun Bai, Xicheng Lu, Zexin Lu and Peng Wei, “Compact explicit multi-path routing for low earth orbit satellite networks”, Proceedings of IEEE Workshop on High Performance Switching and Routing, Hong Kong, People’s Republic of China, May 2005, pp. 386-390. [9]. Peng Wan, Zhigang Cao and Jinglin Wang,
“Dynamic Source Routing Algorithm for LEO Satellite Networks”, Journal of Astronautics, vol. 28, No. 5, September, 2007, pp. 1296-1303. [10]. H.Rangarajan, J.J.Garcia-Luna-Aceves, “Using labeled paths for loop-free on-demand routing in ad hoc networks”, Proceedings of the 5th International Symposium on Mobile Ad Hoc Networking and Compting (ACM MobiHoc), Roppongi, Japan, May, 2004, pp. 43-54.
[11]. E.Papapetrou, S.Karapantazis, and F.N.Pavlidou, “Distributed on-demand routing for leo satellite systems”, Computer Networks, Vol. 51, 2007, pp. 4356-4367.
[12]. S.Karapantazis, E.Papapetrou, “Multiservice On-Demand Routing in LEO Satellite Networks”, IEEE Transactions on Wireless Communications, Vol. 8, No. 1, 2009, pp. 107-112.
[13]. Xiaoyue Liu, “Multiservice on-demand routing in space information networks”, International Conference on Electric Information and Control Engineering (ICEICE), 2011, pp. 4288-4291.
[14]. M.Mohorcic, A.Svigelj, G.Kandus, Y.F.Hu and R.E. Sheriff, “Demographically weighted traffic flow models for adaptive routing in packet-switched non-geostationary satellite meshed networks”, Computer Networks, Vol. 43, No. 2, 2003, pp. 113–131.