ISSN: 1992-8645 www.jatit.org E-ISSN: 1817-3195
PERFORMANCE IMPROVEMENT OF DISK BASED
K-MEANS OVER K-K-MEANS ON LARGE DATASETS
1
SWAGATIKA DEVI, 2 TRILOKNATH PANDEY,3 ALOK KUMAR JAGADEV
1
Asstt Prof., Department of Computer Science and Engineering, Institute of Technical Education and
Research, SOA University,
2
Asstt. Prof., Department of Computer Science and Engineering, Institute of Technical Education and
Research, SOA University,
3
Assoc. Prof., Department of Computer Science and Engineering, Institute of Technical Education and
Research, SOA University,
E-mail: [email protected], [email protected], [email protected]
ABSTRACT
Clustering is a popular necessity having extensive scope for varied applications. We apply the k-means task in a situation where the volume of data is large and puts pressure on the access memory. The objective is to use less memory and access data sequentially. This paper proposes a method of making the algorithm more effective and efficient; so as to get better clustering with reduced complexity. Our algorithm is based on recent theoretical results, with significant improvements to make it application friendly. Our approach sufficiently simplifies a recently developed algorithm, both in design and analysis. We prove that our algorithm compares favorably with existing algorithms - both theoretically and experimentally, thus providing state-of-the-art performance. Also these algorithms are tested on two datasets and the result is simulated.
Keywords:Clustering, complexity, K-means, Sequential access.
1. INTRODUCTION
Clustering is the process of organizing data instances into groups whose members are similar in some way. A cluster is therefore a collection of data instances which are “similar” to each other and are “dissimilar” to data instances in other clusters. In the clustering literature, a data instance is also called an object. Like in the real world an instance may represent an object. It is also called a data point as it is seen as a point in an r dimension space, where r is the number of attributes in the data. Figure 1 shows a 2-dimensional data set. We can clearly see three groups of data points. Each group is a cluster [4]. The task of clustering is to find the three clusters hidden in the data. Although it is easy for a human to visually detect clusters in a 2-dimensional or even 3-2-dimensional space, it becomes very hard, if not impossible, to detect clusters visually as the number of dimensions increases. Additionally, in many applications, clusters are not as clear-cut or well separated as
the three clusters in Figure 1. Automatic techniques are thus needed for clustering. Three natural groups or clusters of data points after seeing the example in Figure 1, a question may arise: What is clustering for? To answer it, let us see some examples of applications in different domains.
ISSN: 1992-8645 www.jatit.org E-ISSN: 1817-3195 training data, which have to be manually labeled
with topic classes. Since news topics change constantly and rapidly, the training data would need to change constantly as well, which is infeasible via manual labeling. Clustering is clearly a solution for this problem because it automatically groups a stream of news articles based on their content similarities. Hierarchical
clustering algorithms can also organize
documents hierarchically, i.e., each topic may contain sub-topics and so on. Topic hierarchies are particularly useful for texts. Our discussion and examples above also indicate that clustering needs a similarity function to measure how similar two data points (or objects) are, or alternatively a distance function to measure the distance between two data points. The goal of clustering is thus to discover the intrinsic grouping of the input data through the use of a clustering algorithm and a distance function. We review recent work on these topics, presenting general frameworks that we use to compare and contrast two different approaches. We begin with the problem of focusing on technique of k-means in section 2; we present and relate several important notions (pros and cons) for this task, followed by our improved suggested disk versed k-means pattern, frame work and general goals respectively. In sections 3 and 4, empirical evaluation of the algorithm on large as well as small datasets are shown; and experimental results are discussed. Finally we end up with conclusion and future work in section 5.
Figure 1. Three Several Groups Or Clusters Of Data Points
2. A. K-MEANS
A simple local search heuristic for the k-means problem was proposed in 1957 by Lloyd [10]. The algorithm begins with k arbitrarily chosen points as facilities. At each stage, it allocates the points into clusters (each point assigned to closest facility) and then computes the center of mass for each cluster. These become the new facilities for the next phase, and the process repeats until it is stable. Incidentally Lloyd’s algorithm has no provable approximation bound, and arbitrarily loose examples do exist. Further, the worst-case
running time is exponential [2]. Despite these drawbacks, Lloyd’s algorithm (frequently known simply as k-means [5]) remains common in practice. The idea is to classify a given set of data into k number of disjointed clusters, where the value of k is fixed in advance. The k-means algorithm is the best known partitional clustering algorithm. It is perhaps also the most widely used among all clustering algorithms due to its simplicity and efficiency. Given a set of data points and the required number of k clusters (k is specified by the user), this algorithm iteratively partitions the data into k clusters based on a distance function.
The algorithm consists of two separate phases: the first phase is to define k centroids, one for each cluster. The next phase is to take each point belonging to the given data set and associate it to the nearest centroid. Euclidean distance is generally considered to determine the distance between data points and the centroids. When all the points are included in some clusters, the first step is completed and an early grouping is done. At this point we need to recalculate the new centroids, as the inclusion of new points may lead to a change in the cluster centroids. Once we find k new centroids, a new binding is to be created between the same data points and the nearest new centroid, generating a loop. As a result of this loop, the k centroids may change their position in a step by step manner. Eventually, a situation will be reached where the centroids do not move anymore. This signifies the convergence criterion for clustering.
Pseudocode for the k-means clustering algorithm is listed as
Algorithm 1
Algorithm k-means (k, D)
1. choose k data points as the initial
centroids (cluster centers) 2. repeat
3. for each data point x Є D do
4. compute the distance from x to each
centroid;
5. assign x to the closest centroid // a
centroid represents a cluster 6. end for
7. re-compute the centroid using the current cluster memberships
8. until the stopping criterion is met
Let the set of data points (or instances) D be {x1,
x2, …, xn}, where xi = (xi1, xi2, …, xir) is a
ISSN: 1992-8645 www.jatit.org E-ISSN: 1817-3195 algorithm partitions the given data into k clusters.
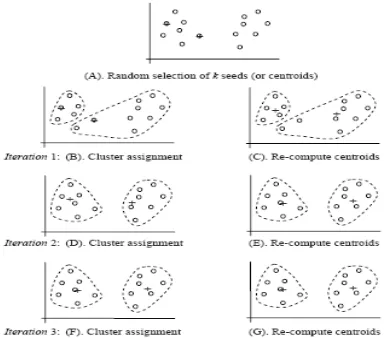
Each cluster has a cluster center, which is also called the cluster centroid. The centroid, usually used to represent the cluster, is simply the mean of all the data points in the cluster, which gives the name to the algorithm, i.e., since there are k clusters, thus k means. Figure 2 gives the working of k-means clustering algorithm.
[image:3.612.99.291.328.497.2]At the beginning, the algorithm randomly selects k data points as the seed centroids. It then computes the distance between each seed centroid and every data point. Each data point is assigned to the centroid that is closest to it. A centroid and its data points therefore represent a cluster. Once all the data points in the data are assigned, the centroid for each cluster is re-computed using the data points in the current cluster. This process repeats until a stopping criterion is met.
Figure 2. Working Of K-Means Algorithm Through An Example
B. Cons of K-Means
The k-means algorithm [8] [9] is effective in producing clusters for many practical applications. But the computational complexity of the original k-means algorithm is very high, especially for large data sets. Moreover, this algorithm results in different types of clusters depending on the random choice of initial centroids. Several attempts were made by researchers for improving the performance of the k-means clustering algorithm. This paper deals with a method for improving the accuracy and efficiency of the k-means algorithm. Several attempts were made by researchers to improve the effectiveness and efficiency of the k-means algorithm [7]. A variant of the k-means algorithm
is the k-modes [11] method which replaces the means of clusters with modes. Like the k-means method, the k-modes algorithm also produces locally optimal solutions which are dependent on the selection of the initial modes. The k-prototypes algorithm integrates the k-means and k-modes processes for clustering the data. In this method, the dissimilarity measure is defined by taking into account both numeric and categorical attributes.
As shown in Algorithm 1, the original k-means algorithm consists of two phases: one for determining the initial centroids and the other for assigning data points to the nearest clusters and then recalculating the cluster means. The second phase is carried out repetitively until the clusters get stabilized, i.e., data points stop crossing over cluster boundaries. One problem with the k-means algorithm [5] is that some clusters may become empty during the clustering process since no data point is assigned to them. Such clusters are called empty clusters [13]. To deal with an empty cluster, we can choose a data point as the replacement centroid, e.g., a data point that is furthest from the centroid of a large cluster. If the sum of the squared error (SSE) is used as the stopping criterion, the cluster with the largest squared error may be used to find another centroid.
C. Disk Version of K-Means Algorithm
ISSN: 1992-8645 www.jatit.org E-ISSN: 1817-3195 special algorithms that scale-up clustering [6]
algorithms to large data sets, they all require sophisticated techniques.
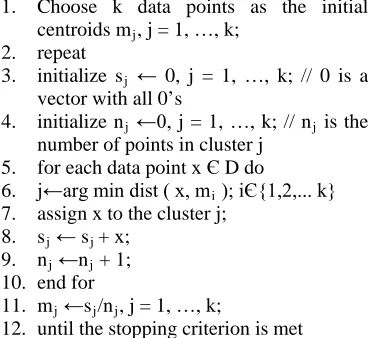
Algorithm disk-k-means (k, D)
1. Choose k data points as the initial
centroids mj, j = 1, …, k;
2. repeat
3. initialize sj ← 0, j = 1, …, k; // 0 is a
vector with all 0’s
4. initialize nj ←0, j = 1, …, k; // nj is the
number of points in cluster j 5. for each data point x Є D do
6. j←arg min dist ( x, mi ); iЄ{1,2,... k}
7. assign x to the cluster j; 8. sj ← sj + x;
9. nj ←nj + 1;
10. end for
11. mj ←sj/nj, j = 1, …, k;
12. until the stopping criterion is met
Let us give some explanations of this algorithm. Line 1 does exactly the same thing as k-means algorithm. Line 3 initializes vector sj which is
used to incrementally compute the sum in (line 8). Line 4 initializes nj which records the number of
data points assigned to cluster j (line 9). Lines 6 and 7 perform exactly the same tasks as lines 4 and 5 in the original k-means algorithm. Line 11 re-computes the centroids, which are used in the next iteration. Any of the three stopping criteria may be used here. If the sum of squared error is applied, we can modify the algorithm slightly to compute the sum of square error incrementally.
3. EMPIRICAL EVALUATION
A comparison of algorithms on real data sets gives a great deal of insight as to their relative performance. Real data is not worst-case, implying that neither the asymptotic performance nor running time bounds claimed in theoretical results are necessarily tight. Of course, empirical evaluation depends heavily on the data sets selected for the experiments. A number of the data sets were not particularly large, probably so that batch-processing algorithms would terminate quickly on those inputs. The main motivation for streaming is very large data sets, so we are more interested in sets that might be difficult to fit in a main memory and focused on the largest examples and hence we need disk based modified k-means.
4. EXPERIMENTAL RESULT AND
DISCUSSION
Our goal is to compare the algorithms at a common base point. Instead of just comparing the same dataset and cluster count, we further inhibit each to use the same amount of memory (in terms of number of points stored in random access). The memory constraints were chosen to reflect the usage of small amounts of memory that are close to the algorithms’ designers’ specifications, where possible. This does produce a drop in solution quality compared to running the algorithm at their suggested parameters, although their approach remains competitive. The multivariate iris data set and the census data set taken from the UCI repository of machine learning databases [1], is used for testing the accuracy and efficiency of the enhanced algorithm. The same data set is given as input to the standard k-means algorithm and the enhanced algorithm which uses disk version of k-means. The value of k, the number of clusters, is taken as 2,3,4,5. The results of the experiments are tabulated in Table 1.
[image:4.612.111.295.149.318.2]The accuracy of clustering is determined by comparing the clusters obtained by the experiments. The percentage accuracy and the time taken for each experiment are computed and the mean values are tabulated. For the enhanced algorithm, the data values and the value of k are the only inputs required since the initial centroids are computed automatically by the program.
Table 1. Comparison Of Algorithms On Two Datasets
Data size
Number of Clusters
k-means running time(ns)
Disk-k-means running time(ns)
1000K 2 180 -
3 140 -
4 104 91
5 96 83
100K 2 175 -
3 120 -
4 101 85
5 91 76
10K 2 110 -
3 95 -
4 72 33
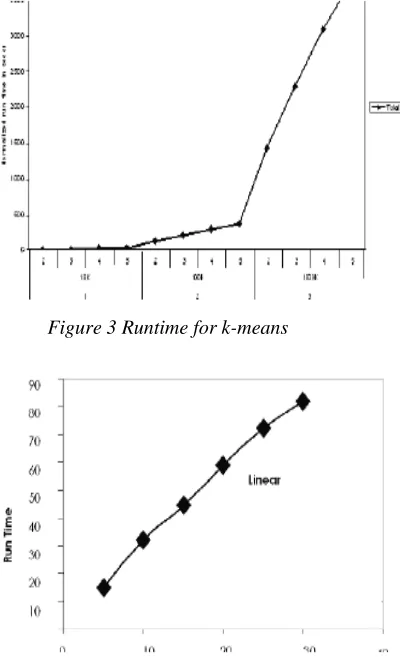
ISSN: 1992-8645 www.jatit.org E-ISSN: 1817-3195 It can be observed from Table 1 that the runtime
[image:5.612.100.300.274.609.2]of the algorithm is linear with respect to the datasets. Table 1 stores the result of datasets of variance data size so that our goal can be achieved to consider different data and examine them carefully. The proposed algorithm appears to improve the performance significantly. Figure 3 and 4 depicts the performances of the standard k-means algorithm and the enhanced version of the algorithm in terms of the accuracy and efficiency. It can be seen from the above experiments that the enhanced algorithm significantly outperforms the original k-means algorithm in terms of accuracy and efficiency (Figure 5).
Figure 3 Runtime for k-means
Figure 4. Runtime for Disk based k-means
Figure 5. Efficiency and Accuracy of the algorithms
5. CONCLUSION
The k-means algorithm effectively handles large clusters of data, where as the standard algorithm does not always guarantee good results. Moreover, the computational complexity of the standard algorithm is objectionably high owing to the need to reassign the data points a number of times, during each iteration of the loop. This paper presents an enhanced disk based k-means algorithm which combines a systematic method and an efficient way for assigning data points to clusters. Our simplistic approach exploits the latent structure in the data by partitioning the data to be stored in disk (for large datasets). This method provides scalability for large datasets and reduction in pre-processing overheads for in-database mining. The aggregations of results are compared along with their efficiency and accuracy for two different data sets. A limitation of the proposed algorithm is that the value of k, the number of desired clusters, is still required to be given as an input, regardless of the distribution of the data points. To help evolve better statistical methods to compute the value of k, depending on the data distribution, future research is suggested.
REFRENCES:
[1] Merz C and Murphy P, UCI Repository of
Machine Learning Databases, Available: ftp://ftp.ics.uci.edu/pub/machine-learning-databases
[2] Andrea Vattani. k-means requires
exponentially many iterations even in the plane. Discrete Computational Geometry, June 2011
[3] Vladimir Braverman, Adam Meyerson,
Rafail Ostrovsky, Alan Roytman, Michael Shindler, and Brian Tagiku. Streaming k-means on Well-Clusterable Data. In SODA, 2011.
[4] Marcel R. Ackermann, Christian
ISSN: 1992-8645 www.jatit.org E-ISSN: 1817-3195 Raupach, Christian Sohler, and Kamil
Swierkot. StreamKM++: A clustering algorithms for data streams. In ALENEX, 2010.
[5] Pang-Ning Tan, Michael Steinback and
Vipin Kumar, Introduction to Data Mining, Pearson Education, 2007.
[6] Tapas kanungo, Natan S, Natanyahu, Angela
Y. Wu. “An efficient K-Means Clustering Algorithm: Analysis an Implementation”. IEEE Transactions on Knowledge and Data Engineering, Vol. 13, NO.3, May/June 2001
[7] Fahim A.M, Salem A. M, Torkey A and
Ramadan M. A, “An Efficient enhanced k-means clustering algorithm,” Journal of Zhejiang University, 10(7):1626-1633, 2006.
[8] Jiawei Han M. K, Data Mining Concepts and
Techniques, Morgan Kaufmann Publishers, An Imprint of Elsevier, 2006.
[9] Margaret H. Dunham, Data Mining-
Introductory and Advanced Concepts,
Pearson Education, 2006.
[10] Stuart Lloyd. Least Squares Quantization in
PCM. In Special issue on quantization, IEEE Transactions on Information Theory, 1982.
[11] Chaturvedi J. C. A, Green P, “K-modes
clustering,” J. Classification, (18):35-55, 2001.
[12] Anjan Goswami, Ruoming Jin, Gagan
Agrawal, “Fast and Exact Out-of-Core K-Means Clustering”, Proceedings of the Fourth IEEE International Conference on Data Mining, Pages: 83-90, 2004
[13] Carlos Ordonez, “Programming the K-means