REDUCED ATLAS DATABASE AND ITS APPLICATION IN
MULTI-ATLAS SEGMENTATION
*1YAQIAN ZHAO, 2 JIACHEN ZHANG, 3AIMIN HAO, 4YUE FU
*1 Corresponding Author State Key Laboratory of Virtual Reality Technology Beihang University, Beijing, China
2School of Optoelectronic Information, University Of Electronic Science and Technology, Chengdu, China
3 Prof., State Key Laboratory of Virtual Reality Technology Beihang University, Beijing, China
4
Department of Information Engineering, Shijiazhuang University Of Economics, Shijiazhuang, China
E-Mail: [email protected], [email protected], [email protected], [email protected]
ABSTRACT
To simplify the problem of atlas selection in multi-atlas segmentation, we define Minimum Reduced Atlas Database (MinRAD), and give an algorithm of selecting MinRAD. Furthermore, nine types of MinRAD model are proposed based different similarity measures and input images, and their performances on multi-atlas segmentation are compared in two databases. Finally, we give some advice on how to select similarity measure and its threshold.
Keywords:Reduced Atlas Database; Medical Image Processing; Multi-atlas Segmentation; Brain MRI Segmentation; Structural Similarity
1. INTRODUCTION
An atlas, in medical image processing, is a couple of a structural MR scan and corresponding manual segmentation, namely label image. In atlas based segmentation, the atlas image can be registered to the query image, yielding a transformation which allows the atlas segmentation to be transformed and treated as a segmentation result. If a database of atlas is available, multiple segmentations from different atlas can be combined to a final result. This is called multi-atlas segmentation. For its high accuracy, it has been extensively applied for medical image segmentation, especially for brain MR images segmentation.
Atlas selection is one of the most critical factors affecting the segmentation accuracy in atlas
segmentation. [1] For example, Rohlfing et al. [2] and
Wu et al. [3] investigated the optimal template
selection during single-atlas segmentation. Aljabar et al. explored multi-atlas selection, proved similarity- and age-based selection produce a similar result, and give the optimal selection of size
of atlas subset is between 15 and 25. [4] In the
classical methods of atlas selection, all atlases in the atlas database are compared with the query image to select a best similar atlas or several best similar atlases. In a practical level, the most
important problem of atlas selection is its large computational cost, linearly increasing with the size of the database. On the other hand, it is possible that selecting the best similar atlases from the whole database results in redundancy bias. For a simple example, if a atlas is duplicated multiple times in the atlas set, the label result will bias towards the repeated atlases in the similarity based voting model. [5]
To simplify atlas selection and reduce redundancy bias, we define Minimum Reduced Atlas Database (MinRAD), and give two evaluation indices of MinRAD in the next section. In Section 3, nine MinRAD models are compared on two brain databases. Furthermore, based on experiment result and analysis, Section 3 also gives some advices on the selection of similarity measure and threshold. Finally, conclusions and future work are summarized.
2. MINIMUM REDUCED ATLAS
DATABASE
2.1 Definition of MinRAD
Definition 1: For a given threshold θ and
similarity measure function SM, a subset R of atlas
database D is defined RAD, if it satisfies the
following condition:
∀ atlasi∈R, there is at least a atlasj∈D, and
SM(atlasi, atlasj)≥θ
Definition 2: For a given threshold θ and
similarity measure function SM, a subset R of atlas
database D is defined MinRAD, if it satisfies the
following condition:
∀ atlasi∈R, there is only a atlasj∈D, and
SM(atlasi, atlasj)≥θ
MinRAD is the special RAD which has least size.
2.2 Construction of MinRAD
It is obvious that a database maybe has more than one MinRAD for a given threshold and similarity measure. How to select the optimal one? We adopt the maximum entropy principle. The aim is to maintain more information of original database. The algorithm of the selection of constructing MinRAD is described as follows.
Algorithm of constructing MinRAD:
Step1: Give a threshold value θ of similarity
measure SM, and initialize MinRAD as
null
Step2: Calculate the similarity measure between atlasi and atlasj, denote SM(atlasi, atlasj),
i≠j
Step3: Put these atlas satisfied SM(atlasi,
atlasj)≥θ into a same Group k,
k=1,2,…,K
Step4: if length(Group k )>1
Put the atlas with max entropy in
Group k into MinRAD
else
Directly put the atlas in Group k
into MinRAD
Step5: Repeat Step4 untilall Group are carried out, the final result of RD is the desiring database.
2.3 Evaluation Indices
For easy to compare the performance among different MinRADs derived from the same database, we define two evaluation indices: size of MinRAD and difference of percentage accuracy between segmentation result based the whole atlas database segmentation result based MinRAD. The percentage accuracy is calculated by overlap radio between manual segmentation and automatic segmentation.
MinRAD
N= (1)
2
( m, a) m a
m a
R R
PA OR R R
R R
∩
= =
+ (2)
R W
DPA=PA −PA (3)
where |∙| represents pixel counts, Rm is manual
segmentation, Ra is automatic segmentation, PAw
and PAR respectively denotes the percentage
accuracy based whole database and MinRAD. DPA
ranges from -1 to 1. If DPA is less than 0, the
segmentation result based on MinRDA is inferior to
that based on whole database. If DPA is greater
than 0, the segmentation result based on MinRDA
is superior to that based on whole database. If DPA
is equal to 0, the segmentation result based on MinRDA is as good as the result based on whole database, but the two result maybe are different.
3. EXPERIMENTAL RESULTS AND ANALYSIS
3.1 Selection of Similarity Measure
To compare the sensitivity of MinRAD to similarity measure, we select three different similarity measures between two atlases: Dice coefficient, NMI and SSIM, typically reflecting the similarity in intensity, quantity of information, and spatial structure.
Dice Similarity Coefficient
Dice coefficient is given by [6]
2
( , ) A B
DSC A B
A B
∩ =
+ (4)
where |∙| represents pixel counts.
Normalized Mutual Information (NMI)
NMI is the normalization of Mutual Information (MI). MI is given by
( , ) ( ) ( ) ( , )
MI A B =H A +H B −H A B (5)
Where H(∙) is entropy, H(A,B) is joint entropy
between A and B.
There are many normalized variants of MI. Here we adopt the symmetrical NMI proposed by Witten& Frank in 2005. [7] It is defined as
2 ( , )
( , )
( ) ( )
MI A B NMI A B
H A H B
=
+ (6)
Structural SIMilarity (SSIM)
The SSIM metric is calculated on various
windows of an image. [8][9] The measure between
1 2
2 2 2 2
1 2
(2 )(2 )
( , )
( )( )
x y xy
x y x y
c c
SSIM x y
c c
µ µ σ
µ µ σ σ
+ +
=
+ + + + (7)
where µx is the average of x, µyis the average of
y, σx2 is the variance of x, σ2y is the variance of y,
xy
σ is the covariance of x and y , 2
1 ( 1 )
c = k L ,
2 2 ( 2 )
c = k L , L is the dynamic range of the
pixel-values. In this paper, we set N=8,
1 0.01
k = ,k2 =0.03.
3.2 Design of Experiment
Since an atlas is a couple of scan image and label image, there are in fact three groups of input for any similarity measure: scan image, label image, and scan and label image. Therefore, we need to compare 3*3 kinds of MinRAD based different similarity measures. The similarity between scan and label image can be calculated by the average of the scan similarity and label similarity. We carry out the same multi-atlas segmentation method on two brain database and their MinRAD. The two databases both have 20 images. One is adult brain image, and another is adolescent brain image.
In our work, the cross validation leave-one-out approach was employed, and the query image is selected in the whole database, not in MinRAD. Note that all similarity measures must be normalized to [0,1], for they should be compared in a uniform scale. Here we adopt min-max normalization.
3.2 Results and Analysis
The experiment results achieved by different similarity measures and thresholds are listed in Tab.
1and Tab.2. SMi in Tab.1 and Tab.2 represent the
following similarity measures:
1 ( ,i j)
SM =DSC S S (8)
2 ( ,i j)
SM =NMI S S (9)
3 ( ,i j)
SM =SSIM S S (10)
4 ( ,i j)
SM =DSC L L (11)
5 ( ,i j)
SM =NMI L L (12)
6 ( ,i j)
SM =SSIM L L (13)
7
( , ) ( , )
2
i j i j
DSC S S DSC L L
SM = + (14)
8
( , ) ( , )
2
i j i j
NMI S S NMI L L
SM = + (15)
9
( , ) ( , )
2
i j i j
SSIM S S SSIM L L
SM = + (16)
where S is scan image , L is label image.
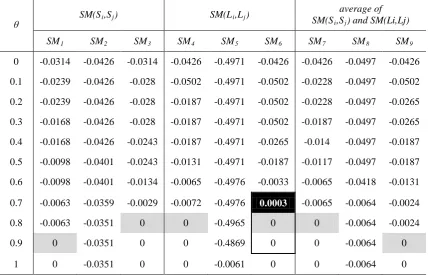
From comparing the results in Tab.1 and Tab.2, we can draw the following conclusions:
(1) MinRAD not only get the same percentage
accuracy as whole database (the region of gray background in Tab. 1), but also get a more percentage than whole database (the region of black background in Tab. 1).
(2) With the increasing of threshold, the
percentage accuracy of segmentation firstly becomes large, but when threshold reaches a certain value, it stop rise, even begin to
descend (the area marked by rectangular).
(3) For a given threshold, different similarity
measures produce different sizes of MinRAD.
(4) SSIM is very suitable to select the optimal
MinRAD, while NMI is not suitable.
(5) Similarity of label images is more important
than similarity of scan image.
(6) The size of MinRAD of adolescent brain
database is smaller than that of adult brain database. The reason is that the individual differences of human brain become large with the growth of age.
The first two conclusions demonstrate the best performance of MinRAD on reducing the redundancy bias. The latter conclusions imply the choosing method of similarity measure and threshold:
(1) Structural feature based similarity measure is
a better choice than other similarity measures.
(2) The input of similarity measure should
contain label images.
(3) The choice of threshold depends on the
4. CONCLUSIONS
In this paper, we proposed a novel strategy of simplifying the atlas selection in multi-atlas segmentation by constructing a MinRAD for the atlas database, which can effectively reduce the redundancy bias and the computational cost of atlas selection. By comparing the difference of
[image:4.612.93.522.236.511.2]segmentation results based whole database and nine types of MinRAD, we demonstrated the validity of our method and give some advice on the selection of similarity measure and its threshold. In future work, we will analyze the sensitivity of performance of MinRAD to threshold and similarity measure, and further extend our work on 3D atlas datasets.
Table 1: Of Adult Brain Atlas Database With Different Similarity Measures And Thresholds
θ SM(Si,Sj) SM(Li,Lj)
average of SM(Si,Sj) and SM(Li,Lj)
SM1 SM2 SM3 SM4 SM5 SM6 SM7 SM8 SM9
0 -0.0314 -0.0426 -0.0314 -0.0426 -0.4971 -0.0426 -0.0426 -0.0497 -0.0426
0.1 -0.0239 -0.0426 -0.028 -0.0502 -0.4971 -0.0502 -0.0228 -0.0497 -0.0502
0.2 -0.0239 -0.0426 -0.028 -0.0187 -0.4971 -0.0502 -0.0228 -0.0497 -0.0265
0.3 -0.0168 -0.0426 -0.028 -0.0187 -0.4971 -0.0502 -0.0187 -0.0497 -0.0265
0.4 -0.0168 -0.0426 -0.0243 -0.0187 -0.4971 -0.0265 -0.014 -0.0497 -0.0187
0.5 -0.0098 -0.0401 -0.0243 -0.0131 -0.4971 -0.0187 -0.0117 -0.0497 -0.0187
0.6 -0.0098 -0.0401 -0.0134 -0.0065 -0.4976 -0.0033 -0.0065 -0.0418 -0.0131
0.7 -0.0063 -0.0359 -0.0029 -0.0072 -0.4976 0.0003 -0.0065 -0.0064 -0.0024
0.8 -0.0063 -0.0351 0 0 -0.4965 0 0 -0.0064 -0.0024
0.9 0 -0.0351 0 0 -0.4869 0 0 -0.0064 0
1 0 -0.0351 0 0 -0.0061 0 0 -0.0064 0
Table 2: N Of Adult Brain Atlas Database With Different Similarity Measures And Thresholds
θ SM(Si,Sj) SM(Li,Lj)
average of SM(Si,Sj) and SM(Li,Lj)
SM1 SM2 SM3 SM4 SM5 SM6 SM7 SM8 SM9
0 1 1 1 1 1 1 1 1 1
0.1 3 1 2 2 1 2 4 1 2
0.2 3 1 2 4 1 2 4 1 3
0.3 5 3 5 4 1 3 6 1 3
0.4 5 3 6 4 1 4 7 1 4
0.5 7 5 9 5 1 7 9 1 5
0.6 7 5 11 7 2 9 10 2 7
0.7 8 8 12 8 2 12 11 10 7
0.8 8 12 15 10 5 14 13 10 9
0.9 16 12 16 10 8 15 15 10 12
[image:4.612.95.513.544.733.2]Table 3: DOR Of Adolescent Brain Atlas Database With Different Similarity Measures And Thresholds
θ SM(Si,Sj) SM(Li,Lj)
average of SM(Si,Sj) and SM(Li,Lj)
SM1 SM2 SM3 SM4 SM5 SM6 SM7 SM8 SM9
0 -0.0422 -0.0929 -0.0422 -0.054 -0.0054 -0.054 -0.054 -0.0577 -0.054
0.1 -0.029 -0.0929 -0.029 -0.0331 -0.0565 -0.0371 -0.0371 -0.0577 -0.0371
0.2 -0.0239 -0.0861 -0.029 -0.0331 -0.0565 -0.0371 -0.0371 -0.0577 -0.0408
0.3 -0.0239 -0.0861 -0.029 -0.0331 -0.0565 -0.0331 -0.0331 -0.0577 -0.0407
0.4 -0.0193 -0.0787 -0.019 -0.0408 -0.0565 -0.0408 -0.0199 -0.0577 -0.0308
0.5 -0.0145 -0.0729 -0.0145 -0.0408 -0.0565 -0.0256 -0.0256 -0.0573 -0.0206
0.6 -0.0145 -0.0729 -0.0145 -0.0123 -0.0563 -0.0256 -0.0123 -0.0547 -0.0006
0.7 -0.0049 -0.0729 -0.0099 -0.0123 -0.0556 -0.0123 -0.0017 -0.022 0.0256
0.8 -0.0036 -0.0729 -0.0099 -0.0017 -0.0556 0.0031 0 -0.022 0
0.9 0 -0.0729 -0.0049 0 -0.0544 0 0 -0.022 0
1 0 -0.0729 0 0 -0.0217 0 0 -0.022 0
Table 4: N Of Adolescent Brain Atlas Database With Different Similarity Measures And Thresholds
θ
SM(Si,Sj) SM(Li,Lj)
average of SM(Si,Sj) and SM(Li,Lj)
SM1 SM2 SM3 SM4 SM5 SM6 SM7 SM8 SM9
0 1 1 1 1 1 1 1 1 1
0.1 4 1 4 5 2 4 4 1 4
0.2 5 2 4 5 2 4 4 1 6
0.3 5 2 4 5 2 5 5 1 6
0.4 7 4 6 6 3 6 6 1 6
0.5 9 5 7 6 3 7 7 3 7
0.6 10 5 7 8 3 7 8 9 7
0.7 10 5 8 8 6 8 9 10 7
0.8 13 5 8 9 6 8 10 10 7
0.9 13 5 9 10 9 9 10 10 7
[image:5.612.97.518.426.701.2]REFERENCES
[1] M. B. Cuadra, C. Pollo, A. Bardera, O.
Cuisenaire, and J. P. Thiran, “Atlas-based segmentation of pathological brain MR
images”, ICIP, pp. 573-576, 2003.
[2] Rohlfing, T., Brandt, R., Menzel, R., and
Maurer, C., “Evaluation of atlas selection strategies for atlas-based image segmentation with application to confocal microscopy
images of bee brains”, NeuroImage, vol.21, no.
4, 2004, pp. 1428–1442.
[3] M. Wu, C. Rosano, P. Lopez-Garcia, C. S.
Carter, and H. J. Aizenstein, “Optimum template selection for atlas-based
segmentation”, NeuroImage, vol. 34, no. 4,
2007, pp. 1612-1618.
[4] P. Aljabar, R.A. Heckemann, A. Hammers, J.V.
Hajnal, and D. Rueckerta, “Multi-atlas based segmentation of brain images: Atlas selection
and its effect on accuracy”, NeuroImage, vol.
46, no. 3, 2009, pp. 726–738.
[5] H. Wang, and P. Yushkevich, “Spatial Bias in
Multi-Atlas Based Segmentation”, CVPR,
2012.
[6] Dice, L. “Measures of the amount of ecologic
association between species”, Ecology, no. 26,
1945, pp. 297-302.
[7] Witten, Ian H., & Frank, Eibe, “Data Mining:
Practical Machine Learning Tools and
Techniques”, Morgan Kaufmann, Amsterdam,
2005.
[8] Z. Wang, A. C. Bovik, H. R. Sheikh and E. P.
Simoncelli, “Image quality assessment: From
error visibility to structural similarity," IEEE
Transactions on Image Processing, vol. 13, no. 4, Apr. 2004, pp. 600-612.
[9] Artur Loza, Lyudmila Mihaylova, Nishan
Canagarajah, and David Bull “Structural Similarity-Based Object Tracking in Video
Sequences”, Proc. of the 9th International