JAN-FEB, 2013, Vol. – I, Issue-IV www.srjis.com Page 1018
Personality Trait among Science, Arts and Commerce Students:
A comparative study
T. Iqbal & S. Bano Research scholar
Department of education,AMU, Aligarh
Received: 08 February 2013
Reviewed & Received: 18 February 2013 Accepted: 20 February 2013
The investigators in the present study has tried to make the comparison between science & commerce, science & arts and arts & commerce undergraduate students on personality traits at Aligarh Muslim University. The sample of the study consisted of 600 undergraduate students. 198 students from science stream, 264 students from atrs stream and 138 students from commerce stream. NEO five factor inventory ( NEO-FFI; by Costa,et.al (1992) was used for the study . t-test when applied on data revealed that the result is not significant at
any level of confidence among science and commerce students. A significant difference of
.01 was found between science and arts students. And a significant difference of .01 was
found between arts and commerce students.
INTRODUCTION
Personality has been conceptualized from a variety of theoretical perspectives, and at various levels of abstraction or breadth (John, Hampson, & Goldberg, 1991; McAdams, 1995). Each of these levels has made unique contributions to our understanding of individual differences in behavior and experience. However, the number of personality traits, and scales designed to measure them, escalated without an end in sight (Goldberg, 1971).
personality psychology was a descriptive model, or taxonomy, of its subject matter. One of the central goals of scientific taxonomies is the definition of overarching domains within which largenumbers of specific instances can be understood in a simplified way. Thus, in personality psychology, ataxonomy would permit researchers to study specified domains of personality characteristics, rather thanexamining separately the thousands of particular attributes that make human beings individual and unique.
JAN-FEB, 2013, Vol. – I, Issue-IV www.srjis.com Page 1019 After decades of research, the field is approaching consensus on a general taxonomy of personality traits, the “Big Five” personality dimensions. These dimensions do not represent a particular theoreticalperspective but were derived from analyses of the natural-language terms people use to describe themselves and others. Rather than replacing all previous systems, the Big Five taxonomy serves an integrative function because it can represent the various and diverse systems of personality description in a common framework .
It thus provides a starting place for vigorous research and theorizing that can eventually lead to an explicationand revision of the descriptive taxonomy in causal and dynamic terms. Review of related studies:
Chaplin, John, and Goldberg (1988) argued for a prototype conception where each category is defined in terms of its clear cases rather than its boundaries; category membership need not be discrete but can be defined as continuous. Chaplin et al. (1988) applied this prototype conception to traits, states, and activities.
Goldberg (1990) conducted two additional studies using abbreviated sets of more common terms. In one study, Goldberg obtained self and peer ratings of 475 very common trait adjectives which he had grouped into 131 sets of “tight synonym” clusters. In four samples, the five-factor structures were very similar to each other and to the structure obtained in the more comprehensive list of 1,710 terms, and the results in the self-rating data were virtually indistinguishable from those in the peer ratings.
Wiggins (1995; . In his 20-year program of research on the interpersonal circumplex, Wiggins has used personality trait adjectives to elaborate both the conception and the measurement of the two major dimensions of interpersonal behavior, dominance (or agency) and nurturance (or communion).
Szirmak and De Raad (1994) examined Hungarian personality descriptors and found strong support for the first four of the Big Five but failed to obtain a factor resembling the fifth of the Big Five; instead, when they forced a five factor solution, the Agreeableness factor split into two factors. An Intellect/Openness factor emerged only when six factors were rotated. Again, one wonders about the selection rules which used a “trait versus state rating.”
Objectives:
1. To make comparison between science and commerce students on different personality traits.
2. To make comparison between science and arts students on different personality traits. 3. To make comparison between arts and commerce students on different personality traits. Hypothesis:
1. There will be no significant difference between science and commerce students on different personality traits.
2. There will be no significant difference between science and arts students on different personality traits.
3. There will be no significant difference between arts and commerce students on different personality traits.
Sample:
The total sample consisted of 600 under graduate students. 198 students from science stream, 264 students from atrs stream and 138 students from commerce stream from a m u Aligarh city of western U.P. purposive sampling technique was adopted for the present study.
Description of the scale used:
JAN-FEB, 2013, Vol. – I, Issue-IV www.srjis.com Page 1020 face validity.To the extent possible, existing valid scales were chosen to capture some aspects of the various domains of personality traits.
Statistical Analysis
t-test was used to find out the significant difference between Means of the students of different streams.( ie science, arts and commerce).
Analysis and interpretation:
Table 1: Comparison of personality traits between Science and commerce students N.S (not significant)
Table 1 shows comparison of five (5) domains of personality of trait among science and commerce students. Comparison of domains of personality trait between science and commerce. The Mean score on openess for science students is 84.82 and for commerce students Mean is 88.27.The calculated t- value is 2.23 , which is significant at 0.05 level. In the Second domain of personality trait namely, the conscientiousness Mean score for science students is 25.67 and for commerce students Mean is. 26.76,The calculated t-value 2.15, which is significant at (0.05 level). The third domain of personality trait namely, exteraversion the Mean score of science students is 100.97 and for commerce students Mean is 100.44 . The calculated t-value is 2.23. which is significant at 0.05 level and in the forth domain of personalty trait namely the agreeable Mean score for science students is 60.53 for commerce students Mean is 58.57. The calculated t-value is 1.98, which is significant (at 0.05 level). In the last fifth domain of personality trait namely neutroticism the Mean score for science students is 56.00 and for commerce students is 53.67. The calculated t-value is 1.75, which is significant at 0.05 level. On the total score of personality trait the Mean score for science students is 328.02 and for commerce students is 327.73. The calculated t-value is 0.043, which is not significant at level of confidence.
S.No. Domains of personality traits
B.SC(N=198) B.COM(N=138) t-value
significance
MEAN SD MEAN SD
1 Openess 84.82 15.52 88.27 11.67 2.23 0.05 level
2 conscientiousness 25.67 4.91 26.76 4.02 2.15 0.05 level
3 exteraversion 100.97 23.46 100.44 18.47 2.23 0.05 level 4 Agreeable 60.53 16.40 58.57 11.90 1.98 0.05 level 5 neutroticism 56.00 13.00 53.67 10.28 1.75 0.05 level
6 Total
JAN-FEB, 2013, Vol. – I, Issue-IV www.srjis.com Page 1021 Table 2: Comparison of personality traits between Science and arts students
[image:4.595.85.509.106.304.2]Table 2 shows comparison of five (5) domains of personality trait among science and arts students. The Mean score on openess for science students is 84.82 and for arts students Mean is 95.42.The calculated t- value is 8.42, which is significant at 0.01 level. In the Second domain of personality trait namely the conscientiousness Mean score for science students is 25.67 and for arts students Mean is 27.82. ,The calculated t-valu5.03, which is significant (0.01 level). The third domain of personality trait namely, exteraversion the Mean score of science students is 100.97 and for arts students Mean is 114.25. The calculated t-value is 6.87. which is significant at 0.01 level and in the forth domain of personalty trait namely the agreeable Mean score for science students is 60.53 and for arts students Mean is 67.77. The calculated t-value is 5.70, which is significant (at 0.01 level). In the last fifth domain of personality trait namely neutroticism the Mean score for science students is 56.00 and for arts students is 60.84. The calculated t-value is 4.87, which is significant at 0.01 level. On the total score of personality trait the Mean score for science students is 362.02 and for arts students is 366.12. The calculated t-value is 7.06, which is significant at 0.01 level.
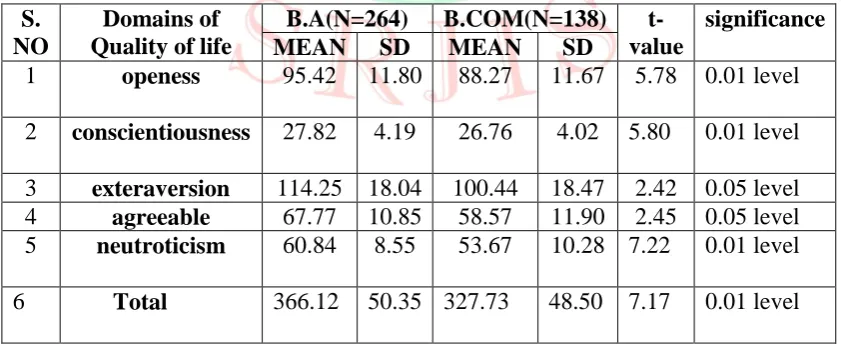
Table 3: Comparison of personality traits between arts and commerce students
Table 3 shows comparison of five (5) domains of personality trait among arts and commerce students. The Mean score on openess for arts students is 95.42 and for commerce students Mean is 88.42.The calculated t- value is 5.78, which is significant at
S. NO
Domains of Quality of life
B.SC(N=198) B.A(N=264) t-value
significance
MEAN SD MEAN SD
1 openess 84.82 15.52 95.42 11.80 8.42 0.01 level
2 conscientiousness 25.67 4.91 27.82 4.19 5.03 0.01 level
3 exteraversion 100.97 23.46 114.25 18.04 6.87 0.01 level 4 agreeable 60.53 16.40 67.77 10.85 5.70 0.01 level 5 neutroticism 56.00 13.00 60.84 8.55 4.87 0.01 level
6 Total 362.02 65.57 366.12 50.35 7.06 0.01 level
S. NO
Domains of Quality of life
B.A(N=264) B.COM(N=138) t-value
significance
MEAN SD MEAN SD
1 openess 95.42 11.80 88.27 11.67 5.78 0.01 level
2 conscientiousness 27.82 4.19 26.76 4.02 5.80 0.01 level
3 exteraversion 114.25 18.04 100.44 18.47 2.42 0.05 level 4 agreeable 67.77 10.85 58.57 11.90 2.45 0.05 level 5 neutroticism 60.84 8.55 53.67 10.28 7.22 0.01 level
[image:4.595.88.509.538.712.2]JAN-FEB, 2013, Vol. – I, Issue-IV www.srjis.com Page 1022 0.01 level. In the Second domain of personality trait namely the conscientiousness Mean score for arts students is 27.82 and for commerce students Mean is 27.76.The calculated t-valu 5.80, which is significant at (0.01 level). The third domain of personality trait namely, exteraversion the Mean score of arts students is 114.25 and for commerce students Mean is 100.44. The calculated t-value is 2.42. which is significant at 0.05 level and in the forth domain of personalty trait namely agreeable the Mean score for arts students is 67.77 and for commerce students Mean is 58.57. The calculated t-value is 2.45, which is significant (at 0.05 level). In the last fifth domain of personality trait namely neutroticism the Mean score for arts students is 60.84 and for commerce students is 53.67. The calculated t-value is 7.22, which is significant at 0.01 level. On the total score of personality trait the Mean score for arts students is 366.12 and for commerce students is 327.73. The calculated t-value is 7.17, which is significant at 0.01 level.
Findings of the study:
1 It was found that there is no significant difference on personality traits among science and commerce students. But the mean score of science students is more than the commerce students.
2 It was found that there is a marked significant difference on personality traits among science and arts students. The mean score of arts students is more than the science students.
3 It was found that there is a significant difference on personality traits among arts and commerce students. The mean score of arts students is more than that of commerce students.
Suggestions:
Research and explorations are not the ending results but these always open the way for future endeavors. Similarly the present work is not the end in this area. In fact all the variables can never be studied in a single research.
The present as its own limitations: certain humble suggestions are therefore given for further investigations.
1 For obtaining greater generality of the findings such studies must be conducted on another sample.
2 Large samples provide better results, but the present research work is confined to only 600 students. It cannot claim for its comprehensiveness. Future research may be conducted on even large sample.
3 This study was confined to AMU graduate students only; its finding can not be applied to all the stages of education. Thus there is a need to generalize this study by taking a sample of all level of education to corroborate the findings of the study.
References:
Chaplin, W. F., John, O. P., & Goldberg, L. R. (1988). Conceptions Of States And Traits: Dimensional Attributes With Ideals As Prototypes. Journal Of Personality And Social Psychology, 54, 541-557.
Goldberg, L. R. (1971). A Historical Survey Of Personality Scales And Inventories. In P. Mcreynolds (Ed.), Advances In Psychological Assessment (Vol. 2) (Pp. 293-336). Palo Alto, CA: Science And Behaviorbooks.
Guilford, J.P And Fruchter, Benjamin (1981), “Fundamental Statistics In Psychology And Education” Mc Graw- Hill International Book Company, London.
Goldberg, L. R. (1990). An Alternative "Description Of Personality": The Big-Five Factor Structure. Journal Of Personality And Social Psychology, 59, 1216-1229.
JAN-FEB, 2013, Vol. – I, Issue-IV www.srjis.com Page 1023 Desirability Values For 573 Personality Terms. European Journal Of Personality, 1, 241-258.
Hampson, S. E., John, O. P., & Goldberg, L. R. (1986). Category Breadth And Hierarchical Structure In Personality: Studies Of Asymmetries In Judgments Of Trait Implications. Journal Of Personality And Social Psychology, 51, 37-54.
John, O. P., Angleitner, A., & Ostendorf, F. (1988). The Lexical Approach To Personality: A Historical Review Of Trait Taxonomic Research. European Journal Of Personality, 2, 171-203.
Mangal S.K, “Statistics In Psychology And Education.” Published By PHI Learning Private Limited.
Szirmak, Z., & De Raad, B. (1994). Taxonomy And Structure Of Hungarian Personality Traits. European Journal Of Personality, 8, 95-117.