ORIGINAL RESEARCH
METABOLIC BRAIN MAPPING
Accelerated Echo-Planar J-Resolved Spectroscopic Imaging in
the Human Brain Using Compressed Sensing: A Pilot Validation
in Obstructive Sleep Apnea
M.K. Sarma, R. Nagarajan, P.M. Macey, R. Kumar, J.P. Villablanca, J. Furuyama, and M.A. Thomas
ABSTRACT
BACKGROUND AND PURPOSE: Echo-planar J-resolved spectroscopic imaging is a fast spectroscopic technique to record the biochem-ical information in multiple regions of the brain, but for clinbiochem-ical applications, time is still a constraint. Investigations of neural injury in obstructive sleep apnea have revealed structural changes in the brain, but determining the neurochemical changes requires more detailed measurements across multiple brain regions, demonstrating a need for faster echo-planar J-resolved spectroscopic imaging. Hence, we have extended the compressed sensing reconstruction of prospectively undersampled 4D echo-planar J-resolved spectroscopic imaging to investigate metabolic changes in multiple brain locations of patients with obstructive sleep apnea and healthy controls.
MATERIALS AND METHODS: Nonuniform undersampling was imposed along 1 spatial and 1 spectral dimension of 4D echo-planar J-resolved spectroscopic imaging, and test-retest reliability of the compressed sensing reconstruction of the nonuniform undersampling data was tested by using a brain phantom. In addition, 9 patients with obstructive sleep apnea and 11 healthy controls were investigated by using a 3T MR imaging/MR spectroscopy scanner.
RESULTS:Significantly reduced metabolite differences were observed between patients with obstructive sleep apnea and healthy controls in multiple brain regions: NAA/Cr in the left hippocampus; total Cho/Cr and Glx/Cr in the right hippocampus; total NAA/Cr, taurine/Cr, scyllo-Inositol/Cr, phosphocholine/Cr, and total Cho/Cr in the occipital gray matter; total NAA/Cr and NAA/Cr in the medial frontal white matter; and taurine/Cr and total Cho/Cr in the left frontal white matter regions.
CONCLUSIONS: The 4D echo-planar J-resolved spectroscopic imaging technique using the nonuniform undersampling– based acquisi-tion and compressed sensing reconstrucacquisi-tion in patients with obstructive sleep apnea and healthy brain is feasible in a clinically suitable time. In addition to brain metabolite changes previously reported by 1D MR spectroscopy, our results show changes of additional metabolites in patients with obstructive sleep apnea compared with healthy controls.
ABBREVIATIONS:CS⫽compressed sensing; EPSI⫽echo-planar spectroscopic imaging; EP-JRESI⫽echo-planar J-resolved spectroscopic imaging; MRSI⫽ magnetic resonance spectroscopic imaging; NUS⫽nonuniform undersampling; OSA⫽obstructive sleep apnea; PRESS⫽point-resolved spectroscopy sequence; ProFit⫽prior-knowledge fitting; tCho⫽Cho⫹glycerylphosphocholine⫹phosphocholine; tNAA⫽NAA⫹N-acetyl aspartylglutamate
M
R spectroscopy has become a powerful tool for studying the underlying biochemistry of different tissues, a complemen-tary technique to MR imaging.1,2Single-voxel-based MRspec-troscopy techniques, such as stimulated echo acquisition mode and point-resolved spectroscopy sequence (PRESS) record
me-tabolite levels from a single VOI.3,4To increase the spatial
cover-age, MR spectroscopic imaging (MRSI) is used to simultaneously record spectra from different regions from a single section or a volume containing multiple sections.5In addition to the long
ac-quisition time, especially with MRSI, one major drawback of these 1D spectroscopic methods is the inherent overcrowding of spec-tra due to overlapping peaks. This limitation can be overcome by increasing the number of spectral dimensions to 2 by using 2D MR spectroscopy sequences such as localized J-resolved spectros-copy and localized correlated spectrosspectros-copy.6,7A limitation of the
single-voxel-based 2D MR spectroscopy sequences is that it takes
⬎15 minutes per VOI and recording 2D MR spectroscopy data from multiple VOIs could take hours.
Traditional 2D or 3D MRSI using conventional phase-encod-ing schemes takes an hour or longer for a sphase-encod-ingle scan, dependphase-encod-ing
Received September 8, 2013; accepted after revision October 23.
From the Departments of Radiological Sciences (M.K.S., R.N., R.K., J.P.V., J.F., M.A.T.) and Anesthesiology (R.K.), David Geffen School of Medicine; and School of Nursing (P.M.M.), University of California, Los Angeles, Los Angeles, California.
This research was partially supported by grants from the National Institutes of Health: 1R21NS080649-01A1 (M.A.T.) and 1R01NR013693-01A1 (P.M.M.).
Please address correspondence to M. Albert Thomas, PhD, Department of Radio-logical Sciences, David Geffen School of Medicine at UCLA, CHS BL 428, 10833 Le Conte Ave, Los Angeles, CA 90095-1721; e-mail: [email protected]
Indicates open access to non-subscribers at www.ajnr.org
on the number of spatial-encoding steps, averages, TRs, and other factors. The acquisition of 2D/3D MRSI has been greatly short-ened by using echo-planar spectroscopic imaging (EPSI), in which a time-varying readout gradient echo train interleaves the encoding of 1 spatial and 1 spectral (temporal) dimension, leaving the remaining spatial dimensions to be incrementally phase-en-coded.8,9Combining the speed advantage of the EPSI readout and
the increased spectral dispersion offered by 2D localized J-re-solved spectroscopy results in 4D echo-planar J-reJ-re-solved spectro-scopic imaging (EP-JRESI), which is capable of recording better-resolved 2D spectra from multiple regions.10,11In the EP-JRESI
sequence, the EPSI readout acquires 1 spatial (kx) and 1 temporal
(t2) dimension simultaneously, leaving the remaining spatial and
spectral dimensions (kyandt1, respectively) to be incrementally
collected. This leaves a scanning time on the order of 20⫹ min-utes, still somewhat limiting the clinical applicability.
During the past 7 years, compressed sensing (CS) has been successfully used for the reconstruction of nonuniformly under-sampled MR imaging and MRSI data.12-14Two major criteria
have been proposed for CS to be successfully applied: First, the data must have a sparse representation in some transform do-main; and second, the nonuniform undersampling (NUS) must be such that it produces incoherent aliasing artifacts within the transform domain. With these conditions, the fully sampled da-taset can be recovered by using nonlinear reconstruction algo-rithms that attempt to enforce the sparsity while simultaneously maintaining the fidelity of the original measurements to within the noise. NUS can be used in the individually phase-encoded (ky
t1) plane,by using CS to reconstruct the equivalent missing data
to a fully sampled 4D EP-JRESI acquisition.
We applied this approach in obstructive sleep apnea (OSA) syndrome, which affects approximately 10% of the adult popula-tion and leads to numerous health problems, including symptoms and comorbidities involving CNS impairment.15,16The causes of
OSA seem to be multifactorial,2and many clinical and
physio-logic characteristics of OSA appear to derive from brain abnor-malities, such as cognitive, mood, and autonomic problems. Many structural imaging studies have shown brain tissue changes at the voxel level, describing the nature of neural and axonal changes16-19in OSA, but to date, only a limited number of MR
spectroscopy– based studies can be found. The MR spectroscopy studies based mainly on 1D spectroscopy have reported differ-ences in NAA, Cho, and myo-Inositol relative to Cr in frontal, hippocampal, and occipital regions in OSA.2,19-22
Two goals of this study were as follows: 1) to further optimize the recently implemented NUS-based 4D EP-JRESI acquisition and CS reconstruction14for human brain and to determine the
reproducibility of CS reconstructions to quantify the cerebral me-tabolites by using the prior-knowledge fitting (ProFit) algo-rithm23-25; and 2) to evaluate the novel accelerated 4D
spectro-scopic imaging and nonlinear reconstruction in patients with OSA and healthy controls. We tested 2 hypotheses: 1) The NUS-based 4D EP-JRESI data acquisition and CS reconstruction will shorten the total acquisition duration from 51 to 12 minutes; and 2) the 4D EP-JRESI data with improved spectral dispersion will detect additional metabolites, including aspartate, glutathi-one, ascorbate,␥-aminobutyrate, glycerylphosphocholine,
gluta-mate, glutamine, phosphocholine, taurine, scyllo-Inositol, and ethanolamine groups, in comparison with the 1D EPSI.
MATERIALS AND METHODS
The 4D EP-JRESI sequence was modified to accommodate the NUS in thekyt1plane as described recently.
14To compare the
quality of the CS reconstructed NUS EP-JRESI data, we collected fully encoded phantom data together with prospectively under-sampled phantom scans. Furthermore, numerous retrospective undersampling and reconstructions were performed on a fully sampled brain EP-JRESI phantom dataset to assess the reproduc-ibility. To determine the usefulness of the CS reconstructed data, we performed visual analysis of the 2D spectra followed by quan-titative analysis by using the ProFit algorithm.23-25All data were
acquired on a 3T Trio-Tim MR spectroscopy/MR imaging scan-ner (Siemens, Erlangen, Germany) by using the VB17a compiler (Siemens) with an 8-channel head “receive” coil.
Theory
The reconstructed image, denotedu, in CS MR imaging is a solu-tion to the constrained optimizasolu-tion problem as shown below:
1) arg min
u 储⌿
u储1s.t.储Fpu⫺d储2 2⬍,
where⌿ is the sparsity transform (in which the final recon-structed data,u, is sparse),Fpis the partial Fourier measurement operator,dis the undersampled data collected from the scanner, is a fidelity factor, and储x储nis theᐉnnorm.
In this work, we performed the CS reconstruction by using total variation (TV) as a regularizer and by enforcing the sparsity in the identity domain. A similar approach of using identity ma-trix for sparsity has been reported for 2D nuclear MR spectra.26
Consequently, the constrained problem in equation 1 can be writ-ten as an unconstrained problem,
2) arg min
u
␣TV共u兲⫹储u储1⫹
2储Fpu⫺d储22,
where␣,are positive parameters,is a regularization parameter that weighs the sparsity against the data consistency,u⫽R(x,y,
F1,F2) is the final dataset,Fpis applied only along theyandF1
dimensions, andd⫽r(x,ky,t1,F2) is the sampled data.
As discussed recently,14the final 4D dataset,R(x,y,F 1,F2)⫽
F{r(kx,ky,t1,t2)}, is composed of 2 spatial and 2 spectral
dimen-sions in a fully sampled EP-JRESI sequence. For every point in the
xyspatial plane (voxel), there is a 2DJ-resolved spectrum (F1,F2).
Due to the NUS, the (kyt1) plane will have incoherent aliasing in
theyF1plane following Fourier transformation.
k-Space Sampling Scheme
We used an exponentially decaying sampling density scheme to downsample the fully sampled 4D EP-JRESI data from the brain phantom for retrospective study and also for the prospective in vivo study.
The sampling scheme is defined as
3) 共ky,t1兲⫽e
where(ky,t1) is the probability that a data point is sampled and
⫺ky,maxⱕkyⱕky,max, 0ⱕt1ⱕt1,maxandaandbare flexible
parameters that determine the acquired percentage of data. The NUS data were simulated by zeroing data points in the fully sam-pledkyt1plane for reduction factors corresponding to retention of
25% of the original full sampled data with the exponentially de-caying sampling density scheme described above (Fig 1A).
Phantom
A 500-mL brain phantom was prepared, containing the following metabolites at physiologic concentrations as reported in healthy
human brain23,27: Cr (7 mmol/L), NAA (8.9 mmol/L),
N-acetyl-aspartylglutamate (0.51 mmol/L), glutamate (12.5 mmol/L), glutamine (2.5 mmol/L), mIns (4.4 mmol/L), Cho (0.9 mmol/L), phosphocholine (0.6 mmol/L), taurine (1.8 mmol/L), glutathione (2.0 mmol/L), glucose (1.0 mmol/L), lactate (1.0 mmol/L),
␥-aminobutyrate (0.7 mmol/L), aspartate (2.1 mmol/L), phos-phoethanolamine (1.0 mmol/L), and threonine (0.3 mmol/L). Both fully sampled and prospectively undersampled phantom scans were recorded by using the following parameters: a 1⫻1⫻ 2 cm3voxel for VOI localization, 64t
1increments with⌬t1⫽1 ms,
512 bipolar echo-pairs with a TR of 0.84 ms, FOV⫽16⫻16 cm2,
a section thickness of 2 cm, andF1andF2bandwidths of 1000 Hz
and 1190 Hz, respectively. With TR/TE⫽3 s/30 ms and 1 average, the EP-JRESI phantom scan duration for fully sampled studies was approximately 51 minutes, and for 25% undersampled stud-ies, it was 12 minutes. The voxel shim and suppression were done manually, and a line width of 4 – 6 Hz was achieved. A non-water-suppressed scan was also acquired to correct for eddy currents generated by the EPSI readout and as a reference for coil combi-nation. Additionally, to validate the accuracy of the localization of NUS based EP-JRESI sequence and CS reconstruction, the se-quence was performed on a quad phantom consisting of 4 highly concentrated (50 mM) metabolite phantoms (Cho, Cr, NAA, and lactate) submerged in a water bath.10
In Vivo
To determine the applicability in a clinical environment, the NUS-based 4D EP-JRESI acquisition and CS reconstruction were tested in the brains of 11 healthy controls (50.3⫾7.9 years of age) and 9 patients with OSA (55⫾9.6 years). Patients with OSA were recruited following a diagnostic sleep study at the UCLA Sleep Disorders Center, based on full overnight polysomnography, scored according to current American Academy of Sleep Medi-cine criteria. Subjects had experienced OSA for at least 5 years. The mean apnea/hypopnea index was 30.8⫾15.4 events/h, the
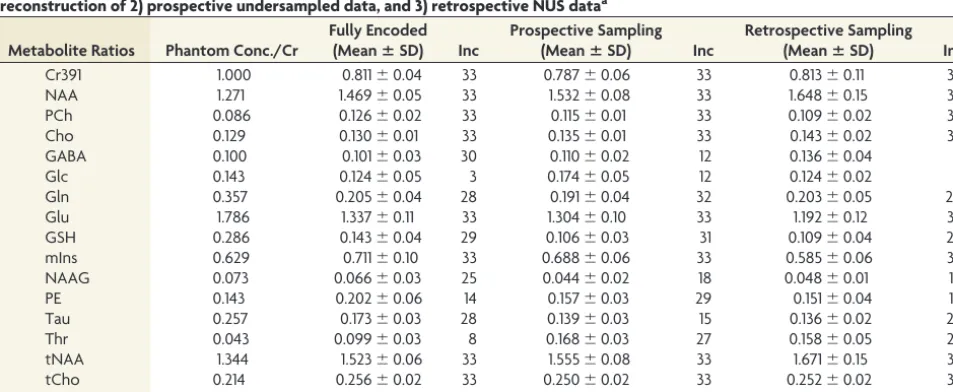
[image:3.594.54.285.193.398.2]FIG 1.A, The mask used to undersample thekyt1plane, where the white points indicate those that were sampled. B,The multivoxel spatial distribution of 2D diagonal peaks of Cr and Cho at 3.0/3.2 ppm overlaid on the T1-weighted axial MR imaging, with the white box indicating the PRESS localization of prospectively undersampled data with only 25% of the samples as required by the Nyquist-Shannon criterion.C,CS reconstruction of the same data.
Table 1: Reproducibility of the in vitro quantification of brain phantom metabolites for the following: 1) fully encoded data, CS reconstruction of 2) prospective undersampled data, and 3) retrospective NUS dataa
Metabolite Ratios Phantom Conc./Cr
Fully Encoded
(MeanⴞSD) Inc
Prospective Sampling
(MeanⴞSD) Inc
Retrospective Sampling
(MeanⴞSD) Inc
Cr391 1.000 0.811⫾0.04 33 0.787⫾0.06 33 0.813⫾0.11 33
NAA 1.271 1.469⫾0.05 33 1.532⫾0.08 33 1.648⫾0.15 33
PCh 0.086 0.126⫾0.02 33 0.115⫾0.01 33 0.109⫾0.02 33
Cho 0.129 0.130⫾0.01 33 0.135⫾0.01 33 0.143⫾0.02 33
GABA 0.100 0.101⫾0.03 30 0.110⫾0.02 12 0.136⫾0.04 8
Glc 0.143 0.124⫾0.05 3 0.174⫾0.05 12 0.124⫾0.02 6
Gln 0.357 0.205⫾0.04 28 0.191⫾0.04 32 0.203⫾0.05 28
Glu 1.786 1.337⫾0.11 33 1.304⫾0.10 33 1.192⫾0.12 33
GSH 0.286 0.143⫾0.04 29 0.106⫾0.03 31 0.109⫾0.04 25
mIns 0.629 0.711⫾0.10 33 0.688⫾0.06 33 0.585⫾0.06 33
NAAG 0.073 0.066⫾0.03 25 0.044⫾0.02 18 0.048⫾0.01 14
PE 0.143 0.202⫾0.06 14 0.157⫾0.03 29 0.151⫾0.04 14
Tau 0.257 0.173⫾0.03 28 0.139⫾0.03 15 0.136⫾0.02 22
Thr 0.043 0.099⫾0.03 8 0.168⫾0.03 27 0.158⫾0.05 23
tNAA 1.344 1.523⫾0.06 33 1.555⫾0.08 33 1.671⫾0.15 33
tCho 0.214 0.256⫾0.02 33 0.250⫾0.02 33 0.252⫾0.02 33
Glx 2.143 1.514⫾0.13 33 1.495⫾0.09 33 1.363⫾0.11 33
Note:—Cr391 indicatesN-methylene peak of Cr at 3.9 ppm; PCh, phosphocholine; GABA,␥-aminobutyrate; Gln, glutamine; GSH, glutathione; PE, phosphoethanolamine; Tau, taurine; SD, interscan standard deviation of the 33 spectra from 11 measurements; Conc., concentration; Inc, number of included spectra in the analysis; Glu, glutamate; Glc, glucose; NAAG,N-acetyl aspartylglutamate; Thr, threonine.
[image:3.594.54.531.500.696.2]SaO2nadir was 82.7⫾8.5%, and the baseline SaO2was 95.2⫾
1.8%. Patients had no history of head injury or neurologic illness. Daytime sleepiness was measured with the Epworth Sleepiness Scale (9.0⫾4.4). Any evidence of clinical brain pathology was cause for exclusion. An unpublished study of WM hyperintensities including these patients revealed no significant differences relative to matched controls. Written informed consent was obtained before study par-ticipation, and all data were acquired in accordance with the institu-tional review board approved protocol.
Before applying the NUS-based EP-JRESI sequence, we col-lected 3D high-resolution T1-weighted images for localization by using an MPRAGE pulse sequence. EP-JRESI was performed over 2 sections: 1) an axial section covering the frontal, basal ganglia, and occipital regions; and 2) a coronal section covering the hip-pocampi, thalami, and so forth. The FOV was 24⫻24 cm2with
16⫻16 grids with a section thickness of 1.5 cm, resulting an individual voxel size of 1.5⫻1.5⫻1.5 cm3; 512 bipolar field echo
pairs were collected with a repeat time of 0.84 ms andF1andF2
bandwidths of 1000 Hz and 1190 Hz, respectively. The fully
sam-pled data consisted of 64t1increments. For the prospective
un-dersampling scheme, the 4D EP-JRESI sequence acquired 25% of the fully sampled data only according to the sampling density in equation 3. With TR/TE⫽1.5 s/30 ms and 2 averages, the NUS-based EP-JRESI scan duration was approximately 12 minutes. The voxel shim and suppression were done manually, and a line width of 12–14 Hz was achieved for coronal and of 16 –18 Hz for axial sections, respectively. A non-water-suppressed scan was also acquired for eddy current correction and as a reference for coil combination by fully samplingkywith only the firstt1increment,
adding 30 seconds to the total scanning duration. Acquired data were postprocessed by using a custom Matlab-based program (MathWorks, Natick, Massachusetts), which applied spatial Hamming and spectral apodization filters to smooth the data. The metabolite differences between patients with OSA and healthy controls were tested with a 2-tailedttest by using the Statistical Package for the Social Sciences software, Version 20.0 (IBM, Ar-monk, New York). APvalue⬍.05 was considered statistically significant.
[image:4.594.57.528.51.448.2]Reconstruction
The 4D NUS EP-JRESI data were reconstructed by using the Split Bregman method forᐉ1regularized problems.28The detailed
de-scription of the method and the implemented algorithm can be found in Goldstein and Osher.28The␣andparameters in
equa-tion 2 were chosen empirically and, over a reasonably broad range, did not have a significant effect on reconstruction accu-racy. For all our phantom and in vivo experiments, the recon-struction parameters were the same:⫽1,␣⫽1/50, and⫽ 1/1000.
Quantitation
For a quantitative comparison of the CS reconstructed human brain and phantom data, a modified ProFit algorithm was used to calculate metabolite in vivo and in vitro concentrations. It fits 2D spectra as linear combinations of 2D basis spectra by using a non-linear squares algorithm in combination with a non-linear least-squares algorithm and incorporates the maximum prior knowl-edge available. Before fitting, frequency shifts inF1andF2and
zero-order phase correction were applied to the extracted 2D J-resolved spectra from the 4D EP-JRESI data. The basis spectra used for fitting were simulated numerically with the General Ap-proach to MR Mathematical Analysis Library (http://gamma. ethz.ch/),29by using previously reported chemical shifts and
cou-pling constants from the literature.27For quantitation of the in
vivo and phantom data, we created sepa-rate basis sets. While for phantom data analysis, the basis set contains the same metabolites as in the original phantom, for the in vivo data fitting, a set of 20 basis metabolites turned out to be the most suitable choice: Cr, NAA, phosphocho-line, Cho, aspartate, ␥-aminobutyrate, Glc, glutamine, glutamate, glutathione, lactate, mIns,N-acetyl aspartylglutamate, phosphoethanolamine, scyllo-Inositol, alanine, glycerylphosphocholine, ascor-bate, glycine, and taurine. Metabolite concentrations were determined as ratios to the Cr peak at 3 ppm taurine, and no absolute quantification was attempted here even though they can be calculated using the reported concentrations of Cr.23
RESULTS
Phantom
Figure 1Ashows the mask used to under-sample the kyt1 plane where the white
points indicate the data points that were sampled. The 4D EP-JRESI dataset con-tains 16 ⫻ 16 voxels, with each voxel containing an individual 2D J-resolved spectrum. Figure 1Bshows the spatial dis-tribution of the 2D diagonal peaks of Cr and Cho overlaid on the T1-weighted ax-ial MR image after fast Fourier transform of the prospectively undersampled data with 4⫻acceleration. The white box indi-cates the VOI localization achieved by PRESS with 3 section-selective radio-frequency pulses. The CS reconstruction of the same undersampled data is shown in Fig 1C. With unacquiredk-space locations filled with zeroes before Fou-rier transformation, the effect of NUS leads to incoherent aliasing as shown in Fig 1B. Signal leakage takes place along theF1
dimen-sion, and incoherent aliasing, along theydimension. The recon-structed metabolite map of the 2D diagonal peaks of Cr and Cho exhibited spatial profiles similar to that of the original over the range of accelerations, showing that the CS reconstruction suc-cessfully cleans up the incoherent aliasing produced by the NUS. Due to the altered point spread function and chemical shift arti-facts, there is a slight leakage in the CS constructed data because the peaks with the brightest intensity still appear within the PRESS excitation volume marked by the white box.
The reliability of the CS reconstructed 4D EP-JRESI data was investigated by using the ProFit algorithm. Table 1 shows a com-parison of metabolite ratios with respect to Cr calculated by ProFit for the fully sampled, prospective 4⫻accelerated, and ret-rospective 4⫻accelerated datasets. The CS reconstructed spectra were of high quality, with metabolite ratios matching the fully encoded data closely. The interscan SD was small for the predom-inant singlets (⬍10%). Most other metabolites were detectable with SD values in the range of 10%–20%.
[image:5.594.58.369.49.390.2]OSA and Healthy Brain In Vivo
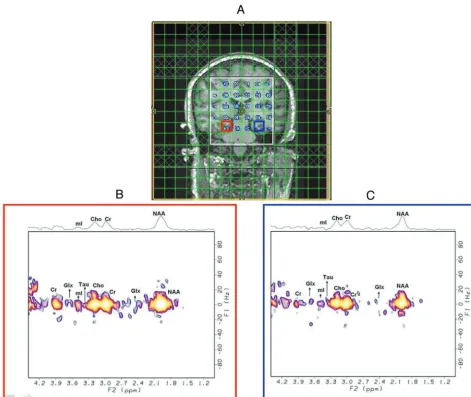
Figure 2Ashows the spatial map of 2D diagonal peaks of Cr and Cho from the CS reconstruction of the prospectively under-sampled data of a 39-year-old healthy brain overlaid onto a T1-weighted MR imaging localization image covering the hippocam-pus/thalamus regions. As observed in the phantom, the peaks were localized within the PRESS excitation volume (white box) with minimal leakage. The extractedJ-resolved spectra from the right and left hippocampi are shown in Fig 2B, -C. The extracted in vivo 2D spectra showed less sensitive peaks than those recorded in the phantom scans. However, most of the metabolites of inter-est were detected with acceptable SNR as evidenced by the SD. Figure 3A, -Bshows cerebral metabolite ratios with respect to Cr over the left and right hippocampi regions in the healthy controls and patients with OSA. Metabolites with higher physiologic con-centrations, including Glx, NAA, and mIns, had acceptable coef-ficients of variation of⬍20%. In agreement with earlier 1D MR spectroscopy findings, the patients with OSA showed differences in tNAA, mIns, Cho, tCho, and Glx compared with healthy
con-trols.2,19-22We found significantly (P⬍.05) decreased NAA/Cr
ratios in left hippocampus and decreased tCho/Cr, Glx/Cr ratios in the right hippocampus while observing a trend of decreased tCho/Cr, Glx/Cr in the left hippocampus and decreased NAA/Cr in right the hippocampus. We also observed a trend of decreased tNAA/Cr, glycerylphosphocholine/Cr, phosphocholine/Cr and increased mIns/Cr in both hippocampi regions.
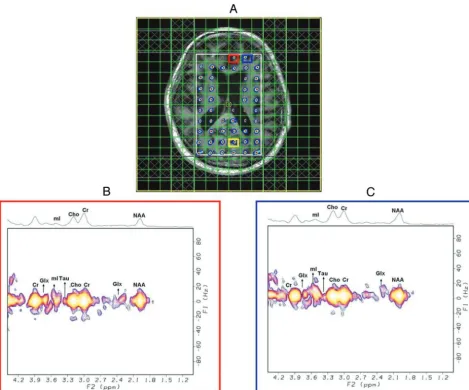
Figure 4Ashows a multivoxel display, in a 69-year-old patient with OSA, of the 2D diagonal NAA peak (2.0 ppm) after the CS reconstruction of an undersampled in vivo brain scan at 4⫻ ac-celeration, covering the frontal/occipital regions, with the data overlaid on the T1-weighted MR image. Two representative spec-tra exspec-tracted from the medial frontal gray and dorsolateral pre-frontal WM regions are shown in Fig 4B, -C. The overall quality of the spectra was good, with minimal leakage, and many metabo-lites were visible. Table 2 shows the metabolite ratios of patients with OSA and healthy controls in the occipital gray, medial frontal gray, and left frontal white matter regions. We found significantly decreased tNAA/Cr, taurine/Cr, scyllo-Inositol/Cr,
[image:6.594.59.529.51.441.2]line/Cr, and tCho/Cr in the occipital gray matter in patients with OSA compared with healthy controls. In the medial frontal gray matter location, significantly decreased tNAA/Cr and NAA/Cr were found in the patients with OSA compared with healthy controls. Significantly decreased taurine/Cr and tCho/Cr were also observed in the patients with OSA com-pared with healthy controls in the left frontal WM region. Fig-ure 5 shows spectroscopic images of the quad phantom with each peak data acquired using the EP-JRESI sequence and re-constructed with CS. It can be seen that the peaks are localized nicely within each of the phantom and the PRESS localization white box. This gives another proof of the reliability of CS reconstructed 4D EP-JRESI data. Figure 6 demonstrates results from ProFit quantitation of a 4D EP-JRESI data set from the right hippocampus of a patient with OSA showing the original, fitted and residual spectra.
DISCUSSION
Conventional EPSI readout facilitates inherent acceleration of one of the spatial and spectral dimensions. By imposing the NUS scheme along the incremented spectral and spatial dimensions, we have demonstrated that a further acceleration of the 4D EP-JRESI sequence is feasible for brain applications in vivo, making it clinically applicable. We first validated our acquisition approach and the CS reconstruction results by using brain phantoms, followed by a quantitative analysis by using ProFit demonstrating the feasibil-ity of extending the algorithm to a multidimensional dataset. The CS-based EP-JRESI sequence has been implemented previously in the human prostate.14This is the first time that this approach has
been tested and implemented successfully in OSA. Compared with that of the prostate gland, human brain spectroscopic imaging is more complex structurally and sensitivity-wise. Consequently, it is more technically challenging to implement and validate the CS-EP-JRESI sequence in human brain and to evaluate the metabolite changes in OSA compared with healthy controls.
The overall quality and resolution of the reconstructed spectra were comparable to the fully sampled dataset as shown for the brain phantom retrospective and prospective studies, indicating a successful implementation of CS in reconstructing the NUS-based EP-JRESI data. A detailed discussion of the acceleration factor, SNR, and their effect on CS reconstruction was presented recently.14For some of the J-coupled metabolites, there were a
few over- and underestimations of metabolite ratios by the ProFit algorithm, which could be due to several factors: 1)A TR of 3 seconds was not enough for the magnetization of different metab-olites to recover fully; 2) differential T2-weighting occurs along the incrementedt1dimension for encoding the second spectral
dimension; and 3) the signal overlap is a concern even at 3T field strength. In agreement with the previous work by Schulte and Boesiger,23a few metabolites such as aspartate, Glc, and lactate
were not reliably detected in the phantom. Despite only using 25% of the original data, reconstructed datasets demonstrated the expected metabolic features characteristic of patients with OSA in comparison with healthy subjects. This study, therefore, demon-strates the feasibility of reducing scanning times in multidimen-sional spectroscopic imaging sequences and its applicability in both healthy and diseased human brain tissue.
This pilot study demonstrates clearly that several cerebral metab-olites can be quantified by using the ProFit algorithm that have not been clearly demonstrated by 1D MR spectroscopy studies of OSA.
[image:7.594.54.533.66.183.2]FIG 5. Results from quad-phantom experiments containing 4 metab-olites, NAA, Cr, Cho, lactate, submerged in a water bath. It shows the multivoxel spatial distribution of 2D diagonal peaks of NAA (bottom right), Cr (bottom left), Cho (top right), and lactate (top left) overlaid on the T1-weighted coronal MR image, with the white box indicating the PRESS localization of CS reconstructed 4D EP-JRESI data at 4⫻ acceleration.
Table 2: Selected ProFit-quantified metabolite ratios (meanⴞSD) calculated from predominantly the occipital and medial frontal gray matter regions and the prefrontal WM (left) of 9 patients with OSA and 11 healthy controls
Metabolite Ratios
Occipital Gray Matter Medial Frontal Gray Matter Left Frontal White Matter
OSA HC OSA HC OSA HC
tNAA 1.793⫾0.39a 2.158⫾0.54 0.949⫾0.26a 1.268⫾0.17 1.190⫾0.28 1.323⫾0.31
Glx 1.637⫾0.41 1.451⫾0.58 1.531⫾0.48 1.289⫾0.49 1.658⫾0.40 1.661⫾0.45
tCho 0.192⫾0.05a 0.252⫾0.09 0.317⫾0.08 0.346⫾0.09 0.236⫾0.05a 0.346⫾0.06 NAA 1.510⫾0.42 1.893⫾0.43 0.744⫾0.30a 1.052⫾0.25 0.904⫾0.26 0.950⫾0.28
mIns 0.634⫾0.28 0.493⫾0.21 1.792⫾0.65 1.536⫾0.42 1.545⫾0.31 1.496⫾0.39
Tau 0.140⫾0.0a 0.421⫾0.20 0.627⫾0.24 0.906⫾0.37 0.341⫾0.12a 0.826⫾0.38
sI 0.038⫾0.01a 0.052⫾0.01 0.099⫾0.04 0.117⫾0.05 0.073⫾0.02 0.102⫾0.03
GPC 0.160⫾06 0.169⫾0.07 0.181⫾0.10 0.210⫾0.09 0.170⫾0.10 0.135⫾0.09
PCh 0.064⫾0.02a 0.125⫾0.05 0.079⫾0.02 0.151⫾0.04 0.228⫾0.09 0.076⫾0.048 Note:—HC indicates healthy controls; GPC, glycerylphosphocholine; PCh, phosphocholine; sI, scyllo-Inositol; Tau, taurine.
[image:7.594.53.285.212.438.2]Previous studies in patients with OSA reported abnormalities with varying results in terms of type and location,30-33and mostly single
voxels were studied. Our findings by using multivoxel 2D MR spec-troscopy are in broad agreement with the literature and are consis-tent with the known phenomenon of oxidative stress in OSA.34
We observed significantly decreased tNAA/Cr ratios in the oc-cipital gray matter and medial frontal gray matter regions and a reduced NAA/Cr ratio in the medial frontal gray matter and left hippocampus in patients with OSA compared with healthy con-trols. Reduced NAA/Cr is in agreement with previous MR spectros-copy studies obtained in the frontal WM of patients with OSA.21,30-32
The reduced NAA/Cr ratio is indicative of neuronal dysfunction and axonal damage in those regions, presumably consequent to known repeated episodes of hypoxia in patients with OSA.30,31Alchanatis et
al32showed lower Cho/Cr ratios in the frontal WM of patients with
OSA compared with healthy volunteers. They also found signifi-cantly reduced absolute concentrations of Cho in the frontal WM of patients with sleep apnea. O’Donoghue et al2also demonstrated
de-creased Cho/Cr ratios in the hippocampal area of patients with OSA. We also found a significantly decreased tCho/Cr ratio in occipital gray matter, left frontal WM, and the right hippocampus and de-creased phosphocholine/Cr in the occipital gray matter of patients with OSA compared with healthy controls. Decreased Cho/Cr and tCho/Cr ratios may result from loss of myelin lipids or dysfunction of phospholipid metabolism.32
Alchanatis et al32reported increased mIns/Cr in subjects with
OSA, in agreement with our study. Additionally, our findings show significantly decreased ratios of scyllo-Inositol/Cr in occipital gray matter, taurine/Cr in the left frontal WM and occipital gray matter, and Glx/Cr in the right hippocampus in patients with OSA compared with healthy controls. The increased mIns/Cr ratio may be a reflection of membrane breakdown and reactive gliosis.21Studies
with more patients with OSA and controls are required to follow the results of decreased scyllo-Inositol/Cr, taurine/Cr, Glx/Cr ratios and increased phosphoethanolamine/Cr ratio because these have not
been reported in any of the OSA single-voxel studies, to our knowledge. We also calculated the metabolite ratios in right frontal WM, left and right occipital WM, and right and left thalami and found similar trends.
Antioxidants such as glutathione and ascorbate, neurotransmitters such as
␥-aminobutyrate, and glutamine are also quantifiable by using the ProFit quantita-tion of 2D J-resolved spectra. An in-creased oxidized glutathione disulfide-to-reduced glutathione ratio may be due to oxidative stress.35 Even though the
re-duced glutathione is observable by MR spectroscopy, it is not clear whether the oxidized glutathione concentration is suf-ficiently high to be detected by MR spec-troscopy. ␥-aminobutyrate and glu-tamine are the other 2 metabolites that are related to OSA. Recently, a new study showed that␥-aminobutyrate levels are reduced in adults with chronic primary insomnia, which has been linked to OSA.36It has also been reported that increased
glu-tamine levels stimulate the brain, hampering deep sleep. Fatty acids produced under hypoxia are primarily synthesized from glutamine carbon via the reductive pathway. In our study, we have not found any changes in␥-aminobutyrate and glutamine.
Our pilot OSA data demonstrate the initial preclinical feasibil-ity of using the accelerated EP-JRESI and a nonlinear CS recon-struction algorithm for brain metabolic imaging. Our study has several limitations: 1) A small group of patients with OSA and healthy controls were investigated. Hence, validation by using a larger study cohort is required. 2) The study design involving the masking scheme and nonlinear reconstruction may need more opti-mization to further improve the overall performance. 3) The ProFit algorithm included prior-knowledge spectra of only metabolites. Hence, addition of prior-knowledge for macromolecules and lipids may improve the accuracy of quantitation.37
CONCLUSIONS
In this pilot study of CS-reconstructed 4D NUS EP-JRESI, we have shown that CS can successfully be applied to the nonuni-formly undersampled EP-JRESI data in the human brain. Despite using only 25% of the original data, reconstructed datasets show the expected metabolic features in healthy controls and subjects with OSA, showing that the 4D EP-JRESI sequence may be clini-cally feasible. Further optimization of the sampling density and reconstruction algorithms may allow even greater reduction in the minimum amount of data required for reconstruction and may further shorten scanning times.
ACKNOWLEDGMENTS
We acknowledge the scientific support of Brian Burns, Neil Wil-son, and Jenny Li.
Disclosures: Paul M. Macey—RELATED:Grant:National Institutes of Health,* Sup-port for Travel to Meetings for the Study or Other Purposes: UCLA,Comments: FIG 6. A ProFit-processed 4D EP-JRESI spectrum recorded from the right hippocampus of a patient
[image:8.594.63.360.46.268.2]internal funds for travel,UNRELATED:Consultancy: colleagues in Australia (Univer-sity of Western Sydney, Univer(Univer-sity of Sydney),Comments: receive approximately $5000 per year for consulting on MRI analysis,Grants/Grants Pending: National Institutes of Health,Comments: multiple submissions pending and coinvestigator on some other grants,Patents (planned, pending or issued): UCLA,*Comments: patent pending,UNRELATED: Travel/Accommodations/Meeting Expenses Unrelated to Activities Listed: UCLA,Comments: internal travel funds. Michael A. Thomas— RELATED:Grant: National Institutes of Health/National Institute of Neurological Disorders and Stroke, R21 grant, Comments: 10% salary support,UNRELATED: Grants/Grants Pending: National Institutes of Health R01 entitled “Non-linear Re-construction For Accelerated MR Spectroscopic Imaging of Sleep Apnea,” Com-ments: Proposal #1R01HL122553– 01, submitted on June 5, 2013.*Money paid to the institution.
REFERENCES
1. Soares DP, Law M.Magnetic resonance spectroscopy of the brain: review of metabolites and clinical applications. Clin Radiol
2009;64:12–21
2. O’Donoghue FJ, Wellard RM, Rochford PD, et al.Magnetic reso-nance spectroscopy and neurocognitive dysfunction in obstructive sleep apnea before and after CPAP treatment.Sleep2012;35:41– 48 3. Frahm J, Bruhn H, Gyngell ML, et al.Localized high-resolution pro-ton NMR spectroscopy using stimulated echoes: initial applica-tions to human brain in vivo.Magn Reson Med1989;9:79 –93 4. Bottomley PA.Spatial localization in NMR spectroscopy in vivo.
Ann N Y Acad Sci1987;508:333– 48
5. Brateman L.Chemical shift imaging: a review.AJR Am J Roentgenol
1986;146:971– 80
6. Ryner LN, Sorenson JA, Thomas MA.Localized 2D J-resolved 1H MR spectroscopy: strong coupling effects in vitro and in vivo.Magn Reson Imaging1995;13:853– 69
7. Thomas MA, Yue K, Binesh N, et al.Localized two-dimensional shift correlated MR spectroscopy of human brain.Magn Reson Med
2001;46:58 – 67
8. Mansfield P.Spatial mapping of the chemical shift in NMR.Magn Reson Med1984;1:370 – 86
9. Posse S, Tedeschi G, Risinger R, et al.High speed 1H spectroscopic imaging in human brain by echo planar spatial-spectral encoding.
Magn Reson Med1995;33:34 – 40
10. Lipnick S, Verma G, Ramadan S, et al.Echo-planar based correlated spectroscopic imaging (EP-COSI): implementation and pilot eval-uation in human calf muscle.Magn Reson Med2010;64:947–56 11. Nagarajan R, Furuyama J, Margolis D, et al.Echo planar based J
resolved and correlated spectroscopic imaging of human prostate using external coil.In:Proceedings of the 19th Annual Meeting of the International Society for Magnetic Resonance in Medicine, May 6 –13, 2011; Montreal, Quebec, Canada: 2801
12. Donoho D. Compressed sensing. IEEE Trans Info Theory 2006; 52:1289 –306
13. Lustig M, Donoho D, Pauly JM.Sparse MRI: the application of com-pressed sensing for rapid MR imaging.Magn Reson Med2007; 58:1182–95
14. Furuyama J, Wilson N, Burns B, et al.Application of compressed sensing to multidimensional spectroscopic imaging in human prostate in vivo.Magn Reson Med2012;67:1499 –505
15. Anderson KN, Bradley AJ.Sleep disturbance in mental health prob-lems and neuro-degenerative disease.Nat Sci Sleep2013;5:61–75 16. Saboisky JP, Butler JE, Gandevia SC, et al.Functional role of neural
injury in obstructive sleep apnea.Front Neurol2012;3:95
17. Cross Rl, Kumar R, Macey PM, et al.Neural alterations and
depres-sive symptoms in obstructive sleep apnea patients. Sleep2008; 31:1103– 09
18. Harper RM, Macey PM, Henderson LA, et al.fMRI responses to cold pressor challenges in control and obstructive sleep apnea subjects.
J Appl Physiol2003;94:1583–95
19. Malhotra A, White DP. Obstructive sleep apnea. Lancet 2002; 360:237– 45
20. Sharma SK, Danishad SK, Sharma U, et al.Proton magnetic reso-nance spectroscopy of brain in obstructive sleep apnea in north Indian Asian subjects.Indian J Med Res2010;132:278 – 86 21. Sarchielli P, Presciutti O, Alberti A, et al.A 1H magnetic resonance
spectroscopy study in patients with obstructive sleep apnea.Eur J Neurol2008;15:1058 – 64
22. Bartlett DJ, Rae C, Thompson CH, et al.Hippocampal area metabo-lites relate to severity and cognitive function in obstructive sleep apnea.Sleep Med2004;5:593–96
23. Schulte RF, Boesiger P.ProFit: two-dimensional prior-knowledge fitting of J-resolved spectra.NMR Biomed2006;19:255– 63 24. Sarma MK, Huda A, Nagarajan R, et al.Multi-dimensional MR
spectroscopy: towards a better understanding of hepatic encepha-lopathy.Metab Brain Dis2011;26:173– 84
25. Nagarajan R, Sarma MK, Thomas MA, et al.Neuropsychological function and cerebral metabolites in HIV-infected youth.J Neuro-immune Pharmacol2012;7:981–90
26. Qu X, Guo D, Cao X, et al.Reconstruction of self-sparse 2D NMR spectra from undersampled data in the indirect dimension.Sensors (Basel)2011;11:8888 –909
27. Govindaraju V, Young K, Maudsley AA.Proton NMR chemical shifts and coupling constants for brain metabolites.NMR Biomed
2000;13:129 –53
28. Goldstein T, Osher S.The Split Bregman method for L1-regularized problems.Siam Journal on Imaging Sciences2009;2:323– 43 29. Smith SA, Levante TO, Meier BH, et al.Computer simulations in
magnetic-resonance. An object-oriented programming approach.J Magn Reson A1994;106:75–105
30. Kamba M, Suto Y, Ohta Y, et al.Cerebral metabolism in sleep apnea: evaluation by magnetic resonance spectroscopy.Am J Respir Crit Care Med1997;156:296 –98
31. Kamba M, Inoue Y, Higami S, et al.Cerebral metabolic impairment in patients with obstructive sleep apnoea: an independent associa-tion of obstructive sleep apnoea with white matter change.J Neurol Neurosurg Psychiatry2001;71:334 –39
32. Alchanatis M, Deligiorgis N, Zias N, et al.Frontal brain lobe impair-ment in obstructive sleep apnoea: a proton MR spectroscopy study.
Eur Respir J2004;24:980 – 86
33. Tonon C, Vetrugno R, Lodi R, et al.Proton magnetic resonance spectroscopy study of brain metabolism in obstructive sleep ap-noea syndrome before and after continuous positive airway pres-sure treatment.Sleep2007;30:305–11
34. Zhang J, Veasey S.Making sense of oxidative stress in obstructive sleep apnea: mediator or distracter?Front Neurol2012;3:179 35. Mandal PK, Tripathi M, Sugunan S.Brain oxidative stress: detection
and mapping of anti-oxidant marker ‘glutathione’ in different brain regions of healthy male/female, MCI and Alzheimer patients using non-invasive magnetic resonance spectroscopy.Biochem Bio-phys Res Commun2012;417:43– 48
36. Plante DT, Jensen JE, Winkelman JW.The role of GABA in primary insomnia.Sleep2012;35:741– 42