Automating Object-Oriented Design Heuristics for .NET
Programs
November 6, 2006
Sarah Frater
Department of Computer Science and Software Engineering
University of Canterbury, Christchurch, New Zealand
Abstract
Software size and complexity are major factors that contribute to the difficulty of software development. These factors, along with the intangible nature of software, make it challenging for developers to analyse the quality of their systems. Object Oriented design heuristics have been recognised as an informal, yet effective method for establishing whether or not a particular designfeels right. In our research, we investi-gate the ability to automate the analysis of software with respect to these heuristics, in an effort to support design decisions, and reduce the cognitive overhead involved in understanding large complex systems.
The implemented architecture incorporates a .NET Semantic Model that was developed in earlier re-search. This application captures and formalises a model based on the Microsoft Intermediate Language (MSIL). By taking advantage of this model in our research, we are able to automate and visualise heuristics for multiple programming languages and provide an environment for cross-language comparisons, without the loss of rigour.
Contents
1 Introduction 1
1.1 Research Objectives . . . 1
1.2 Report Outline . . . 2
2 Background 3 2.1 The Software Design Problem . . . 3
2.2 Object-Oriented Programming . . . 3
2.2.1 Benefits of OOP . . . 3
2.2.2 Problems with OOP . . . 4
2.3 Object Oriented Design Heuristics . . . 4
2.3.1 Human Factors . . . 4
2.3.2 Relation to Design Metrics . . . 5
2.4 The Microsoft .NET Framework . . . 5
2.5 Static Analysis . . . 5
2.5.1 Java Symbol Table . . . 6
2.5.2 A .NET Semantic Model . . . 6
3 Design and Implementation 7 3.1 Automating Design Heuristics . . . 7
3.1.1 Parameterising Heuristics . . . 7
3.2 Architecture . . . 8
3.2.1 Capturing Software Information . . . 8
3.2.2 Computing Heuristics . . . 8
3.2.3 Visualisation . . . 9
4 Application 13 4.1 Refining the Heuristic . . . 13
4.2 Parameterising the Heuristic . . . 13
4.3 Data Capture . . . 13
4.4 Metrics and Filters . . . 13
4.5 Heuristic Computation . . . 13
4.6 Visualisation and Representation . . . 15
5 Limitations and Future Work 17 5.1 Limitations . . . 17
5.2 Future Research . . . 17
5.2.1 Extending our Heuristic Collection . . . 17
5.2.2 Evaluating the Validity of Heuristics . . . 17
5.2.3 Visualisation and Representation of Heuristics . . . 18
6 Conclusion 19 6.1 Acknowledgments . . . 19
Bibliography 22
A Automated Heuristics 23
B Large UML Diagrams 25
List of Figures
2.1 The .NET Compiling Process . . . 5
3.1 Automating Heuristics – A Conceptual Visualisation Pipeline . . . 8
3.2 The Visualisation Pipeline – A Closer Look . . . 8
3.3 Format of the Configuration File . . . 10
3.4 BugScape – A 3D Visualisation . . . 10
3.5 Mountain-like Visualisation . . . 11
4.1 Resulting visualisation for JST . . . 15
A.1 List of Automated Heuristics with Parameter Options . . . 23
B.1 The UML diagram for our Heuristic Tool . . . 26
B.2 The UML diagram for the .NET Semantic Model (Sourced from [23]) . . . 27
1
Introduction
Software size and complexity are major factors that contribute to the difficulty of software development and design. These factors, along with the intangible nature of software, make it challenging for developers to analyse the quality of their systems.
Traditional methods for determining the quality and maintainability of software systems include eval-uating them with respect tosoftware metrics. Numerous software metrics have been proposed in the liter-ature [7, 19, 18, 14, 13], however commercial software developers have made relatively little use of them. One reason for this is that understanding and applying metrics can be very complicated and is generally only recommended to experienced developers. Another reason is that metrics are used to quantify focused programming concepts and it is difficult to directly relate these measures to factors of quality. In addition, there is a lack of association between the proposed metrics and the daily decisions made by developers.
Consequently, software developers are more inclined to rely on their intuition about the complexity of a system, rather than some quantified metrics. Riel’s suggestion that “a design is good when ‘it feels right’ ” [25] reflects this. As such, when determining if the design of a software systemfeels right, devel-opers typically apply a collection of heuristics and guidelines that they have accumulated throughout their programming careers. This process is usually carried out subconsciously; it is common for developers to assess the quality of a design, however, their ability to qualify that decision is often more difficult.
In earlier work, a model that captures the semantic concepts of programs written for the Microsoft .NET Framework was developed [23]. This .NET Semantic Model (SM) represents individual components such as classes, methods, and variables that make up the structure of Object Oriented (OO) software. In our research, we investigate the use of this model in automating OO design heuristics. We use the termautomatingin this report to refer to the process of providing developers with sufficient information, regarding a heuristic; so that they can then identify whether or not the heuristic is being followed in their design. In effect, this process can be used to support and affirm their design decisions.
1.1
Research Objectives
The main objective of this research was to create an analysis tool to help software developers by supplying them with information that is directly pertinent to their design decisions. This was achieved by automating the evaluation of software in light of heuristics that are known to be used by software engineers.
Due to the fact that heuristics are expressed using natural language and typically do not lend themselves to automation, our initial concern was to review heuristics with the purpose of identifying those that could be quantified. Additionally, we needed to consider the subjectivity of these heuristics, and so we needed to ensure that our analysis tool was configurable to cater for differing opinions of individual’s.
It was not our intention to prove the relevance or validity of the heuristics we automate. Nevertheless, our research is intended to provide a basis for an exploratory framework in which heuristics may be further evaluated and validated.
2 1. INTRODUCTION
1.2
Report Outline
• Chapter 2 provides background information on the Software Design Problem, Object-Oriented Pro-gramming, Object-Oriented Design Heuristics, the Microsoft .NET Framework, and Static Analysis.
• Chapter 3 discusses automating OO design heuristics, introduces our proposed architecture, and describes the design and implementation of the framework developed in our research.
• Chapter 4 describes the analysis of JST, a moderately-sized software program, using our application for automating heuristics.
• Chapter 5 presents a discussion of our research, describes any limitations, and identifies a number of potential areas for future research.
2
Background
2.1
The Software Design Problem
The very nature of software makes the designing of a system difficult. Unlike other areas of design, such as building construction and car manufacturing, the final product of software design is abstract and intangible. “It is not constrained by materials, governed by physical laws or by manufacturing processes” [27]. This is both a positive and a negative characteristic of software. It is positive in the way that there are no physical limitations of what software can accomplish, yet negative due to the fact that such systems can easily become largely complicated and difficult to comprehend.
A commonality between designing software and designing other products is that there is no single correct solution. Given a particular item to develop, or task to complete, developers are faced with multiple design solutions where the one to implement is not always apparent. In addition, design involves many differing dimensions, for example cost, reliability, maintainability, and efficiency, all of which require optimisation. It is essential for the developer to find the right balance between these dimensions for their particular solution.
Consequently, software developers are commonly overwhelmed with design decisions. Many program-ming paradigms and support tools have been proposed in an effort to reduce this information overload, and in essence find oursilver bullet[5].
2.2
Object-Oriented Programming
Object-Oriented Programming (OOP) is a widely used computer programming paradigm. The idea behind this paradigm is that a computer program can be expressed in terms of objects and the interactions between these objects to complete a specified task.
OOP began to emerge during the mid 1960’s with the development of Simula 67, a programming language commonly referred to as “the precursor of object-oriented languages” [3]. In the early 1970’s, the ideas of Simula were extended by a research team at Xerox PARC (led by Alan Kay) to produce Smalltalk, the first well known OO language. However, it was not until the late 1980’s and early 1990’s that OO software development became more common. According to Johnson, OO was then “fast becoming the industry standard for software development” [17].
2.2.1 Benefits of OOP
Many researchers believe that the ‘key breakthrough’ in OOP is the ability to build large software systems from smaller components, through reuse [28]. By allowing developers to reuse existing components, it has become faster to develop new software systems. Developers are no longer required to ‘reinvent the wheel’.
In addition to reuse, the modularity of OO programs is considered to make it easier and more efficient to maintain and implement changes. The use of objects to represent elements in real life provides “a clean, self-contained implementation which fits naturally into human thought processes” [29]. Encouraging some experts to believe that OOP reflects the real world better [25], in comparison to the more traditional techniques.
4 2. BACKGROUND
2.2.2 Problems with OOP
Many software development companies have made the move to OOP because of its “promise of increased productivity and shortened schedules” [29]. However, the starting costs can be very expensive. New software systems need to be created from scratch because there is often an absence of reusable software components during the early stages of OOP start-up. Furthermore, failure to designate sufficient learning time during the convergence to OOP also reduces benefits. Developers are often attempting to do “too much, too soon, too fast” [29].
Typically, in software development, the larger the software system, the harder it is for a single developer to comprehend. In this sense, OOP is no different. Mispracticed OOP often leads to a large number of object instances with high levels of collaboration and dependencies, all of which can be confusing and difficult to manage.
2.3
Object Oriented Design Heuristics
Experienced OO developers can look at source code or UML diagrams directly and identify forces that influence the system’s design. They then exert judgement regarding the balances of these forces to form an opinion about the quality of the component or system in question. This process is largely influenced by the opinions of individual developers and involves a number of aesthetic components. In this report, we use the termheuristicsto refer to these design forces.
Many publications exist that have attempted to capture the expertise of skilled OO developers. Arthur Riel, for example, documented 61golden rulesof OOP [25]. In which every rule relates to a potential problem in the design where the rule was violated. He describes them as:
“ not hard and fast rules that must be followed under penalty of heresy. Instead, they should be thought of as a series of warning bells that will ring when violated. The warning should be examined, and if warranted, a change should be enacted to remove the violation of the heuristic. It is perfectly valid to state that the heuristic does not apply in a given example for one reason or another.”
Another example is Kent Beck and Martin Fowler’s collection ofcode smells[11]. Code smells are used to help software developers identify problematic code and decide when this code needs to be improved by refactoring. The authors’ choice of the termsmellsemphasises the vague and subjective nature of heuristics. There are several possible types of relationships between heuristics. The most important two are im-plicationandcontradiction[2]. Implication is when the conformance to one heuristic indicates the con-formance of another. For example, Riel’s Heuristic (RH) 2.1 “All data should be hidden within its class” implies theInformation Hiding Principle. This principle suggests that the details of an object that are most likely to change, or “do not contribute to its essential characteristics”[4], should be hidden.
Many contradicting heuristics are derived from differing opinions aboutgoodOO design. For example RH5.7, “All base classes should be abstract” discourages concrete base classes, however satisfying this heuristic could result in aLazy Class Smell. Other contradictions result from conflicting forces of design. The simplest example is RH5.4 and RH5.5, which state “In theory, inheritance hierarchies should be deep – the deeper the better” and “In practice, inheritance hierarchies should be no deeper than an average person can keep in his or her short-term memory. A popular value for this number is 6” respectively.
When faced with contradicting heuristics, the developer should examine the design further to determine whether or not both of them are applicable in their particular situation, and if they are, decide which one “plays the more important role” [25].
2.3.1 Human Factors
2.4. THE MICROSOFT .NET FRAMEWORK 5
2.3.2 Relation to Design Metrics
“A heuristic is not a metric” [12]. Heuristics are rules and guidelines derived from the practical experience of skilled software developers. They are expressed using natural language and conventionally have very vague, subjective definitions. Metrics, on the other hand, are very formal and precisely defined measures of software. They are typically, but not always, derived from sound conceptual and theoretical informa-tion [22].
It is common for metric results to be in the form of data values that can be displayed using appropriate measurement scales. Examples of such scales include: nominal, ordinal, interval, and ratio. These results can be effectively used in identifying problem areas in code, however, once a problem has been detected, metrics fail to provide developers with the guidance required to resolve it.
2.4
The Microsoft .NET Framework
The Microsoft .NET Framework (announced in July 2000) is a software development platform that is considered to be a significant change in the development of Windows and Web-based applications [24].
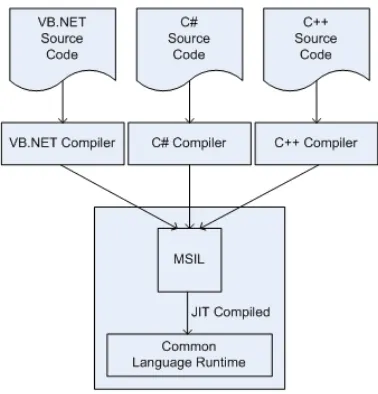
[image:13.612.207.396.381.578.2]There are over 40 different programming languages supported by the Framework; these include VB.NET, C# (“C sharp”), and Managed C++. During the compiling process, source code written in either of these languages is translated to the Microsoft Intermediate Language (MSIL); a platform independent instruc-tion set. See Figure 2.1. This causes all .NET programs to use the same semantics at runtime regardless of what language they were written in. And allows source code written in different languages to inter-operate within the same execution environment.
Figure 2.1: The .NET Compiling Process
2.5
Static Analysis
Static analysis is the process of examining software artifacts (typically source code) to obtain relevant information. This information can then be used to help software developers manage and comprehend their programs. Unlike dynamic analysis which is concerned with the state of a program during execution, static analysis occurs at compile time and does not require executing the program in question.
repre-6 2. BACKGROUND
sentation is commonly referred to as aparse tree. Finally, semantic analysis takes this parse tree and adds meaning to it.
Our research is interested in the rich level of information made available using semantic modelling, a form of static analysis. The remainder of this section introduces two semantic modelling approaches developed in previous research: the Java Symbol Table, and the .NET Semantic Model.
2.5.1 Java Symbol Table
The Java Symbol Table (JST) was developed in 2003 [16], and is a semantic model for the Java 1.4 pro-gramming language. The semantics of a propro-gramming language “reveals the meanings of syntactically-valid strings in a language” [26]. JST identifies and builds a model based on the semantic concepts in a Java parse tree, these concepts include entities such as interfaces, classes, methods, and fields. In addi-tion, the relationships between such entities were also represented in the model, these include inheritance, containment, and invocation.
2.5.2 A .NET Semantic Model
The .NET Semantic Model (SM) was developed in 2005 [23], and was largely influenced by JST (described in Section 2.5.1). A complete UML diagram of this application can be seen in Appendix B.2.
This application captures and formalises a semantic model based on the MSIL and meta-data generated using the Microsoft .NET framework. A number of the semantics represented in this model are the same as those in JST, these include classes, interfaces, methods, constructors, fields, blocks, and modifiers. However, the SM also exposes new relationships in source code, an example of this is generics.
3
Design and Implementation
3.1
Automating Design Heuristics
Our preliminary research revealed that not all heuristics have the same degree of automation. In fact, some heuristics cannot be automated at all. A number of heuristics that fall into this category require specific knowledge and understanding of the domain modelled. Examples include: RH3.6 “Model the real world whenever possible”, and RH2.11 “Be sure that abstractions that you model are classes and not simply the roles objects play”. Other heuristics are relatively straight forward, such as RH5.6 “All abstract classes must be base classes”. However, the degrees of automation for many of the heuristics occur between these extremes. Where the heuristic itself may not be directly measurable, yet it is possible to measure aspects of the software that might indicate whether the heuristic is being followed. RH2.8 “A class should capture one and only one key abstraction”, for example, is hard to measure directly, as it is difficult to identify key abstractions. We can, however, relate this to other heuristics thatcanbe quantified, for example RH4.6 “Most of the methods defined in a class should be using most of the data members most of the time”. Additionally, we can measure indirect quantities such as LCOM [7] which, like RH4.6, might suggest whether the initial heuristic is being followed or not.
At this stage, we should acknowledge that the Microsoft .NET Framework itself indirectly imposes the conformance (or violation) of several heuristics upon developers. Examples include heuristics associated with multiple inheritance; programs attempting to inherit from more than one parent class will not compile in this environment. Consequently, we dismiss these heuristics from our research.
3.1.1 Parameterising Heuristics
Before a design heuristic can be automated we need to identify a more accurate understanding of what the heuristic encompasses. This can be increasingly difficult due to the informal nature in which heuristics are described, and the differing interpretations of individual developers.
An important step in refining the meaning of a heuristic is identifying any relevant parameters. The occurrence of literals and adjectives (such asmostor deep) in the description of a heuristic suggest that some type of variable is required. Ideally, this variable should be adjustable to serve as a threshold and enable it to be more useful in practice. Common programming terms (such as objects, messages, and collaborators) that are used in the description of the heuristic should also be reviewed so that we can accurately determine the criteria involved. An example of such criteria is the acceptable levels of visibility (public, private, protected, etc).
Consider RH4.7 “Classes should not contain more objects than a developer can fit in his or her short-term memory. A favorite value for this is six” as an example. The phraseA favorite value for this is six
suggests that the heuristic should have an Integer parameter so that the developer can identify the maximum number of objects they consider acceptable. Additionally, we need to determine what the termobjectrelates to by answering questions such as: Do we include “private” objects? What about “protected” objects? Or are we only interested in the “public” ones?
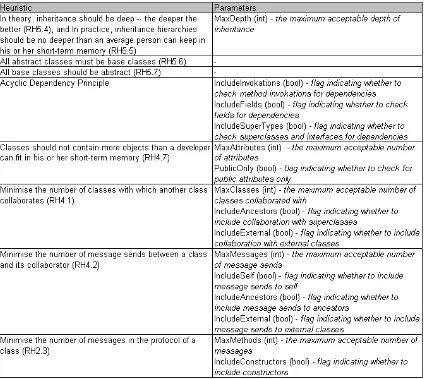
Appendix A presents the heuristics automated to date and identifies the configurable parameters we have supported for each.
8 3. DESIGN AND IMPLEMENTATION
3.2
Architecture
[image:16.612.105.499.198.306.2]In earlier work, an extensible pipeline-based architecture for information and software visualisation was developed [8, 15, 16]. This architecture encompasses all stages of software visualisation; from the initial source code through to presenting the information back to the user. As illustrated in Figure 3.1, the archi-tecture in our research conforms to this pipeline-based approach. We have altered the earlier pipeline to support automating OO design heuristics for .NET programs.
Figure 3.1: Automating Heuristics – A Conceptual Visualisation Pipeline
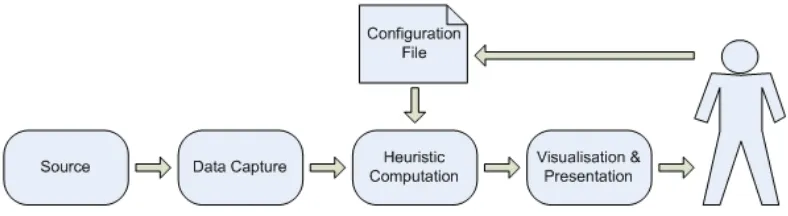
[image:16.612.90.513.418.525.2]Figure 3.2 presents a more detailed representation of the pipeline used in our research. The major steps in this pipeline involve capturing data for the program in question, computing heuristics based on this data, and transforming the results into visualisations. The remainder of this section is used to describe each of these steps further.
Figure 3.2: The Visualisation Pipeline – A Closer Look
3.2.1 Capturing Software Information
In our research, data capturing is primarily accomplished using the .NET semantic model introduced in Section 2.5.2. This model is a key element in our approach to automating design heuristics as it can be used to represent the common semantics of a wide range of programming languages, and provides a basis for cross-language comparisons, without the loss of rigour.
Nevertheless, our approach can easily be extended to accept software information from other sources, such as an XML file or the metric module in Borland Together1.
3.2.2 Computing Heuristics
Heuristics that are recognised as candidates for automation are coded as sibling classes. Some of the infor-mation required for a heuristic can be directly filtered from the semantic model. Whilst other inforinfor-mation
3.2. ARCHITECTURE 9
can be indirectly computed using model features. Our approach involves a framework for developing visi-tors (using the corresponding design pattern2[10]) that coincide with themetrics and filtersin our pipeline architecture. These visitors are used to traverse the semantic model and extract required information, which is then used in generating results for the related heuristics. See Appendix B.1 for a UML diagram of our framework. The relationship between a heuristic and the metrics and filters can be a simple 1:1 mapping, such as the relationship between RH5.5 “In practice, inheritance hierarchies should be no deeper than an average person can keep in his or her short-term memory” and the Depth In Tree (DIT) metric, or it can be more complex. An example of the latter is the relationship between theLarge Class Smelland the Number Of Attributes (NOAt), Number Of Operations (NOO), and Lines Of Code (LOC) metrics.
In our current implementation, developers provide a configuration file that identifies the heuristics, and their parameters, to automate. A simplified sample of the format for the configuration file can be seen in Figure 3.3. Elements supported in this file, along with any related attributes, are described as follows:
Source identifies the program to analyse. Thenameattribute corresponds to the full pathname for locating the file used to generate the semantic model.
Ref provides information about an individual reference used by the program. Thename attribute corre-sponds to the full pathname for locating the referenced file/library. MultipleRefelements are used for programs that contain more than one reference.
Heuristics encapsulates all of theHeuristicelements.
Heuristic contains information regarding an individual heuristic. The nameattribute corresponds to the
simple nameused in identifying the heuristic.
Parameter corresponds to an individual parameter value for the containing Heuristicelement. The
nameattribute identifies the parameter being assigned to, and thevalueattribute identifies the value to assign it.
AnXMLTextReaderobject is used to read the information from the configuration file. This information is then processed using the .NET Framework 2.0 Reflection library3to create instances of the specified heuristics and set any associated parameter values – at runtime. This eliminates the need to recompile our program every time there is a change to the configuration information of the heuristics being automated.
The results are written to an XML file, and we have incorporated sufficient information (from the configuration file) in this output file, to ensure that the computation can be repeated at a later date.
3.2.3 Visualisation
Visualising heuristic information is the final step in our pipeline-based architecture and provides many challenges. Due to the nature in which heuristics are expressed, we believe that it is not appropriate to visualise them using techniques similar to software metrics (such as graphs and tables). Instead, “softer” more ambient methods should be considered. An important characteristic of these visualisations would be to convey a holistic impression of each heuristic rather than the underlying metrics they were mapped to. Additionally, developers are likely to be interested in examining a heuristic both individually, and as a member of a larger collection.
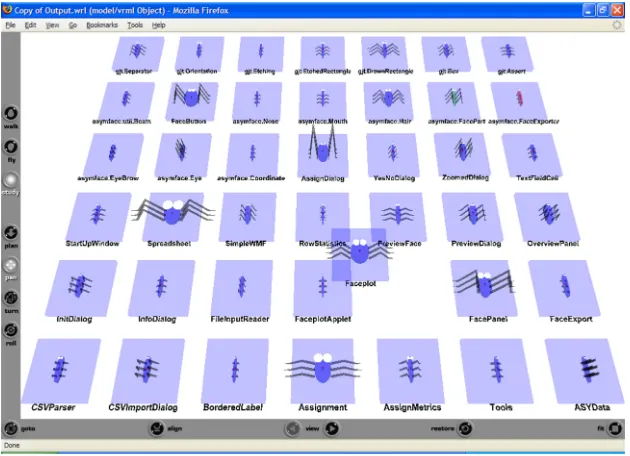
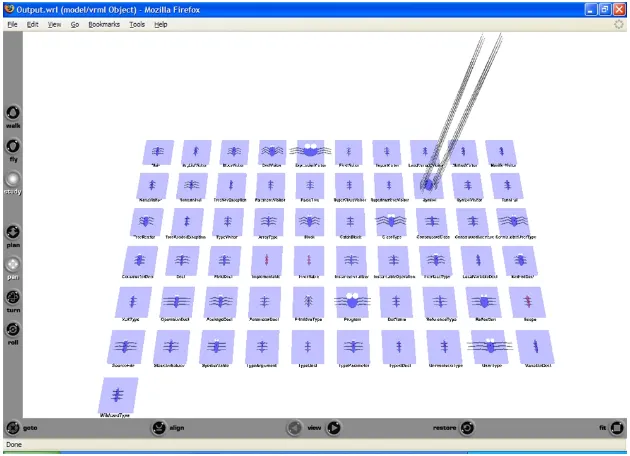
In our current research, we are focused primarily on automating the heuristics rather than visualising the final results, however, we have briefly explored two 3D visualisations for this purpose: a BugScape, and a Mountain-like Range. Figure 3.4 illustrates our BugScape visualisation, displayed in Mozilla Firefox using the Cortona 4.2 plugin4. This visualisation is presented as a 3D VRML [1] world featuring bug-like glyphs that were inspired by Chernoff Faces [6] – a well known technique for presenting multivariate data in 2D.
Our underlying metaphor is the display of specimens such as those found in museums. Each individual specimen corresponds to an element (for example a class) in the software system, and its characteristics
2The visitor design pattern enables a clear separation of our heuristics, metrics, and filters from the core model representation 3http://msdn2.microsoft.com/en-us/library/system.reflection.aspx
10 3. DESIGN AND IMPLEMENTATION
Figure 3.3: Format of the Configuration File
Figure 3.4: BugScape – A 3D Visualisation
(such as eye diameter, body width, leg length, etc) indicate the results of heuristic analysis. Additionally, we have provided users with the ability to navigate and interact with the 3D world to assist them with eval-uations and comparisons. For example, each individual specimen is semi-transparent and can be overlayed with other specimen by moving it around the plane.
Potiental heuristics to be visualised using this technique include those that incorporate a number of parameters. An example of this is theLarge Class Smell[11]. TheLarge Class Smellconsiders multiple factors when determining the size of a class, for example the NOAt, NOO, and LOC metrics mentioned previously in this section. By mapping the results of these factors to features of our specimen, we are able to produce a holistic image of the class sizes in a software system – the larger the specimen, the greater the impression formed by the developer regarding the size of the class.
[image:18.612.145.460.330.558.2]3.2. ARCHITECTURE 11
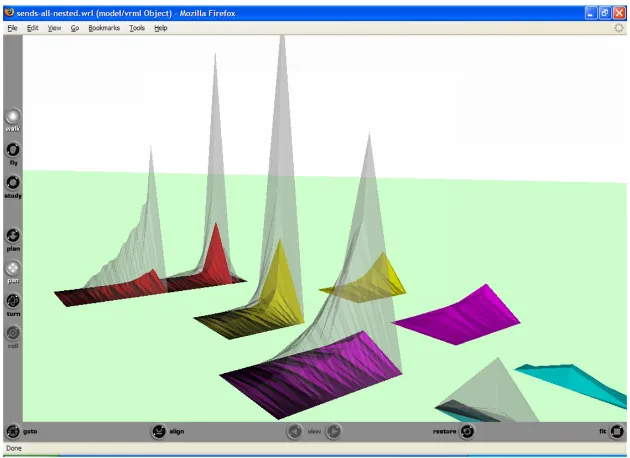
the Cortona 4.2 plugin. This visualisation employs a metaphor involving a number of peaked mountain-like components. Each component is made up of vertical slices where each slice corresponds to a class in the software system. The component on the far left of the visualisation represents the entire application, and the remaining components correspond to individual packages.
This particular visualisation displays information relating to RH4.2 “Minimise the number of message sends between a class and its collaborator”. The height of the transparent section indicates the total number of message sends, and the height of the solid section relates to the number of message sends that were either sent from the class to itself, or to one of its ancestors. The flatter components in the far right of the visualisation, represent the data for the total number of message sends normalised by the number of collaborators for each class.
[image:19.612.144.459.255.484.2]This visualisation also provides users with the ability to navigate and interact with the 3D world, in a similar manner to BugScape.
4
Application
In this chapter we illustrate the utility of our approach by applying it to an example of a real application. The particular application to be modelled is JST1, which was introduced in Section 2.5.1, but we could equally have used an unrelated application.
The remainder of this chapter steps through our pipeline-based architecture described in Section 3.2, demonstrating our approach by evaluating the software with respect to theLarge Class Smell.
4.1
Refining the Heuristic
The first step in our proposed architecture is to refine our understanding of what the heuristic encompasses. In this case, we need to define a finite collection of measurable size characteristics for the example we chose. These include cyclomatic complexity, lines of code, and the number of attributes and operations contained in the class. Additional considerations include the level of visibility, and whether or not to count inherited items.
4.2
Parameterising the Heuristic
Using this refined version of the heuristic, we then incorporate parameters and assign appropriate values to them. The exact values needed here are less important then the ability to configure them, and experiment with their effects. For the purpose of our investigation we have decided to illustrate this example using the following set of (incomplete) parameters:maxAttributes,maxMethods,maxCyclomaticComplexity,
maxLinesOfCode, all of which will be assigned the value 9 [20]. This implies that a class containing any result over 9 is considered to have aLarge Class Smell.
4.3
Data Capture
This step in the architecture involves populating a semantic model representation for JST. Currently, our framework cannot retrieve information about cyclomatic complexity and lines of code, because these lie beneath the semantic model level (they are at the syntactic and lexical levels respectively). However, we are able to source this information from the metric module in Borland Together and incorporate it into our framework as supplimentary information.
4.4
Metrics and Filters
Metrics and filter visitors that are used to calculate the required values are identified. In this particular example these were Number Of Attributes (NOAt), Number Of Operations (NOO), Cyclomatic Complexity (CC), and Lines Of Code (LOC). If a metric was identified for which there was no corresponding visitor, then a visitor could be developed for it at this point.
4.5
Heuristic Computation
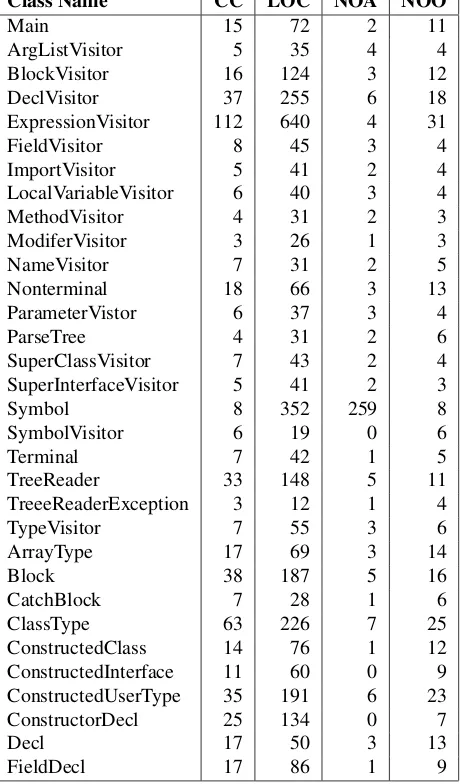
Once a semantic model is generated, and the metric and filter classes have extracted the required informa-tion, we can continue to apply any additional filters before the information is written to XML. In this case, we filter out any classes that have no metric values greater than 9. See Table 4.1.
1JST was ported to the J# programming language for the purpose of this evaluation
14 4. APPLICATION
Class Name CC LOC NOA NOO
Main 15 72 2 11
ArgListVisitor 5 35 4 4
BlockVisitor 16 124 3 12
DeclVisitor 37 255 6 18
ExpressionVisitor 112 640 4 31
FieldVisitor 8 45 3 4
ImportVisitor 5 41 2 4
LocalVariableVisitor 6 40 3 4
MethodVisitor 4 31 2 3
ModiferVisitor 3 26 1 3
NameVisitor 7 31 2 5
Nonterminal 18 66 3 13
ParameterVistor 6 37 3 4
ParseTree 4 31 2 6
SuperClassVisitor 7 43 2 4
SuperInterfaceVisitor 5 41 2 3
Symbol 8 352 259 8
SymbolVisitor 6 19 0 6
Terminal 7 42 1 5
TreeReader 33 148 5 11
TreeeReaderException 3 12 1 4
TypeVisitor 7 55 3 6
ArrayType 17 69 3 14
Block 38 187 5 16
CatchBlock 7 28 1 6
ClassType 63 226 7 25
ConstructedClass 14 76 1 12
ConstructedInterface 11 60 0 9
ConstructedUserType 35 191 6 23
ConstructorDecl 25 134 0 7
Decl 17 50 3 13
[image:22.612.188.418.216.608.2]FieldDecl 17 86 1 9
4.6. VISUALISATION AND REPRESENTATION 15
[image:23.612.144.459.179.407.2]4.6
Visualisation and Representation
Figure 4.1 illustrates the results of analysing JST with respect to theLarge Class Smellusing our BugScape visualisation from Section 3.2.3. The four factors considered for determining if a class is large are mapped to the features of the specimen as follows: NOAt = height of the legs , NOO = width of the legs , CC = diameter of the eye, and LOC = width of the body.
Figure 4.1: Resulting visualisation for JST
5
Limitations and Future Work
5.1
Limitations
Our primary source for capturing software information is the .NET Semantic Model. In order for the SM to generate a semantic representation of a program, the program itself must have been successfully compiled first. We believe that this is the main limitation of our research, as it prevents our ability to provide information about programs that do not compile. However, if in the future this becomes a requirement, we can extend our framework with little effort to incorporate an additional source for capturing information in such situations.
As identified in Section 3.1, design heuristics have varying levels of automation. As such, many heuris-tics cannot be automated due to the inability of computers to ascertain knowledge of the modelled domain. Although thisisa limitation of our research, we believe that there is still an acceptable number of heuristics that can be automated which make this area of research worth pursuing.
5.2
Future Research
Our research has identified a number of opportunities for further research in the area of automating OO design heuristics. These areas include extending our collection of automated heuristics, evaluating the va-lidity and applicability of individual heuristics in software design, and exploring techniques for visualising and representing the heuristics back to the developer.
5.2.1 Extending our Heuristic Collection
The heuristics automated in our research are a small collection of those that exist in literature. The extension of this collection would improve the level of information that we are able to provide developers, which in turn, would enable our tool to be more useful in practice.
Eventually, we anticipate that our research approach will enable developers to propose, automate and evaluate their own heuristics along side those that already exist.
5.2.2 Evaluating the Validity of Heuristics
As mentioned in our research, heuristics are informal rules and guidelines that originate from the practical experience of skilled software developers. They are not derived from the same sound conceptual and the-oretical information as metrics. Hence, the applicability and validity of an individual heuristic in software design is questionable.
Our research provides the basis for an evaluation into the effects of heuristics in the software design process. Possible evaluations are:
• identifying which heuristics are most suitable for particular design activities, and determine how often developers actually apply them in these activities.
• determining whether, or not, an individual heuristic is sensitive to variations in parameter and thresh-old values. For example, does it make a difference to a developers design decisions if we include constructors and private operations when automating RH2.3, “Minimize the number of messages in the protocol of a class”?
18 5. LIMITATIONS AND FUTURE WORK
5.2.3 Visualisation and Representation of Heuristics
6
Conclusion
In this research, we have discussed a number of factors and qualities of software systems that contribute to the difficulty of their design, and illustrate the importance of developing useful analysis tools. Such analysis tools can help developers comprehend and manage large software systems. However, in order for them to be accepted and used in practice there must be a clear connection between the results of the analysis and the daily decisions made by developers. In addition, the analysis tool itself should be easy to use and comprehend.
We have identified the common use of rules and guidelines, collectively referred to as heuristics, as a partially-subconscious method for judging software. We then proposed a pipeline-based architecture for automating the analysis of .NET programs with respect to these heuristics. The major steps in this pipeline include: capturing data, computing heuristics, and visualising and presenting the information back to the developer. We have demonstrated how the .NET semantic model proposed in previous research, can be used to support the informal expression and evaluation of heuristics during the data capturing stage of our pipeline. An advantage of using the .NET semantic model over JST, was the ability to automate heuristics independently from the language they were written in.
The framework developed in our research was implemented in Visual Studio 2005, using the C# pro-gramming language. Visitor classes, corresponding to the metrics and filtersin our architecture, were created to traverse the semantic model and extract relevant information, which in turn, was used in the analysis of heuristics.
The most challenging part of our research was reviewing heuristics to determine whether or not they could be automated effectively. Due to the subjectivity and expressive nature in the description of a heuris-tic, it was difficult to precisely determine what the heuristic involved.
Finally, we have indicated that further research in the area of visualising and presenting heuristic infor-mation back to developers would be beneficial. Such visualisations would facilitate and support developers in the process of forming sound conclusions with respect to the design of their system.
6.1
Acknowledgments
First and foremost I would like to thank my supervisors, Mr. Warwick Irwin and Dr. Neville Churcher, for all their suggestions and encouragement throughout the course of this research. I would also like to say a big thank you to my fellow honours students for the endless encouragement and entertainment throughout the year. I wish you all the best.
Bibliography
[1] J. L. M. Andrea L. Ames, David R. Nadeau. VRML 2.0 Sourcebook. John Wiley and Sons, Inc., 2 edition, 1997.
[2] H. B¨ar and O. Ciupke. Exploiting design heuristics for automatic problem detection. InECOOP ’98: Workshop on Object-Oriented Technology, pages 73–74. Springer-Verlag, 1998.
[3] M. Beaudouin-Lafon. Object-Oriented Languages: Basic Principles and Programming Techniques. Chapman & Hall, 1994.
[4] G. Booch.Object-Oriented Analysis and Design with Applications. Addison Wesley, 2 edition, 1994. [5] F. P. Brooks. No silver bullet: Essence and accidents of software engineering. Computer, 20(4):10–
19, 1987.
[6] H. Chernoff. The use of faces to represent points in k-dimensional space graphically. Journal of the American Statistical Association, 68(342):361–368, 1973.
[7] S. R. Chidamber and C. F. Kemerer. A metric suite for object oriented design. IEEE Transactions on Software Engineering, 20(6):476–493, 1994.
[8] N. Churcher and W. Irwin. Informing the design of pipeline-based software visualisations. InAPVis ’05: proceedings of the 2005 Asia-Pacific symposium on Information visualisation, pages 59–68, Darlinghurst, Australia, 2005. Australian Computer Society, Inc.
[9] P. Eades and X. Shen. Moneytree: ambient information visualization of financial data. InVIP ’05: Proceedings of the Pan-Sydney area workshop on Visual information processing, pages 15–18, Dar-linghurst, Australia, Australia, 2004. Australian Computer Society, Inc.
[10] R. J. Erich Gamma, Richard Helm and J. Vlissides. Design Patterns: Elements of Resusable Object Oriented Software. Addison Wesley, 1995.
[11] M. Fowler.Refactoring: Improving the Design of Existing Code. Addison Wesley Longman Publish-ing Co., Inc, 1999.
[12] C. Gibbon and C. Higgins. Teaching object-oriented design with heuristics.SIGPLAN Not., 31(7):12– 16, 1996.
[13] M. H. Halstead. Elements of Software Science. Elsevier North Holland, Inc., 1977.
[14] B. Henderson-Sellers. Object-Oriented Metrics: Measures of Complexity. Prentice Hall The Object-Oriented Series, 1996.
[15] W. Irwin and N. Churcher. XML in the visualisation pipeline. InVIP ’01: Proceedings of the Pan-Sydney area workshop on Visual information processing, pages 59–67, Darlinghurst, Australia, 2001. Australian Computer Society, Inc.
[16] W. Irwin and N. Churcher. Object oriented metrics: Precision tools and configurable visualisations. InMETRICS ’03: 9th IEEE Symposium on Software Metrics, pages 112–123. IEEE Press, 2003. [17] L. Johnson. Object-oriented technology eases development. National Underwriter. (Life
Health/Financial Services Ed), 101(7):40–42, 1997.
[18] M. Lorenz and J. Kidd.Object-Oriented Software Metrics. Prentice Hall The Object-Oriented Series, 1994.
22 BIBLIOGRAPHY
[19] T. J. McCabe. A complexity measure. IEEE Transactions on Software Engineering, SE-2(4):308– 320, 1976.
[20] G. A. Miller. The magical number seven, plus or minus two. The Psychological Review, 63:81 –97, 1956.
[21] T. Miller and J. Stasko. The infocanvas: information conveyance through personalized, expressive art. InCHI ’01: CHI ’01 extended abstracts on Human factors in computing systems, pages 305–306, New York, NY, USA, 2001. ACM Press.
[22] E. E. Mills. Software metrics. Technical Report SEI-CM-12-1.1, Seattle University, 1988.
[23] B. Neate. An object-oriented semantic model for .NET. 2005.
[24] D. M. Peterson. Microsoft’s .NET framework: New platform for software development. Business Communications Review, 32(11):57–61, 2002.
[25] A. J. Riel.Object Oriented Design Heuristics. Addison Wesley Longman Publishing Co., Inc., 1996. [26] K. Slonneger and B. L. Kurtz.Formal Syntax and Semantics of Programming Languages: A
Labora-tory Based Approach. Addison Wesley Publishing Co., 1995.
[27] I. Sommerville.Software Engineering. Pearson Education Ltd., 6 edition, 2001.
[28] J. W. Verity and E. I. Schwartz. Software made simple; will object oriented programming transform the computer industry? Business Week, (3233):92–97, 1991.
A
Automated Heuristics
Figure A.1: List of Automated Heuristics with Parameter Options
B
Large UML Diagrams
26 B. LARGE UML DIAGRAMS
27
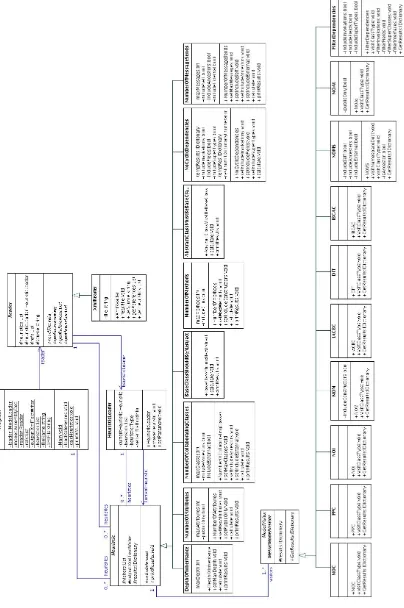
![Figure B.2: The UML diagram for the .NET Semantic Model (Sourced from [23])](https://thumb-us.123doks.com/thumbv2/123dok_us/9993755.499546/35.612.187.425.98.720/figure-b-uml-diagram-net-semantic-model-sourced.webp)
