http://www.scirp.org/journal/ojms ISSN Online: 2161-7392
ISSN Print: 2161-7384
DOI: 10.4236/ojms.2018.81010 Jan. 31, 2018 196 Open Journal of Marine Science
Demographics and Population Dynamics
Project the Future of Hard Coral Assemblages
in Little Cayman
Kristi A. Foster, Greg Foster
Coastal & Marine Ecology Consultants, Inc., Nehalem, OR, USA
Abstract
Individual hard coral colonies from four representative reef sites around Little Cayman were surveyed yearly between 2010 and 2015, a period of non-dis- turbance between two elevated seawater temperature anomalies. Photographic censuses produced 7069 annual transitions that were used to describe the de-mographics (size class frequencies, abundance, area cover) and population dynamics under non-disturbance environmental conditions. Agariciids, Po-rites asteroides, and Siderastrea radians have replaced acroporids as the pre-dominant massive corals. Recruitment rates were generally low (<1 colony per m2), except for a fourfold recruitment pulse of S. radians that occurred in
2011. On average, 42% of coral recruits survived their first year but only 10% lived longer than four years. Temporal comparisons allowed correction fac-tors to be calculated for in-situ methods that overestimate recruitment of co-lonies ≤2 cm in diameter and overlook larger coco-lonies. Size class transitions included growth (~33%), stasis (~33%), partial mortality (10% - 33%), and whole colony mortality, which decreased with increasing colony size (typically <10% for colonies with surface areas >30 cm2). Transition matrices indicated
that Little Cayman assemblages have declining hard coral populations (λ < 1) but as stable size class distributions progress toward higher proportions of colonies with >150 cm2 surface areas, live area cover may remain relatively
stable. Projection models indicated that downward population trends would be exacerbated even by mild disturbance (5% - 10% mortality) scenarios. The fate of hard corals on Little Cayman’s reefs was determined to be heavily de-pendent on the health and transitions of agariciid colonies. Conservation strategies that currently focus on restoration of Caribbean acroporids should be expanded to include agariciids, which were previously considered “weeds”.
Keywords
Caribbean Coral, Size Class Transitions, Vital Rates, Recovery Projections,
How to cite this paper: Foster, K.A. and Foster, G. (2018) Demographics and Popu-lation Dynamics Project the Future of Hard Coral Assemblages in Little Cayman. Open Journal of Marine Science, 8, 196-213. https://doi.org/10.4236/ojms.2018.81010
Received: December 26, 2017 Accepted: January 28, 2018 Published: January 31, 2018
Copyright © 2018 by authors and Scientific Research Publishing Inc. This work is licensed under the Creative Commons Attribution International License (CC BY 4.0).
DOI: 10.4236/ojms.2018.81010 197 Open Journal of Marine Science
Little Cayman
1. Introduction
Since the 1970s, Caribbean corals have been subjected to regional and local mass mortality events associated with disease outbreaks, temperature-induced bleaching, hurricanes, and anthropogenic stressors, which have resulted in a de-cline in average coral cover from 35% to 16% [1]. The previously dominant reef builders, Acropora cervicornis and A. palmata, have been disproportionately susceptible to these disturbances and have been placed on the IUCN’s Red List as critically endangered. Coral dominance has shifted from these highly sus-ceptible branching and tabular species to more resistant and resilient massive taxa. The fates of the surviving massive corals shall shape future Caribbean coral communities.
[image:2.595.260.488.446.681.2]Little Cayman is an ideal location within the Caribbean to study the popula-tion dynamics of hard coral populapopula-tions because it lacks many of the anthropo-genic stressors to which other reefs are exposed. Little Cayman is located 120 km northeast of Grand Cayman, 145 km south of Cuba, and 10 km southwest of Cayman Brac (Figure 1). The remote island is approximately 16 km long by 1.6 km wide, with a maximum elevation of 12 m, and is surrounded by shallow and narrow reef shelves, some of which drop off to vertical walls (e.g. Bloody Bay Wall) that reach 300 m deep. More than half of the shallow reefs have been des-ignated as protected areas (e.g. marine parks, replenishment zones) since 1986 [2].
DOI: 10.4236/ojms.2018.81010 198 Open Journal of Marine Science
Little Cayman has a small resident population (<200 people) and lacks agricul-ture, freshwater input rivers or streams, commercial fishing, industry, and ports; providing a rare opportunity to decouple the impacts that anthropogenic stres-sors (e.g. nutrient run off, sedimentation, pesticides, pollution, resource extrac-tion, development) and environmental stressors have on the health of coral reefs.
Live coral cover in Little Cayman has rebounded from its low point of 14% in 2004 to an average of 25%, among the highest in the Caribbean, despite sharing a similar disturbance history with reefs region wide [1][3][4]. Little Cayman cor-als experienced elevated temperature-induced bleaching and mortalities of vari-ous intensities during 1987, 1995, 1998, 2003, 2005, 2009, and 2015. The island experienced direct hits by hurricanes in 1980 (Allen, category 4), 1988 (Gilbert, category 4), and 2008 (Paloma and Gustav, categories 4 and 2, respectively). Outbreaks of white, yellow, and black band diseases and white plague have fol-lowed hurricane and bleaching events in 1981-82, 1990, 1996, and 1999-2000.
The study reported herein took place annually from 2010 through 2015 during non-disturbance environmental conditions (i.e. between the two most recent elevated temperature anomalies and during a period when no hurricanes, disease outbreaks, or other mortality events occurred). The objectives of this study were to 1) describe the demographics and dynamics of the hard coral communities around Little Cayman, 2) use the vital rates, based on temporal comparisons of individual colonies, to develop size class transition probability matrices, and 3) project the recovery potential of these coral assemblages for several disturbances scenarios.
2. Methods
2.1. Annual Surveys
Scleractinian coral populations were surveyed annually along the reef crests at four locations around Little Cayman for six consecutive years, between 2010 and 2015, during the non-disturbance period between two elevated seawater temper-ature anomalies (i.e. annual surveys began one year after the 2009 bleaching event and ended two months prior to first signs of coral paling in 2015) (Figure 1,
Table 1). Permanent monitoring stations were installed, with permission from
DOI: 10.4236/ojms.2018.81010 199 Open Journal of Marine Science Table 1. Descriptions of repetitive monitoring sites.
Station Site Name Depth (m) Latitude Longitude MPA
CORL Coral City 11 - 13 N19.68075 W80.02330 No
GRUN Grundy’s Garden 9 - 12 N19.65733 W80.08955 Yes
ICON ICON Reef 11 - 12 N19.69960 W80.06058 Yes
PAUL Paul’s Anchors 11 - 15 N19.69443 W80.06943 Yes
MPA = Marine Protection Area.
2.2. Image Analysis
Each scleractinian coral which appeared as a whole colony within a given belt transect was traced using the Area Analysis function in Coral Point Count (CPCe) [5], which calculated colony area cover (planar view). Image resolution was clear enough to identify colonies as small as 0.1 cm2 to species; however,
some of the smaller Agaricia, Undaria, and Helioseris spp. colonies lacked the morphological characteristics that help to differentiate the species, so these taxa were pooled into the “agariciid” group. Colonies which first appeared within a given transect after the initial 2010 survey were considered recruits. Colonies were presumed to have died if they were absent after the initial survey, over-grown by Trididemnum solida tunicates or macroalgae, or no longer had live tissue visible on the skeletons.
2.3. Size Class Determination
Hard corals were grouped into eight size-dependent classifications (“SC”) (Table 2) based on area cover. To determine the most appropriate groupings, size classifi-cations were compared for areas associated with radius increments of 1 cm and 2 cm, assuming colonies closely resembled circular structures with Area = πr2.
[image:4.595.206.540.90.175.2]Each of the top 10 most abundant taxa was distributed across either size class grouping, except for Siderastrea radians, the third most abundant taxa. If the larger size classes (based on 2 cm radius increments) were used, >97% of all
Table 2. Size-dependent classifications for hard coral colonies.
Size Class Area Cover (cm2) Approx Radius (cm)
SC1 <4 <1
SC2 4 - 12 2
SC3 12 - 30 3
SC4 30 - 50 4
SC5 50 - 75 5
SC6 75 - 100 6
SC7 100 - 150 7
SC8 >150 >8
[image:4.595.207.539.559.700.2]DOI: 10.4236/ojms.2018.81010 200 Open Journal of Marine Science
S. radians colonies would be combined into the smallest size class (SC1) and their growth and partial mortality rates would be masked as size class stability which could, in turn, mask the overall vitality rates of Little Cayman’s corals. Therefore, size classes based on 1 cm radius increments were used for the analy-sis described herein.
2.4. Transition Matrices
Size class transition matrices were developed for the two most abundant taxa (agariciids and Porites asteroides) and for all hard corals pooled together to represent Little Cayman overall. (S. radians, the third most abundant taxa, was comprised of small colonies in SC1-3 only; therefore, the respective size class transitions were not developed separately.) The use of eight size classes resulted in 8 × 8 matrices in which each element represents the mean probability of moving from a starting size class or “state” (column) to ending size class or “fate” (row) [6] [7]. The matrices include growth (G) to the next largest size class, size class stability (S) by remaining within the same group, or partial mor-tality (PM) to a smaller size class. Corals may also experience fission (i.e. the re-gression of a single colony into multiple smaller ramets) or fusion (i.e. two or more ramets grow together) [8][9]. In these cases, which were rare in this study, the area cover for all ramets were pooled and compared to the size class for the respective parent colony which underwent fission or for the resulting fused co-lony and were recorded as a partial morality, size class stability or growth transi-tion. The resulting probability matrices were used to project the number of cor-als in each size class during year t + 1, which equals the number in each size class at year t multiplied by the respective size class transition probabilities plus the mean number of corals which enter the population through recruitment (R) (Equation (1)).
( )
( )1
1 1 2 2 3 3 4 4 5 5 6 6 7 7
8 t 8
SC S PM PM PM PM PM PM PM SC
SC G S PM PM PM PM PM PM SC
SC G G S PM PM PM PM PM SC
SC G G G S PM PM PM PM SC
F n
SC G G G G S PM PM PM SC
SC G G G G G S PM PM SC
SC G G G G G G S PM SC
SC + G G G G G G G S SC
= = × ( ) 1 2 3 4 5 6 7 8 t R R R R R R R R + (1) An 8 × 8 matrix has eight eigenvalues, λi, or solutions to the matrix. The
DOI: 10.4236/ojms.2018.81010 201 Open Journal of Marine Science
rate of convergence of the population toward a stable stage distribution (i.e. the larger the damping ratio, the quicker a population will return to its stable state after a disturbance) [6][7]. Sensitivities and elasticities are measures of pertur-bation analyses that quantify the relative contribution of each vital rate to the population growth by adjusting each rate by a specific amount and by a specific proportion, respectively [6] [7]. The dominant eigenvalues (i.e. population growth rates), stable size class distributions, sensitivities, and elasticities for the transition matrices were calculated using the PopTools add-in for Excel [11].
2.5. Projection Models
Projections were modeled through 2040 as idealized, best-case scenario forecasts of massive coral populations [6][7]. Such projections assumed that 1) current environmental parameters remain unchanged over time, (i.e. during distur-bance-free intervals); 2) coral vital rates (e.g. growth, stability, partial mortality) include the interactions among corals and other benthic organisms, responses to the surrounding environment, and other factors that affect population struc-tures; 3) mean colony area in each size class remains unchanged over time; and 4) the mean recruitment rates between 2010-2015 occur annually throughout the projection period.
3. Results
3.1. Demographics within Monitoring Stations
[image:6.595.213.534.470.653.2]A total of 7069 annual transitions were recorded during the six-year study. The sample population was comprised of 23 taxa groups (Figure 2, Table 3). Addi-tional species (e.g. A. cervicornis, A. palmata, P. divaricata, P. porites) are
DOI: 10.4236/ojms.2018.81010 202 Open Journal of Marine Science Table 3. Hard coral taxa within monitoring stations.
Abundant Common Rare
Agariciids Diploria strigosa Dendrogyra cylindricus
Porites asteroides D. labrynthiformis Eusmilia fastigiata Siderastrea radians Dichocoenia stokesi Favia fragum
P. furcata Montastrea cavernosa Isophyllia sinuosa
S. siderea Mycetophyllia spp. Madracis dectactis
Orbicella faveolata Orbicella annularis Manicina areolata
O. franksii Meandrina spp.
Stephanocoenia intercepta Solenastrea bournoni Scolymia spp. Abundant = Greater than 100 individual colonies recorded within the belt transects during one or more years; Common = Between 5 and 100 colonies; Rare = Less than 5 colonies.
present, and may be prevalent in certain areas around the island, but were not recorded within the belt transects.
Agariciids, Porites asteroides, and Siderastrea radians collectively com-prised >68% of the hard coral communities.
70% of all colonies within the study area were smaller than 30 cm2 (SC1-SC3).
Each of the larger size classes (S4-S8) contributed less than 10% to the total pop-ulation each year (Figure 3). The largest temporal size class fluctuation occurred in the smallest (SC1) corals, primarily due to a recruitment pulse of S. radians in 2011 (Figure 4).
3.2. Recruitment
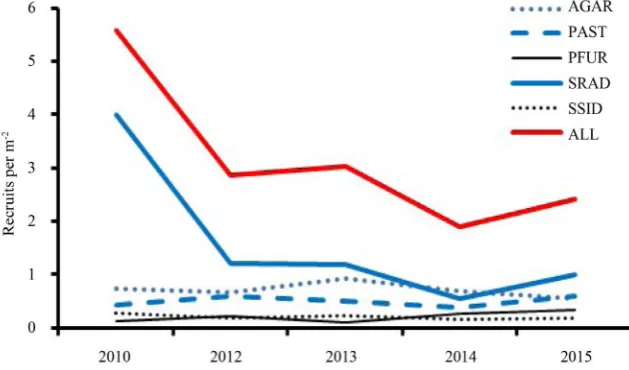
Recruits were observed within the monitoring stations for all recorded taxa ex-cept D. cylindricus, D. labrynthiformis, F. fragum, I. sinosa, and Meandrina spp.; however, recruits of these taxa were observed elsewhere around Little Cayman during the study period. A recruitment pulse of S. radians occurred in 2011 during which recruit abundance was fourfold greater than during each subsequent year of the study (4 recruits per m2 compared to 1 recruit per m2) (Figure 4). All
other taxa had annual recruitment of <1 recruit per m2 between 2011 and 2015.
Further investigations are required to identify pulse cycles and possible contri-buting factors.
Previous studies have estimated coral recruitment in Little Cayman by count-ing colonies that are ≤2 cm in diameter [4], the equivalent of SC1 in this study. However, such methods significantly overestimate SC1 recruits and overlook re-cruits in larger size classes. Temporal monitoring indicated that only 60% ± 11% (five-year mean ± standard deviation) of the SC1 colonies are recruits; the re-maining colonies were visible in prior years and were, therefore, more than one year old. SC2 recruits were common: 35% ± 6% of SC2 colonies were recruits
DOI: 10.4236/ojms.2018.81010 203 Open Journal of Marine Science Figure 3. Annual Population Structures for All Hard Corals-Actual and Projected. Idea-lized projections assume no environmental disturbances or changes in vital rates through 2040. Annual variability is smoothed for idealized projections which are calculated using 5-year mean probabilities based on the actual population structures. SC = size class with respective area covers as follows: SC1 ≤ 4 cm2; SC2 = 4 - 12 cm2; SC3 = 12 - 30 cm2; SC4 = 30 - 50 cm2; SC5 = 50 - 75 cm2; SC6 = 75 - 100 cm2; SC7 = 100 - 150 cm2; SC8 ≥ 150 cm2.
Figure 4. Annual Abundance of Recruits. Top five recruit taxa each year: AGAR = agari-ciids; PAST = P. asteroides; SRAD = S. radians; SSID = S. siderea; ALL = all taxa pooled together.
“weedy” agariciids and P. furcata also had recruits as large as SC6 (diameters ≤ 12 cm): among the SC4-6 agariciid and P. furcata colonies, 5% (± 1%) and 20% (±5%) were recruits, respectively. No recruits were observed in SC7-8 for any of the taxa. Based on the results of this study, the authors recommend that recruit estimation procedures which use size as a proxy for newly settled corals be mod-ified to 1) count colonies in size classes 1 - 3 and apply the correction factors provided in Table 4 for all taxa and 2) include SC4-6 agariciid and P. furcata
colonies, adjusted accordingly, among the recruit estimates.
DOI: 10.4236/ojms.2018.81010 204 Open Journal of Marine Science Table 4. Percent recruits within each size class (2011-2015).
Taxa Group SC1 SC2 SC3 SC4-6
AGAR 71% (±5%) 43% (±10%) 19% (±3%) 5% (±1%)
PAST 63% (±8%) 28% (±5%) 6% (±3%) -0-
PFUR 68% (±19%) 59% (±27%) 41% (±14%) 20% (±5%)
SRAD 54% (±14%) 27% (±9%) 10% (±12%) -0-
SSID 68% (±8%) 26% (±14%) 6% (±8%) -0-
OTHERS 55% (±12%) 36% (±16%) 7% (±6%) -0-
[image:9.595.211.538.273.495.2]Five-year mean percentages (± STD) of colonies within each size class that are recruits. Mean percentages may be used as correction factors for in-situ recruit estimation surveys. AGAR = agariciids; PAST = P. as-teroides; PFUR = P. furcata; SRAD = S. radians; SSID = S. siderea; OTHERS = 13 common and rare taxa of massive corals pooled together.
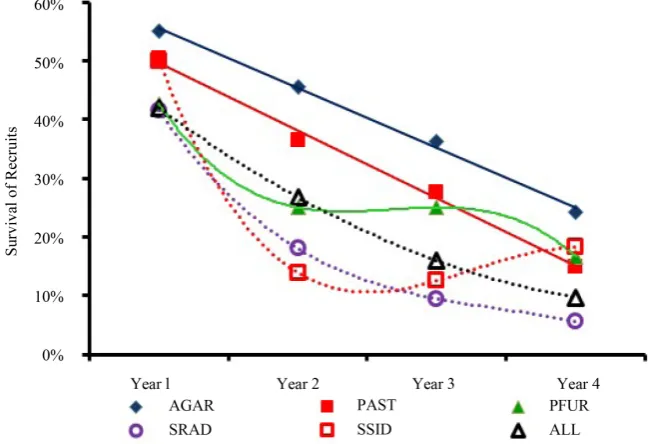
Figure 5. Recruit Survival over Time. Trendline equations are provided in Table 5. AGAR = agariciids; PAST = P. asteroides; SRAD = S. radians; SSID = S. siderea; ALL = all taxa pooled together.
Table 5. Recruit survival rates. Taxa
Group Trend Equation r2
AGAR Linear −0.1016x + 0.6585 0.9962
PAST Linear −0.1151x + 0.6112 0.9939
PFUR Polynomial −0.0433x3 + 0.348x2 – 0.9175x + 1.0392 1.0000 SRAD Polynomial −0.0172x3 + 0.1777x2 – 0.6474x + 0.9013 1.0000 SSID Polynomial −0.0461x3 + 0.4501x2 – 1.3889x + 1.4848 1.0000
ALL Polynomial 0.0223x2 – 0.2192x + 0.6165 1.0000
[image:9.595.207.539.570.696.2]DOI: 10.4236/ojms.2018.81010 205 Open Journal of Marine Science
recruits survived their first year; 27% survived to their second year; 16% survived to their third year; and 10% survived to their fourth year (Figure 5, Table 5). Given the high rates of mortality, recruits may die before they reach sexual re-productive maturity; therefore, the authors caution against using recruitment pulses as indicators of reef recovery.
3.3. Size Class Transitions
Approximately one-third of the SC1-SC7 colonies grew between monitoring pe-riods regardless of size class (Table 6). Agariciids and P. furcata were capable of growing six size classes within a single year, whereas the other taxa groups grew no more than three size classes within the same time frame. However, these large growth spurts were uncommon: 72% of the growing colonies transitioned to the next larger size class.
Approximately one-third of the SC1-SC7 colonies remained within the same size class. However, 60% - 100% of those colonies which achieved surface areas >150 cm2 (SC8) had size class stability, depending on the taxa group.
Partial mortality varied by size class. Approximately one-third of the SC4-SC7 colonies decreased in size. Among the smaller SC2-SC3 and larger SC8 colonies, 10% - 15% experienced partial mortality and transitioned into a smaller size class. Occasionally, shrinkage of four size classes was recorded; however, 74% of the shrinking colonies transitioned to the next smaller size class.
Between one-third and half of SC1 colonies die each year, largely due to the high mortality of recruits. The probabilities of whole colony mortality decrease with increasing colony size and are typically <10% for those colonies with sur-face areas >30 cm2 (SC4-SC8). An exception is the apparent increase in mortality
for P. asteroides, which increases from negligible mortality for SC6-SC7 colonies to 20% mortality for SC8 colonies. This study was conducted during a period of non-disturbance environmental conditions (e.g. no temperature anomalies, dis-ease outbreaks, extreme storms); therefore, the cause(s) for whole colony mor-tality require(s) further study.
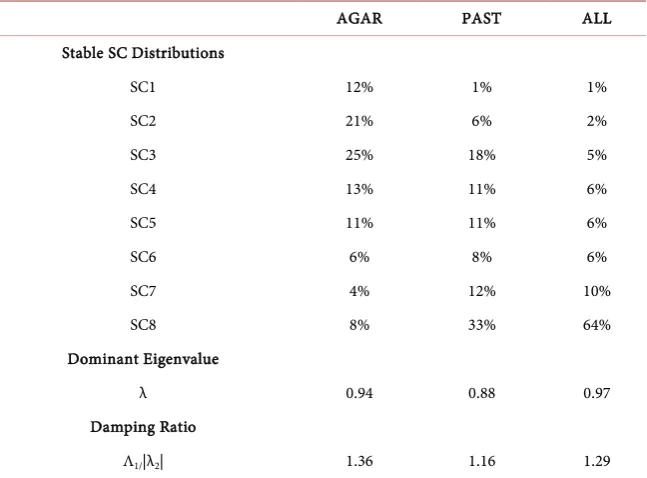
3.4. Stable Size Class Distributions, Dominant Eigenvalues, and
Damping Ratios
The stable size class distributions (i.e. the eigenvectors associated with the do-minant eigenvalues), dodo-minant eigenvalues and damping ratios were determined for agariciids, P. asteroides, and all 23 hard coral taxa pooled together (Table 7). The dominant eigenvalues (λ) were <1, which result in gradual population decay [6]. The damping ratios were 1.12 - 1.36, indicating the hard corals approach asymptotic behavior (stability) at similar rates among the taxa groups (i.e. simi-lar resilience/recovery rates following a disturbance) [12].
3.5. Sensitivities and Elasticities
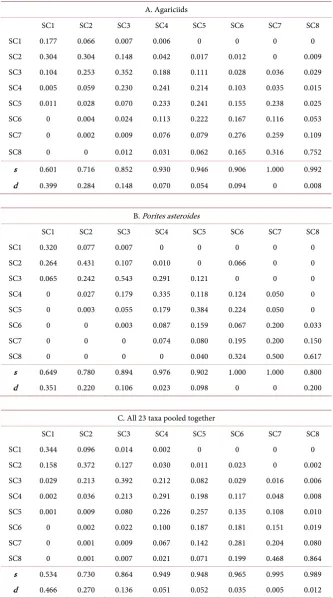
DOI: 10.4236/ojms.2018.81010 206 Open Journal of Marine Science Table 6. Mean annual transition probability matrices.
A. Agariciids
SC1 SC2 SC3 SC4 SC5 SC6 SC7 SC8
SC1 0.177 0.066 0.007 0.006 0 0 0 0
SC2 0.304 0.304 0.148 0.042 0.017 0.012 0 0.009
SC3 0.104 0.253 0.352 0.188 0.111 0.028 0.036 0.029 SC4 0.005 0.059 0.230 0.241 0.214 0.103 0.035 0.015 SC5 0.011 0.028 0.070 0.233 0.241 0.155 0.238 0.025
SC6 0 0.004 0.024 0.113 0.222 0.167 0.116 0.053
SC7 0 0.002 0.009 0.076 0.079 0.276 0.259 0.109
SC8 0 0 0.012 0.031 0.062 0.165 0.316 0.752
s 0.601 0.716 0.852 0.930 0.946 0.906 1.000 0.992
d 0.399 0.284 0.148 0.070 0.054 0.094 0 0.008
B. Porites asteroides
SC1 SC2 SC3 SC4 SC5 SC6 SC7 SC8
SC1 0.320 0.077 0.007 0 0 0 0 0
SC2 0.264 0.431 0.107 0.010 0 0.066 0 0
SC3 0.065 0.242 0.543 0.291 0.121 0 0 0
SC4 0 0.027 0.179 0.335 0.118 0.124 0.050 0
SC5 0 0.003 0.055 0.179 0.384 0.224 0.050 0
SC6 0 0 0.003 0.087 0.159 0.067 0.200 0.033
SC7 0 0 0 0.074 0.080 0.195 0.200 0.150
SC8 0 0 0 0 0.040 0.324 0.500 0.617
s 0.649 0.780 0.894 0.976 0.902 1.000 1.000 0.800
d 0.351 0.220 0.106 0.023 0.098 0 0 0.200
C. All 23 taxa pooled together
SC1 SC2 SC3 SC4 SC5 SC6 SC7 SC8
SC1 0.344 0.096 0.014 0.002 0 0 0 0
SC2 0.158 0.372 0.127 0.030 0.011 0.023 0 0.002
SC3 0.029 0.213 0.392 0.212 0.082 0.029 0.016 0.006 SC4 0.002 0.036 0.213 0.291 0.198 0.117 0.048 0.008 SC5 0.001 0.009 0.080 0.226 0.257 0.135 0.108 0.010
SC6 0 0.002 0.022 0.100 0.187 0.181 0.151 0.019
SC7 0 0.001 0.009 0.067 0.142 0.281 0.204 0.080
SC8 0 0.001 0.007 0.021 0.071 0.199 0.468 0.864
s 0.534 0.730 0.864 0.949 0.948 0.965 0.995 0.989
d 0.466 0.270 0.136 0.051 0.052 0.035 0.005 0.012
DOI: 10.4236/ojms.2018.81010 207 Open Journal of Marine Science Table 7. Stable size class distributions, dominant eigenvalues, and damping ratios.
AGAR PAST ALL
Stable SC Distributions
SC1 12% 1% 1%
SC2 21% 6% 2%
SC3 25% 18% 5%
SC4 13% 11% 6%
SC5 11% 11% 6%
SC6 6% 8% 6%
SC7 4% 12% 10%
SC8 8% 33% 64%
Dominant Eigenvalue
λ 0.94 0.88 0.97
Damping Ratio
Λ1/|λ2| 1.36 1.16 1.29
Stable size class distributions and eigenvalues from mean annual transition probability matrices.
amount and by a specific proportion, respectively [6][7]. Sensitivity and elastic-ity matrices, displayed graphically as surface plots (Figure 6), indicated that the dominate eigenvalues, λ, are most affected by changes in the upper right corners of the matrices which correspond to the stability of SC8, the partial mortality of SC8 colonies into smaller size classes, and the growth of SC7 into SC8 colonies.
3.6. Population Projections
The mean annual size class transition probability matrices were used to project populations within the monitoring stations through 2040 (Figure 7), the year by which the reefs around Little Cayman has been projected to experience annual severe coral bleaching [13][14]. These projections are idealized, best case scena-rios which assume no environmental disturbances or changes in the vital rates (i.e. size class transition probabilities, recruitment rates).
1) The number of P. asteroides colonies is projected to decline by 23% over the 13 years following this study until a stable population distribution is reached. The largest changes in the population structure are projected to be a 16% decline in SC1, a 10% decline in SC2, and a 10% increase in SC8. The mid-sized colonies (SC3-SC7) are projected to increase by ≤4% each. The trend toward larger colonies is projected to nearly balance with the decline in the number of colonies, resulting in a ≤1% increase in the total area cov-er of P. asteroides in 2040 compared to 2015 (assuming the mean surface area of SC8 corals remains unchanged within this timeframe).
DOI: 10.4236/ojms.2018.81010 208 Open Journal of Marine Science Figure 6. Sensitivity and Elasticity Surface Plots. Fate and State axes represent transitions between size classes. Vertical axes represent the sensitivity and elasticity of the respective population growth rates, λ, to perturbation analyses. Color coding: 0.0 - 0.2 = green; 0.2 - 0.4 = yellow; 0.4 - 0.6 = orange; 0.6 - 0.8 = red.
[image:13.595.211.530.466.628.2]DOI: 10.4236/ojms.2018.81010 209 Open Journal of Marine Science
the starting population. The largest changes are projected to be 6% - 9% decreases in SC1-SC3 and a 14% increase in SC8. The total area cover of agariciids is projected to be 2% higher in 2040 than in 2015.
3) The number of hard corals (all taxa pooled together) is projected to decline by 13% for six years, and to require 19 years to fully recover to the popula-tion size recorded at the beginning of this study in 2010. The largest change is projected to be a 22% increase in SC8 colonies (Figure 2). Insufficient sample sizes and data were available (i.e. mean surface areas of SC8 colo-nies for each of the 18 common and rare taxa groups) to project the impact this change may have on the total area cover.
Projections were recalculated for the hardcoral population within the moni-toring stations under three mild disturbance scenarios (Figure 7). Each scenario assumes no change in size class transition probabilities or recruitment rates after each disturbance. An interval of five years between disturbance events was cho-sen to start each scenario because this is the mean timeframe between the seven most recent bleaching events observed in Little Cayman since 1985 which re-sulted in ≥5% mortality [3][4][15][16][17]. In the months following the 2015 data collection for this study, Little Cayman experienced an elevated tempera-ture anomaly that resulted in >80% paling and bleaching in many taxa including
S. siderea[18], agariciids, Orbicella annularis, O. faveolata, O. franksi, Porites furcata, and S. radians (unpublished data). However, recovery was widespread with only an estimated 5% - 10% mortality (personal observations). The distur-bance scenarios were, therefore, based on the most recent mortality event in Lit-tle Cayman. Scenario #1 is based on 10% mortality every five years. Scenarios #2 (10% mortality) and #3 (5% mortality) have the following disturbance frequen-cies: one five-year interval, two four-year intervals, two three-year intervals, and two two-year intervals. Scenarios #1 and #3 give resilient populations sufficient time to recover from the mild disturbances but not enough to recover from the downward trends that are projected to continue during non-disturbance years. Scenario #2 results in a steadily declining population which is projected to drop 30% by 2040.
4. Discussion
Agariciids, Porites asteroides, and Siderastrea radians have replaced acroporids as the predominant massive corals on the shallow reefs around Little Cayman. These resilient and resistant corals have characteristics of “long-term winners” [19]: the agariciids rapidly regrow following disturbances; P. asteroides are thermally tolerant and persistent; and S. radians are prolific recruiters.
Agariciids are the most dynamic of the hard coral taxa: recruit survival is rela-tively high compared to other taxa and colonies are capable of transitioning as many as six size classes up or down in a single year. Those colonies that reach SC4-SC8 (≥30 cm2) have a ≥ 90% chance of survival to the next year. These life
DOI: 10.4236/ojms.2018.81010 210 Open Journal of Marine Science
to bleaching [3][4] and were observed to be among the early indicators of reef stress during the elevated seawater temperatures which followed the end of this study in 2015. These corals have the capacity to recover quickly after a distur-bance compared to other taxa. Yet, despite this resiliency, the agariciid popula-tion is slowly declining because whole colony mortality currently exceeds re-cruitment.
Porites asteroides are characterized as persistent because they are slow to change: two-thirds of the colonies either remain in the same size class or transi-tion (grow/shrink) only one size class each year. Previous studies in St. John, U.S. Virgin Islands recorded similar size class transition probabilities among this species [20]. Mid-sized P. asteroides colonies (12 - 150 cm2) have a ≥90% chance
of survival to the next year during non-disturbance environmental conditions. Vital rates indicate that the slight decrease in the number of colonies is balanced by the growth of the surviving colonies such that live area cover is relatively sta-ble.
Siderastrea radians are the most prolific recruiters during this study; however, the high recruit settlement is accompanied by the lowest recruit survival among the taxa. The recruitment pulse that occurred in 2011 did not result in a signifi-cant increase in coral area cover. S. radians colonies remain small, rarely ex-ceeding SC2 (12 cm2) and together contribute only 1% of the live area cover.
The ecological succession of these taxa, along with S. siderea, following the loss of acroporids has been observed on reefs throughout the Caribbean [21]. The results of this study indicate that the ecological succession in Little Cayman may have reached its peak and 25% live coral cover [1] [4] may be the new best-case scenario. The overall hard coral population is projected to gradually decline even during non-disturbance environmental conditions (i.e. conditions similar to those which occurred in 2010-2015). Similar downward population trends have also been projected for other Caribbean massive coral assemblages such as P. asteroides, Diploria strigosa, and Orbicella annularis in the U.S. Vir-gin Islands [21][22] as well as O. annularis and Agaricia agaricites in Jamaica [23].
Coral communities have been shown to require 10 - 30 years to recover after a significant mortality event (e.g. [24][25][26][27]. However, the frequency, tensity, and duration of disturbances that impact coral reefs are predicted to in-crease as a result of climate change [28]-[33]. Temperature-induced bleaching disturbances already occur on average every five years in Little Cayman and are expected to become an annual event around 2040 [13][14]. Such regularity may not allow sufficient time for full recovery to pre-disturbance community struc-tures.
5. Conclusions
DOI: 10.4236/ojms.2018.81010 211 Open Journal of Marine Science
used as baseline comparisons when conducting reef health surveys, when re-porting the effects of disturbances on coral communities, or when developing predictive ecological models. With declining populations during non-disturbance conditions, Little Cayman’s reefs are at risk of severe degradation should a large proportion of the SC8 colonies become compromised due to natural or anthro-pogenic stresses. Current recruitment levels cannot replace losses associated with minor disturbance events (e.g. 5% - 10% mortality).
The fate of hard corals on Little Cayman’s reefs was determined to be heavily dependent on the health and transitions of agariciid colonies. Conservation strategies that currently focus on Acropora cervicornis and A. palmata restora-tion e.g. [34] [35] should be expanded to include agariciids, which were pre-viously considered “weeds”. Improvements to agariciid transition probabilities that increase survival and progression toward the stable size class distribution (e.g. recruit settlement, recruit and SC1-3 survival, growth towards SC8 colony sizes) may slow or reverse the projected population declines while ongoing ef-forts to restore the keystone coral populations are underway.
Acknowledgements
The authors thank the Cayman Islands Department of Environment for issuing the permit to install the monitoring station markers. The Central Caribbean Ma-rine Institute (CCMI) allowed the authors to collect underwater images during its undergraduate field programs and annual monitoring dive trips. The Nation-al Science Foundation provided partiNation-al funding for travel to/from Little Cayman and field support during the 2014-2016 Research Experience for Undergraduates (Grant OCE-1358600).
References
[1] Jackson, J.B.C, Donovan, M.K., Cramer, K.L. and Lam, W. (2014) Status and Trends of Caribbean Coral Reefs: 1970-2012. Global Coral Reef Monitoring Network, IUCN, Gland, Switzerland.
[2] Dromard, C.R., McCoy, C.M.R. and Turner, J.R. (2010) Measuring the Performance of Marine Protected Areas: the Case of Little Cayman and Cayman Brac, Cayman Islands. Proceedings of the 63rd Gulf and Caribbean Fisheries Institute, San Juan, Puerto Rico, 246-253.
[3] van Hooidonk, R.J., Manzello, D.P., Moye, J., Brandt, M.E., Hendee, J.C., McCoy, C. and Manfrino, C. (2012) Coral Bleaching at Little Cayman, Cayman Islands 2009. Estuarine, Coastal and Shelf Science, 106, 80-84.
https://doi.org/10.1016/j.ecss.2012.04.021
[4] Manfrino, C., Jacoby, C.A., Camp, E. and Frazer, T.K. (2013) A Positive Trajectory for Corals at Little Cayman Island. PLoS ONE, 8, e75432.
https://doi.org/10.1371/journal.pone.0075432
DOI: 10.4236/ojms.2018.81010 212 Open Journal of Marine Science
[6] Caswell, H. (2001) Matrix Population Models: Construction, Analysis, and Inter-pretation. Sinauer Associates, Inc., Sunderland, MA.
[7] Owen-Smith, N. (2007) Introduction to Modeling in Wildlife and Resource Con-servation. Blackwell Publishing, Malden, MA.
[8] Hughes, T.P. and Jackson, J. (1985) Population Dynamics and Life Histories of Fo-liaceous Corals. Ecological Monographs, 55, 141-166.
https://doi.org/10.2307/1942555
[9] Babcock, R.C. (1991) Comparative Demography of Three Species of Scleractinian Corals Using Age- and Size-Dependent Classifications. Ecological Monographs, 61, 225-244. https://doi.org/10.2307/2937107
[10] Hughes, T.P. (1984) Population Dynamics Based on Individual Size Rather than Age: A General Model with a Reef Coral Example. The American Naturalist, 123, 778-795. https://doi.org/10.1086/284239
[11] Hood, G.M. (2010) PopTools Version 3.2.5. http://www.poptools.org
[12] Westerberg, L. and Wennergren, U. (2007) Matrix Models: A Tool for Landscape Management? In: Antonello, S.D., Ed., Frontiers in Ecology Research, Nova Science Publishers, New York, 141-163.
[13] van Hooidonk, R., Maynard, J., Tamelander, J., Gove, J., Ahmadia, G., Raymundo, L., Williams, G., Heron, S.F. and Planes, S. (2016) Local-Scale Projections of Coral Reef Futures and Implications of the Paris Agreement. Scientific Reports, 6, Article No. 39666. https://www.nature.com/articles/srep39666
https://doi.org/10.1038/srep39666
[14] van Hooidonk, R., Maynard, J., Tamelander, J., Gove, J., Ahmadia, G., Raymundo, L., Williams, G., Heron, S.F., Tracey, D., Parker, B. and Planes, S. (2017) Coral Bleaching Futures—Downscaled Projections of Bleaching Conditions for the World’s Coral Reefs, Implications of Climate Policy and Management Responses. United Nations Environment Programme, Nairobi, 69 p.
[15] Ghiold, J. and Smith, S. (1990) Bleaching and Recovery of Deep-Water, Reef Dwel-ling Invertebrates in the Cayman Islands, British West Indies. Caribbean Journal of Science, 26, 52-61.
[16] Coehlo, V. and Manfrino, C. (2007) Coral Community Decline at a Remote Carib-bean Island: Marine No-Take Reserves Are Not Enough. Aquatic Conservation: Marine and Freshwater Ecosystems, 17, 666-685.https://doi.org/10.1002/aqc.822
[17] Eakin, C., Morgan, J., Heron, S., Smith, T., Liu, G., et al. (2010) Caribbean Corals in Crisis: Record Thermal Stress, Bleaching, and Mortality in 2005. PLoS ONE, 5, e13969.https://doi.org/10.1371/journal.pone.0013969
[18] Banks, S. and Foster, K. (2017) Baseline Levels of Siderastrea siderea under Normal Environmental Conditions in Little Cayman. Open Journal of Marine Science, 7, 142-154.https://doi.org/10.4236/ojms.2017.71011
[19] Van Woesik, R., Sakai, K., Ganase, A. and Loya, Y. (2011) Revisiting the Winners and the Losers a Decade after Coral Bleaching. Marine Ecology Progress Series, 434, 67-76.https://doi.org/10.3354/meps09203
[20] Edmunds, P.J. (2010) Population Biology of Porites asteroides and Diploria strigosa on a Shallow Caribbean Reef. Marine Ecology Progress Series, 418, 87-104.
https://doi.org/10.3354/meps08823
DOI: 10.4236/ojms.2018.81010 213 Open Journal of Marine Science
[22] Edmunds, P.J. (2015) A Quarter-Century Demographic Analysis of the Caribbean Coral, Orbicella annularis, and Projections of Population Size over the Next Cen-tury. Limnology and Oceanography, 60, 840-855.https://doi.org/10.1002/lno.10075
[23] Hughes, T.P. and Tanner, J.E. (2000) Recruitment Failure, Life Histories, and Long-Term Decline of Caribbean Corals. Ecology, 81, 2250-2263.
https://doi.org/10.1890/0012-9658(2000)081[2250:RFLHAL]2.0.CO;2
[24] Connell, J.H. (1997) Disturbance and Recovery of Coral Assemblages. Coral Reefs, 19, S101-S113.https://doi.org/10.1007/s003380050246
[25] Ninio, R., Meekan, M., Done, T. and Sweatman, H. (2000) Temporal Patterns in Coral Assemblages on the Great Barrier Reef from Local to Large Spatial Scales. Marine Ecology Progress Series, 194, 65-74.https://doi.org/10.3354/meps194065
[26] Bruno, J.F. and Selig, E.R. (2007) Regional Decline of Coral Cover in the In-do-Pacific: Timing, Extent and Subregional Comparisons. PLoS ONE, 2, e711.
https://doi.org/10.1371/journal.pone.0000711
[27] Foster K.A., Foster, G. and Al-Harthi, S. (2013) Coral Assemblages in the Southeas-tern Arabian Gulf (Qatar and Abu Dhabi, UAE): Various Stages of Acropora Eeco-very a Decade after Recurrent Elevated Temperature Anomalies. Open Journal of Marine Science, 3, 28-29.https://doi.org/10.4236/ojms.2013.32A004
[28] Hoegh-Guldberg, O. (1999) Climate Change, Coral Bleaching and the Future of the World’s Coral Reefs. Marine and Freshwater Research, 50, 839-866.
https://doi.org/10.1071/MF99078
[29] Emanual, K. (2005) Increasing Destructiveness of Tropical Cyclones over the Past 30 Years. Nature, 436, 686-688.https://doi.org/10.1038/nature03906
[30] Webster, P., Holland, G., Curry, J.A. and Chang, H.-R. (2005) Changes in Tropical Cyclone Number, Duration, and Intensity in a Warming Environment. Science, 309, 1844-1847.https://doi.org/10.1126/science.1116448
[31] Riegl, B.M. and Purkis, S.J. (2009) Model of Coral Population Response to Accele-rated Bleaching and Mass Mortality in a Changing Climate. Ecological Modeling, 220, 192-208.https://doi.org/10.1016/j.ecolmodel.2008.09.022
[32] Fabina, N.S., Baskett, M.L. and Gross, K. (2015) The Differential Effects of Increas-ing Frequency and Magnitude of Extreme Events on Coral Populations. Ecological Applications, 25, 1534-1535.https://doi.org/10.1890/14-0273.1
[33] Randall, C.J. and van Woesik, R. (2017) Some Coral Diseases Track Climate Oscilla-tions in the Caribbean. Scientific Reports, 7, Article No. 5719.
https://www.nature.com/articles/s41598-017-05763-6
https://doi.org/10.1038/s41598-017-05763-6
[34] Lohr, K.E., Bejarano, S., Lirman, D., Schopmeyer, S. and Manfrino, C. (2015) Opti-mizing the Productivity of a Coral Nursery Focused on Staghorn Coral Acropora cervicornis. Endangered Species Research, 27, 243-250.
https://doi.org/10.3354/esr00667
[35] Lohr, K.E., Cook McNab, A.A, Manfrino, C. and Patterson, J.T. (2017) Assessment of Wild and Restored Staghorn Coral Acropora cervicornis across Three Reef Zones in the Cayman Islands. Regional Studies in Marine Science, 9, 1-8.