ORIGINAL
RESEARCH
Cerebral CT Perfusion Using an Interventional
C-Arm Imaging System: Cerebral Blood Flow
Measurements
A. Ganguly A. Fieselmann M. Marks J. Rosenberg J. Boese Y. Deuerling-Zheng M. Straka G. Zaharchuk R. Bammer R. Fahrig
BACKGROUND AND PURPOSE: CTP imaging in the interventional suite could reduce delays to the start of image-guided interventions and help determine the treatment progress and end point. However, C-arms rotate slower than clinical CT scanners, making CTP challenging. We developed a cerebral CTP protocol for C-arm CBCT and evaluated it in an animal study.
MATERIALS AND METHODS: Five anesthetized swine were imaged by using C-arm CBCT and conventional CT. The C-arm rotates in 4.3 seconds plus a 1.25-second turnaround, compared with 0.5 seconds for clinical CT. Each C-arm scan had 6 continuous bidirectional sweeps. Multiple scans each with a different delay to the start of an aortic arch iodinated contrast injection and a novel image reconstruction algorithm were used to increase temporal resolution. Three different scan sets (consisting of 6, 3, or 2 scans) and 3 injection protocols (3-mL/s 100%, 3-mL/s 67%, and 6-mL/s 50% contrast concentration) were studied. CBF maps for each scan set and injection were generated. The concordance and Pearson correlation coefficients (and r) were calculated to determine the injection providing the best match between the following: the left and right hemispheres, and CT and C-arm CBCT.
RESULTS: The highestandrvalues (both 0.92) for the left and right hemispheres were obtained by using the 6-mL 50% iodinated contrast concentration injection. The same injection gave the best match for CT and C-arm CBCT for the 6-scan set (⫽0.77,r⫽0.89). Some of the 3-scan and 2-scan protocols provided matches similar to those in CT.
CONCLUSIONS:This study demonstrated that C-arm CBCT can produce CBF maps that correlate well with those from CTP.
ABBREVIATIONS:AIF⫽arterial input function; CBCT⫽conebeam CT; CBF⫽cerebral blood flow; CBV⫽cerebral blood volume; CCA⫽common carotid artery; CCC⫽concordance correlation coefficient; CTP⫽CT perfusion; MTT⫽mean transit time; DSA⫽digital subtraction angiography; DWI⫽diffusion-weighted imaging; FLAIR⫽fluid-attenuated inversion recovery; HCl⫽hydrchloric acid; IA⫽intra-arterial; IV⫽intravenous; mAs⫽milliampere second; pCO2⫽end-tidal partial pressure of CO2; PWI⫽perfusion-weighted imaging; ROI⫽region of interest; TDC⫽time-density curve; Tmax⫽time-to-maximum; TTP⫽time-to-peak
G
uidelines for early management of ischemic stroke
recom-mend IA therapies for selected patients in addition to or in
some cases in place of IV treatment.
1Imaging-selection
crite-ria by using either CTP or PWI/DWI may allow identification
of salvageable tissue. A primary requirement for success in
such procedures is that the intervention be conducted as soon
as possible after the onset of symptoms, often within 6 hours.
However, this physiologic imaging of salvageable tissue
repre-sents a “snapshot” of the brain parenchyma before treatment
is administered. In addition, reperfusion treatment may take
several hours to be completed during which time there is likely
to be a change in the perfusion state of the cerebral tissue. This
lessens the relevance and accuracy of the pretherapy CT or MR
imaging once treatment has started and the perfusion has been
altered.
2Tissue perfusion information during and immediately
fol-lowing the recanalization therapy may be helpful. Often
post-procedural imaging earlier than 24 hours is undertaken only if
symptomatic deterioration occurs. However, there is evidence
suggesting that postprocedural reperfusion imaging can
pro-vide a good measure of outcome. MR imaging studies
demon-strate that patients treated with IV tissue plasminogen
activa-tor who achieve early reperfusion within 3– 6 hours of therapy
and have mismatch have improved outcomes compared with
those patients without mismatch.
3Because the start of the
in-tervention is sometimes delayed and the inin-tervention itself
often takes hours to complete, intra- and postprocedural
per-fusion data could have clinical significance.
Intraprocedural CTP may also be useful for management
of hemodynamics during anesthesia (eg, blood pressure and
hydration parameters). This is important because some recent
studies
4,5have suggested that general anesthesia may result in
Received September 17, 2010; accepted after revision December 8.From the Department of Radiology (A.G., M.M., J.R., M.S., G.Z., R.B., R.F.), Stanford University, Stanford, California; Pattern Recognition Laboratory (A.F.), Department of Computer Science, and Erlangen Graduate School in Advanced Optical Technologies (A.F.), Friedrich-Alexander University Erlangen-Nuremberg, Erlangen, Germany; and Siemens AG (A.F., J.B., Y.D.-Z.), Healthcare Sector, Forchheim, Germany.
This work was supported by the following sources: Siemens Medical Systems, the NIBIB (1K99EB007676 – 01A2), the Lucas Foundation, and Erlangen Graduate School In Advanced Optical Technologies.
Please address correspondence to Arundhuti Ganguly, PhD, Radiology Department, Stan-ford University, Richard M. Lucas Center for Imaging, 1201 Welch Rd, Room PS055, Stanford, CA 94305-5488; e-mail: aganguly@stanford.edu
Indicates open access to non-subscribers at www.ajnr.org
http://dx.doi.org/10.3174/ajnr.A2518
BRAIN
ORIGINAL
poorer outcomes after stroke. It is conceivable that these
poorer outcomes could be attributed to hypotension induced
during anesthesia.
Some recent publications by Ahmed et al
6,7suggest that the
availability of perfusion information in the angiographic suite
where the image-guided therapy is conducted could have
added value in stroke management. These authors have been
able to successfully obtain CBV maps in a canine model by
using an angiographic C-arm CBCT system. With a modified
injection and reconstruction scheme, the CBV maps obtained
were comparable with CT. However, the authors were not able
to obtain CBF or MTT and TTP parameter maps because of
the limited temporal resolution of the angiographic C-arm
systems currently available. The rotation speeds of the C-arms
are typically an order of magnitude slower than rotation times
in CT. Because these parameter maps are critical for complete
perfusion information,
8,9the usefulness of perfusion data
from the C-arm CBCT system can be complete if it provides
this information.
We have designed a method that will provide the CBF
in-formation directly from C-arm CBCT data. The CBV and
MTT can be calculated from the area under the TDC for the
CBV, and the ratio of the CBV to CBF provides the MTT.
Materials and Methods
Animal Preparation
We imaged cerebral perfusion in 5 large healthy female swine (54.1⫾
4.7 kg) under institutional review board approval. The animals were imaged on a CBCT system (Axiom Artis dTA and syngo DynaCT; Siemens, Erlangen, Germany) and also underwent CTP scans on a conventional CT scanner. The CTP for 2 animals was performed on a 64-section scanner (Somatom Sensation 64, Siemens), and the other 3 animals were imaged on an 8-section scanner (LightSpeed; GE Healthcare, Milwaukee, Wisconsin). A preanesthetic mixture of tile-tamine HCl and zolazepam HCl (Telazol) 5–7 mg/kg body weight, mixed with atropine, 0.05 mg/kg, into 1 syringe was given rapidly, intramuscularly into the neck muscle. Approximately 10 minutes later, the pig was in lateral recumbency and moved to the preparation area where the animal was accurately weighed, then placed on a face mask of isoflurane inhalant gas at 2%–3%, while an IV catheter was placed in the ear vein. When the animal was void of jaw and vagal tone, she was intubated and returned to isoflurane gas, which was reduced to 1.5%–2% as needed. Constant monitoring of the heart and respiratory rates, body temperature, fluid rate, jaw tone, blood gases, activated clotting time, and saturated oxygen levels was maintained. Following anesthetization and intubation, an IV catheter was placed, and the animal was mechanically ventilated. Femoral sheaths were placed for venous and arterial access.
Injection Protocol
An iodinated contrast agent (iohexol, 350 mg I/mL, Omnipaque; Nycomed, Princeton, New Jersey) was injected by using a program-mable dual-head power injector (Accutron HP-D; Medtron, Saar-bru¨cken, Germany). The contrast agent was delivered by using a 5F pigtail IA catheter (Vanguard; Medrad, Indianola, Pennsylvania)
placed at the root of the aortic arch under fluoroscopic guidance.5
A DSA run was used to verify that both left and right carotid arteries received approximately equal fractions of the contrast agent. During these test DSA runs, we found that the fraction of iodinated
contrast entering the left and right CCAs was sensitive to the location of the catheter tip in the aorta. The location directly impacts the
mix-ing of the contrast with blood, as has been found previously.10,11The
higher injection rates (6 mL/s compared with 3 mL/s) should provide better mixing before the contrast is washed out. The best location of the catheter was selected after a qualitative analysis of the DSA runs following tests at a few trial locations near the root of the aortic arch. Once the catheter location was found to be satisfactory, the portion of the catheter extending outside the sheath was taped to the skin next to the puncture to prevent gross dislocation.
All studies were performed by using the arterial contrast. The ar-terial approach was used because the C-arm CBCT system has lower contrast resolution, given that its dynamic range is smaller than that of CT (12 bits padded to 14 versus 20 bits, respectively). Hence an IV injection would need a much higher dose of iodinated contrast when imaged by using the C-arm CBCT system to allow the TDCs to be clearly measurable above the image noise. All injections were 8 sec-onds in duration. We tested 3 different injection volumes and 2
dif-ferent injection rates: set 1⫽3 mL/s, 67% dilution; set 2⫽6 mL/s,
50% dilution; set 3⫽3 mL/s, 100% dilution. The maximum total
volume of iodinated contrast was kept similar to that used clinically at our institution, which is between 40 and 50 mL. These 3 injections were used to understand whether faster injection rates were better for the same volume of injected contrast and whether diluting the con-trast but maintaining the same volume would give similar results, hence reducing the contrast load.
Image Acquisition Protocol
The primary limitation of the C-arm CBCT system is the slow rota-tion speed of the C-arm, which, in the imaging system used, is a 4.3-second rotation time per sweep, covering 191° with a 1.25-second turnaround time. Additionally, it can be set up for only 6 consecutive bidirectional scans at a time (DynaCT). Because 1 DynaCT scan set gives a maximum of 6 image volumes, it will result in sparsely sampled TDCs with a total of 5.55 seconds between each image volume. This outcome is expected to lead to errors, particularly in estimating the AIF needed to normalize the perfusion data as is done in standard calculation methods. One DynaCT run with 6 sweeps has an x-ray on-time of 25.8 seconds and a total imaging time of 32.05 seconds because of the finite turnaround time. The CTP scans by using the conventional CT scanner, on the other hand, use rotation times of 0.5 seconds with images acquired every 1 second (as is done clinically to spare dose) for a total of 50 seconds.
To overcome this speed limitation, we developed a targeted imag-ing scheme for perfusion imagimag-ing with the C-arm CBCT. We chose to increase the number of time points at which data were acquired by obtaining multiple DynaCT scans with each set, starting at a different delay with respect to the start of a repeated 8-second bolus of contrast agent. Fig 1 shows an example of this imaging scheme and the associ-ated improvement in the temporal sampling. A superset of 6 such
DynaCT scans (Fig 1A-F) was acquired by using the following
opti-mized delays for the start of the scans following each of the 6 contrast
injections:⫺4.6 seconds,⫺2.8 seconds,⫺0.9 seconds,⫹0.9 seconds,
⫹2.8 seconds, and⫹4.6 seconds. The negative signs indicate that
x-ray imaging started before the contrast injection, while positive signs indicate that the scan started after the injection. Between each scan, a baseline image was obtained. This allowed the removal of any existing enhancement from the iodinated contrast already on board following earlier injections.
C-arm CBCT system because of the availability of the large-area flat panel detector. The coverage was 3 cm on the Somatom and 2 cm on the LightSpeed for the conventional CTP scans.
All imaging on the C-arm CBCT system was performed at 81
kV(peak) with the dose to the detector set at 1.2Gy per projection.
Automatic exposure control was enabled to allow x-ray dose modifi-cation during rotation of the C-arm. A baseline image consisting of a single scan was acquired for subtracting the effect of any residual iodinated contrast from previous image acquisitions. For the CTP scans, the CT scanner was set to 80 kVp with a reference mAs of 270 for the Somatom and the LightSpeed. Total imaging time was set to 50 seconds, which included 10 seconds precontrast baseline imaging and 40 seconds of postcontrast imaging. A delay of 4 seconds following the injection of contrast was used because that is the lowest setting al-lowed on the scanner under the perfusion imaging protocol. The col-limations used in the 2 cases were 2.4 and 1.25 mm for the Somatom and LightSpeed, respectively.
Image Reconstruction Method
The image acquisition method for C-arm CBCT described above in-creases the number of sample points along the TDC. Each recon-structed dataset from a single sweep is, however, an average of the dynamics that happen over the 4.3 seconds during which each sweep is completed. Also the projection data acquired during the C-arm CBCT acquisition is irregularly sampled, given the bidirectional sweep with finite turnaround. To compensate for these effects, we use a modified image reconstruction scheme. The algorithm involves first reorganizing the acquired 2D projection datasets from the 6 scans (each containing data from 6 sweeps) such that the datasets are
se-quential in time. Reconstruction of the data is based on an extension12
of the work by Montes13and Montes and Lauritsch.14Briefly, this
involves dividing the data from 1 sweep into several equiangular blocks, which, in our case, were optimized to be 6 blocks. The as-sumption is that the change of the attenuation values during the time required to scan each block is negligible. Initial backprojection (voxel
size 0.5⫻0.5⫻0.5 mm) of the data from each block is performed,
followed by temporal interpolation of values between blocks for each voxel, assuming a smooth contrast-induced temporal-enhancement function. In this work, a linear interpolation was used to provide regularly sampled data in intervals of 1 second.
To investigate the possibility of reducing the number of scans below 6, we also reconstructed some subsets of the superset of 6 scans. Reducing the scan number should reduce the x-ray and iodinated
contrast dose and the procedure time as well as ease workflow, mak-ing the approach clinically relevant. Only those scan combinations that were practical from the point of view of covering a large portion of the TDCs and that sampled the rising part of the curves well were considered. As described before, we denote the x-ray delay times with
letters from A to F (A⫽ ⫺4.6 seconds, B⫽ ⫺2.8 seconds, C⫽ ⫺0.9
seconds, D⫽ ⫹0.9 seconds, E⫽ ⫹2.8 seconds, F⫽ ⫹4.6 seconds).
The sets of 3 scans analyzed were ABC, ACE, BCD, and BDF; sets of 2 scans considered were AB, AC, AD, BC, and BD; and single scans were A, B, and C.
Image Preprocessing
To minimize the effects of motion-related artifacts, we applied a mo-tion-correction algorithm during image reconstruction on the basis
of a registration algorithm that uses mutual information.15,16Each
timeframe was registered onto the first (baseline) image.
The CTP images were initially reconstructed at the highest
reso-lution of 0.4⫻0.4⫻2.4 mm in the case of data from the Somatom
and 0.5⫻0.5⫻1.25, from the LightSpeed. This reconstruction was
performed to facilitate volume registration between the C-arm CBCT data and the CTP data. Image registration with a rigid transform method was used to orient the C-arm CBCT volume to match the CTP data. Thick sections (typically 10 mm) are used for generating clinical perfusion maps; therefore, following image registration, the sections were binned to 9.6 mm in the case of data from the Somatom and 10.0 mm in the case of data from the LightSpeed. This step re-sulted in 3 reconstructed sections for the first 2 animals and 2 sections for the last 3. To remove any bias in the statistical analysis, we used only 2 sections per animal. The reoriented C-arm CBCT data were also binned into sections of equal thickness to allow direct compari-son of perfusion maps.
Perfusion Calculations
We developed CBF map-calculation software in-house instead of
us-ing standard software packages.10This was done to allow seamless
integration into the image processing pipeline. The CBF maps were
computed by using the deconvolution approach.17,18For
deconvolu-tion, singular-value decomposition with a fixed regularization threshold (20% of the maximum singular value) was applied. The AIF was manually selected from the reconstructed sections. The vessel selected was a branch of the left CCA that supplies blood to the rete mirabile. Obtaining an AIF in arteries downstream from the rete was difficult, particularly in the CTP images because of partial volume effect. Corrections for brain attenuation (1.04 g/mL of tissue) and hematocrit differences of 0.73 (valid for human brain) between large vessels and capillaries were applied. Hence, it was assumed that the maps represented quantitative parameters of perfusion of the sub-ject’s brain.
Statistical Analysis
The CBF values for the C-arm CBCT data were compared with the CT results. The dataset consisted of 2 sections per animal for the 5 swine imaged. In every section, circular regions of interest were drawn in each of the 2 hemispheres in the white matter (3 regions of interest) and gray matter (2 regions of interest) and over a large area (1 region of interest) containing both white and gray matter. The region-of-interest diameters were 1, 2, and 20 mm for the regions of region-of-interest in the white, gray, and overall regions, respectively. The average and SD in the CBF values were calculated in each of the 12 regions of interest per section, resulting in 120 data points in all. Additionally, we also Fig 1.Temporal spacing of different scan sets to allow higher temporal sampling. The
[image:3.594.53.283.44.183.2]analyzed the results from some selected subscans from the set of 6 scans (3 scans, 2 scans, and 1 scan) to study whether CTP was feasible with fewer scans, which could potentially make the CTP imaging with the C-arm more viable clinically by reducing the x-ray and contrast dose as well as reducing the image-acquisition and processing time.
For each dataset, averages and SDs were calculated for each of the 12 regions of interest in the different hemispheres, tissue types, and injection protocols. The Bland-Altman plots for
average-versus-mean difference, the CCC () and the Pearson correlation coefficient
(r) for a match between the left and right hemisphere CBF values on
CT alone and the agreement between CT and C-arm CBCT data were also calculated. The CCC measures the exact match between values from the 2 systems, whereas the Pearson correlation coefficient tracks how well the values correlate with or change with respect to each other. The CBF maps acquired from the clinical CT data were used as the criterion standard for the calculations. All statistical analyses were done with STATA, Release 9.2 (StataCorp, College Station, Texas).
Results
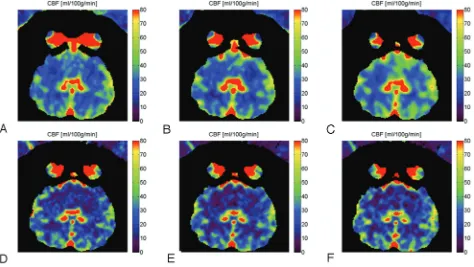
The representative CBF maps in 1 of the animals are shown in
Fig 2. The results from different injections are compared
be-tween C-arm CBCT (top row) and clinical CT (bottom row).
A qualitative analysis shows that the CBF values for the 2
im-aging modalities have a similar range of values. The calculated
CBF values from clinical CTP measurements ranged from 3.5
to 71.2 mL/100 g/min, with the average value ranging from
39.81
⫾
11.96 to 49.80
⫾
8.61 mL/100 mg/min for white
mat-ter and 13.43
⫾
5.89 to 25.36
⫾
14.47 mL/100 mg/min for gray
matter. The lower values in the range were associated with the
6-mL/s 50% iodinated contrast injection, while the higher
val-ues were obtained for the 3-mL/s 67% iodinated contrast
in-jection. There were significant effects of tissue type (
P
⬍
.001)
and injection method (
P
⬍
.001). The average differences in
the CBF values between the 2 hemispheres for gray and white
matter, their SDs, and overall
and
r
values measured for the
3 injections for CT alone are shown in Table 1. Because the
animals imaged were healthy adults, it is expected that the CBF
values in the 2 hemispheres will have a close match. The
high-est correlation coefficients were obtained for the 6-mL/s 50%
iodinated contrast injection.
[image:4.594.56.530.46.313.2]The CBF maps calculated from some of the selected 3-scan,
2-scan, and single-scan protocols that had the most promising
results are shown in Fig 3. For comparison, the CBF maps
Fig 2.CBF maps for 6-scan sets (A-B-C-D-E-F) from different injection-protocol C-arm CBCT (A⫺C) and CTP images (D⫺F). The 3 injection protocols used are 3 mL/s 67% (AandD), 6 mL/s 50% (BandE), and 3 mL/s 100% (CandF). All injections had a duration of 8 seconds.Table 1: Difference in CBF between right and left hemispheres calculated from the clinical CT images only, for ROIs located in located in grey or white matter in the 2 hemispheresa
Injection Method
Difference in CBF between Left and Right Hemispheres (mL/100 g/min)
White Matter Grey Matter 6 mL/s 50%
Mean 2.04 1.98
SD 6.03 6.77
Overall 0.92
Overallr 0.92
3 mL/s 100%
Mean 0.75 0.26
SD 7.86 9.49
Overall 0.84
Overallr 0.84
3 mL/s 67%
Mean 0.73 0.61
SD 9.24 6.74
Overall 0.90
Overallr 0.90
a
[image:4.594.300.532.383.574.2]from an equivalent CT section and from the complete 6-scan
dataset are also shown.
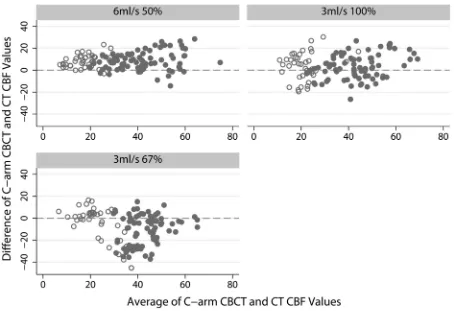
Bland-Altman plots for the CBF data from CT and C-arm
CBCT images are shown in Fig 4. The gray matter data are
shown as filled gray circles, and white matter, by empty circles.
These plots show that, on average, the 6-mL/s 50% iodinated
Fig 3.Results of CBF values for the 6-mL/s 50% contrast injection.(A), CTP, C-arm CBCT for scan sets (B), A-B-C-D-E-F (C), B-D-F (D), A-C (E), B-D and (F) B. [image:5.594.50.536.48.314.2] [image:5.594.65.519.342.653.2]contrast-concentration injection resulted in the least spread
about the zero mean and appeared to have a slight linear bias
with a positive intercept value.
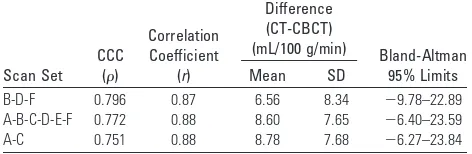
The
and
r
values for evaluating the match in CBF value
between CBCT and CT show the best results for the 6-mL/s
50% concentration. Table 2 shows the results for the top 3 scan
set choices for this injection protocol. The set A-B-C-D-E-F
consists of the 6 complete scans, while B-D-F and A-D are
subsets consisting of 3 and 2 scans, respectively. The difference
in the
and
r
values implies an inherent bias in the results. This
was also observed in the Bland-Altman plots shown in Fig 4.
Once this is removed, the 2 correlation coefficients should be
identical.
No significant changes in heart rate or pCO
2level were
observed when the animal was imaged on the 2 scanners. The
average difference in heart rate was 5.48
⫾
5.17 beats per
min-ute, and in the pCO
2value, it was 1.29
⫾
6.18 mm Hg.
Discussion
In the above study, we measured CBF in the pig brain by using
a C-arm CBCT and compared it with CBF measurements
from the same animal acquired by using a conventional CT
scanner. Although only the CBF maps have been shown, it is
possible to calculate the corresponding CBV, MTT, TTP, and
Tmax maps, which are all derived from the same measured
TDCs that had been used for generating the CBF maps.
17,18These parameters have not been measured in this study,
though because they are derived from the CBF maps, the
cor-relation between C-arm CBCT and clinical CT for these
pa-rameters is expected to be similar to that of the CBF maps. A
more complete evaluation is currently underway to verify this.
The CBF maps from the C-arm CBCT data appear to be
smoother than the CT results (Fig 3). This finding could be
attributed to the various smoothing and interpolation steps
involved in calculating the CBF from the C-arm CBCT data to
overcome the low temporal sampling. The CT data are
suffi-ciently sampled and hence do not require the temporal
inter-polation steps.
The results show that the C-arm CBCT perfusion maps
compare well with the corresponding CT maps even for 6, 3, or
2 multisweep scan sequences. This similarity indicates that
including perfusion imaging in the workflow for
image-guided intervention in the management of stroke may be
fea-sible. This can be further assisted by newer CBCT systems with
faster rotation times of
⬃
3 seconds (Artis zeego, Siemens).
The use of 2 scans translates to a lower dose of iodinated
con-trast agent (eg, 2 scans require 2
⫻
3 mL/s for 8 seconds
⫽
48
mL of iodinated contrast at 100% contrast concentration)
needed for imaging. In addition, it may be possible to
investi-gate the perfusion imaging with the C-arm CBCT system by
using an IV instead of an IA injection, where the injected
vol-ume could now be increased because only 2 injections would
be needed. All of these studies were conducted on healthy
an-imals. In ischemic models in which the flow is typically slower,
this method should produce comparable or better results
be-cause of a greater likelihood of improved temporal sampling
of the TDC.
For this study, we have only tested 2 different injection
rates and dilutions. It could be possible to further optimize the
injection for increased accuracy of the results. Also, we have
used a simple step injection profile. However, the injector used
allows programming of fairly arbitrary profile shapes if desired
(this feature is currently available only for research purposes).
Using an injection profile that is optimized for the best mixing
of iodinated contrast with blood flow in the aortic arch could
further improve the results.
In these studies, we have used an aortic arch injection to
allow multiple iodinated contrast injections at lower volumes
for greater image contrast in C-arm CBCT imaging. However,
it should not be a barrier to adopting this technique clinically
because patients will be undergoing arterial catheterization for
their endovascular therapy. Hence, it does not change the
treatment workflow.
As mentioned above, the flow of contrast into the 2 cerebral
hemispheres is sensitive to the location of the catheter tip in
the aortic arch. For this study, a DSA image was used to
esti-mate qualitatively whether the iodinated contrast was flowing
evenly in the 2 CCAs. More recently, we have developed an
automated method for quantitative measurement to ensure
even distribution of the iodinated contrast in the 2 arteries.
19The first step involves automatic segmentation of the CCAs
from DSA images. The average ratio of the area under the
curve from pixels in equal lengths of the 2 arteries is then
calculated. For the ideal location of the catheter tip, this ratio is
1. For 6 animals, including those from this study, the ratio for
the final location was found to be 0.99
⫾
0.14 (3-mL/s
injec-tion rate), and 1.10
⫾
0.13 (6-mL/s injection rate).
In these studies, the higher injection rate resulted in better
results. These could be attributed to better flow and improved
mixing of the contrast agent into the carotid arteries and less
loss of iodinated contrast into the subclavian arteries at the
higher flow rates. The bias in the results for the higher flow rate
could be a result of the various noise-smoothing and
interpo-lation algorithms used in processing the C-arm CBCT data
that is sensitive to the actual Hounsfield unit value in the
im-age. However, if the overall systematic bias for a given
injec-tion protocol is known, it can be accounted for as a calibrainjec-tion
factor in calculating the final numbers.
Also, in this study, we assumed that the physiologic
re-sponse following the contrast injections was identical for all 3
injection protocols. The effect of the cardiac cycle that causes
variations in the cerebral blood flow
20was ignored. Due to
hardware constraints, it was not possible to include
cardiac-gated injection of contrast agents. Including features such as
electrocardiogram triggering the start of the injection, as
shown in a recent publication,
21could improve the outcome.
In future studies, this feature will also be included and all
in-Table 2: Statistical results comparing the CBF values from CT and CBCT from different scan sets for the 6-mL/s 50% contrast-concentration injection protocola
Scan Set CCC
()
Correlation Coefficient
(r)
Difference (CT-CBCT)
(mL/100 g/min) Bland-Altman
95% Limits Mean SD
B-D-F 0.796 0.87 6.56 8.34 ⫺9.78–22.89 A-B-C-D-E-F 0.772 0.88 8.60 7.65 ⫺6.40–23.59 A-C 0.751 0.88 8.78 7.68 ⫺6.27–23.84
[image:6.594.51.287.81.158.2]jections will start at the same cardiac phase to eliminate any
effect of the cyclic cardiac output.
With respect to dose to the patient, the C-arm CBCT
sys-tem was not optimized for dose reduction for these studies.
Including modifications such as increased collimation and a
head-specific bow-tie filter could potentially reduce the dose
in C-arm CBCT imaging.
In this study, only healthy pigs were considered. It is
ex-pected that in case of acute ischemic stroke, the CBF values will
be lower
22than those in the healthy patient. This would
cor-respond to slower tissue enhancement and hence a better
op-portunity to get good temporal sampling of the data. Further
investigation is required to test the limits of the reproducibility
of the CBF measurements for high-flow values.
Conclusions
In the above animal study, the set of 6 scans each with 6
⫻
4
second sweeps by using a C-arm CBCT resulted in CBF values
that were well-correlated with CTP CBF values. Use of as few
as 2 scans also resulted in well-correlated values. The 6-mL/s
injection containing 50% iodinated contrast produced the
best agreement for CBF values calculated from images
ob-tained from C-arm CBCT and clinical CT. The above results
indicate that using C-arm CBCT for cerebral perfusion
imag-ing is clinically feasible.
Acknowledgments
We thank Wendy Baumgardner and Pamela Hertz, for
pro-viding veterinary care and support during the studies, and Teri
Moore and Lior Molvin, for technical assistance during
imaging.
Disclosures: Arundhuti Ganguly,Research Support (including provision of equipment and materials):Siemens Medical Systems,Details: The author has partial salary funding support from a research fund provided by Siemens Medical Systems, Germany. Andreas Fieselmann,Research Support (including provision of equipment and materials):Siemens AG, Healthcare Sector, Forchheim, Germany,Details:Financial support for the preparation of a doctoral thesis. Jan Boese,Other Financial Relationships:Siemens AG, Healthcare Sector,Details:Employee. Yu Deuerling-Zheng,Other Financial Relationships:Siemens AG, Details:Employee. Greg Zaharchuk,Research Support (including provision of equipment and materials:GE Healthcare,Details:Support for postdoctoral students working on joint projects unrelated to this submission.Consultant:GE Healthcare,Details:Neuroradiology Advisory Board. Rebecca Farig,Research Support (including provision of equipment and materials:Siemens Medical Systems, AG,Details:The manufacturer provided sponsored research funding through channels approved by Stanford University. The funding supported 25% of 1 research associate, a small percentage (5%–15%) effort for 2 Stanford investigators, and all costs associated with the animal care and animal study. The manufacturer donated equipment for this study.Other Financial Relationships:IP relation-ship,Details:Siemens Medical Systems AG has nonexclusive licenses on several patents owned by Stanford University and Rebecca Fahrig. None of these patents have any relationship to the research described in this publication.
References
1. Adams HP, del Zoppo G, Alberts MJ, et al.Guidelines for the early manage-ment of adults with ischemic stroke: a guideline from the American Heart Association/American Stroke Association Stroke Council, Clinical
ogy Council, Cardiovascular Radiology and Stroke Council, Clinical Cardiol-ogy Council, Cardiovascular RadiolCardiol-ogy and Intervention Council, and the Atherosclerotic Peripheral Vascular Disease and Quality of Care Outcomes in Research Interdisciplinary Working Groups—the American Academy of Neurology affirms the value of this guideline as an educational tool for neu-rologists.Stroke2007;38:1655–711. Epub 2007 Apr 12
2. Powers WJ, Zivin J.Magnetic resonance imaging in acute stroke: not ready for prime time.Neurology1998;50:842– 43
3. Albers GW, Thijs VN, Wechsler L, et al.Magnetic resonance imaging profiles predict clinical response to early reperfusion: the diffusion and perfusion im-aging evaluation for understanding stroke evolution (DEFUSE) study.Ann Neurol2006;60:508 –17
4. McCarthy WJ, Park AE, Koushanpour E, et al.Carotid endarterectomy: lessons from intraoperative monitoring—a decade of experience.Ann Surg1996;224: 297–305, discussion 305– 07
5. Reich DL, Hossain S, Krol M, et al.Predictors of hypotension after induction of general anesthesia.Anesth Analg2005;101:622–28
6. Ahmed AS, Zellerhoff M, Strother CM, et al.C-Arm CT measurement of cere-bral blood volume: an experimental study in canines.AJNR Am J Neuroradiol
2009;30:917–22
7. Bley T, Strother CM, Pulfer K, et al.C-arm CT measurement of cerebral blood volume in ischemic stroke: an experimental study in canines.AJNR Am J Neu-roradiol2010;31:536 – 40
8. de Lucas EM, Sanchez E, Gutierrez A, et al.CT protocol for acute stroke: tips and tricks for general radiologists.Radiographics2008;28:1673– 87 9. Wintermark M, Sincic R, Sridhar D, et al.Cerebral perfusion CT: technique
and clinical applications.J Neuroradiol2008;35:253– 60
10. Kudo K, Sasaki M, Yamada K, et al.Differences in CT perfusion maps gener-ated by different commercial software: quantitative analysis by using identi-cal source data of acute stroke patients.Radiology2010;254:200 – 09 11. Lieber BB, Sadasivan C, Hao Q, et al.The mixability of angiographic contrast
with arterial blood.Med Phys2009;36:5064 –78
12. Fieselmann A, Ganguly A, Deuerling-Zheng Y, et al.A dynamic reconstruction approach for cerebral blood flow quantification with an interventional C-arm CT.In:Proceedings of the 2010 IEEE International Symposium on Biomedical Imaging: From Nano to Micro. Rotterdam, the Netherlands. April 14 –17, 2010:53–56
13. Montes P.Dynamic Cone-beam Reconstruction for Perfusion Computed Tomog-raphy.Heidelberg, Germany: Ruprecht-Karls-Universitat; 2006:165 14. Montes P, Lauritsch G.A temporal interpolation approach for dynamic
recon-struction in perfusion CT.Med Phys2007;34:3077–92
15.Proceedings of the International Conference on Information Processing in Medical Imaging—IPMI’ 95.June 26 –30, 1995, Ile de Berder, France. Bizais Y, Barillot C, and Di Paolo R (eds.)Computational imaging and vision,vol. 3, pp. 263–74. Kluwer Academic Publishers, 1995
16. Viola P, Wells WM III.Alignment by maximization of mutual information.In: Grimson E, Shafer S, Blake A, et al, eds.Proceedings of the International Confer-ence on Computer Vision. Los Alamitos, California. June 20 –23, 1995:16 –23 17. Østergaard L, Weisskoff RM, Chesler DA, et al.High resolution measurement
of cerebral blood flow using intravascular tracer bolus passages. Part I. Math-ematical approach and statistical analysis.Magn Reson Med1996;36:715–25 18. Østergaard L, Sorensen AG, Kwong KK, et al.High resolution measurement of
cerebral blood flow using intravascular tracer bolus passages. Part II. Exper-imental comparison and preliminary results. Magn Reson Med
1996;36:726 –36
19. Fieselmann A, Ganguly A, Deuerling-Zheng Y, et al.Automatic measurement of contrast bolus distribution in carotid arteries using a C-arm angiography system to support interventional perfusion imaging. In:Proceedings of the 2011 Society of Photographic Instrumentation Engineers Medical Imaging Conference. Lake Buena Vista, Florida. February 12–17, 2011
20. McCulloch TJ, Turner MJ.The effects of hypocapnia and the cerebral autoreg-ulatory response on cerebrovascular resistance and apparent zero flow pres-sure during isoflurane anesthesia.Anesth Analg2009;108:1284 –90 21. Badea CT, Johnston SM, Subashi E, et al.Lung perfusion imaging in small
animals using 4D micro-CT at heartbeat temporal resolution.Med Phys
2010;37:54 – 62
22. Chalela JA, Alsop DC, Gonzalez-Atavales JB, et al.Magnetic resonance perfu-sion imaging in acute ischemic stroke using continuous arterial spin labeling.