ORIGINAL RESEARCH
Structural Brain Abnormalities in Patients with
Parkinson Disease: A Comparative Voxel-Based
Analysis Using T1-Weighted MR Imaging and
Magnetization Transfer Imaging
K. Morgen G. Sammer L. Weber B. Aslan C. Mu¨ller G.F. Bachmann D. Sandmann M. Oechsner D. Vaitl M. Kaps I. Reuter
BACKGROUND AND PURPOSE:In PD, tissue damage occurs in specific cortical and subcortical regions. Conventional MR images have only limited capacity to depict these structural changes. The purpose of the current study was to investigate whether voxel-based MT imaging could indicate structural abnormalities beyond atrophy measurable with T1-weighted MR imaging.
MATERIALS AND METHODS:Thirty-six patients with PD without dementia (9 in H&Y stage 1, thirteen in H&Y 2, eleven in H&Y 3, three in H&Y 4) and 23 age-matched control subjects were studied with T1-weighted MR imaging and MT imaging. Voxel-based analyses of T1-weighted MR imaging was performed to investigate brain atrophy, while MT imaging was used to study abnormalities within existing tissue. Modulated GM and WM probability maps, sensitive to volume, and nonmodulated maps, indicative of tissue density, were obtained from T1-weighted MR imaging. Effects seen on MTR images, but absent on density maps, were attributed to damage of existing tissue.
RESULTS: Contrary to T1-weighted MR imaging, MT imaging was sensitive to the progression of brain pathology of the neocortex and paraventricular WM. MTR images and T1-based volume images, but not density images, showed a progression of disease in the olfactory cortex, indicating the occurrence of atrophy as well as damage to existing tissue in this region. MTR images revealed bilateral damage to the SN, while T1-weighted MR imaging only showed left-sided abnormalities.
CONCLUSIONS:The findings suggest that voxel-based MT imaging permits a whole-brain unbiased investigation of CNS structural integrity in PD and may be a valuable tool for identifying structural damage occurring without or before measurable atrophy.
ABBREVIATIONS:FWHM⫽ full width at half maximum; FWE⫽ family-wise error; GM⫽gray matter; H&Y⫽Hoehn and Yahr; ILF⫽inferior longitudinal fascicle; MMSE⫽Mini-Mental State Examination; MPRAGE⫽magnetization-prepared rapid acquisition of gradient echo; MT⫽ mag-netization transfer; MTR⫽magnetization transfer ratio; PD⫽Parkinson disease; SN⫽substantia nigra; SNc⫽substantia nigra, pars compacta; STG⫽superior temporal gyrus; UPDRS⫽United Parkinson Disease Rating Scale; VBM⫽voxel-based morphometry
P
D is characterized by the degeneration of multiple neuro-nal systems, involving the accumulation of intraneuroneuro-nal inclusions, Lewy bodies, and Lewy neurites in specific cortical and subcortical regions. Generally, the earliest stages of this process precede the diagnosis of PD. Motor symptoms of PD are likely to appear when the pathology of the disease has caused significant damage to the SN. As structural abnormal-ities spread from the olfactory cortex, lower brain stem, mid-brain, and limbic structures in the temporal and subgenual mesocortex to neocortical sensory association areas and pre-frontal cortex, motor and cognitive deficits become more se-vere.1,2Cortical amyloid deposition, though modest incom-parison with that in Alzheimer disease, also tends to occur in PD and is likely to contribute to cognitive impairment.3,4
Conventional MR imaging has not proved to be sufficiently sensitive to PD-related progressive cerebral tissue damage. Re-cently, voxelwise analyses of T1-weighted MR imaging have indicated widespread cortical and subcortical atrophy in pa-tients with PD and dementia,5-7in line with the distribution of
microstructural damage in advanced stages of disease.1,2In
some studies of patients without dementia, brain atrophy has also been found, predominantly in the neocortical regions, but its extent and topography have been quite heterogeneous.5-11
A limitation of volumetric measurements is that they are sen-sitive only to severe tissue damage, as opposed to subtle reduc-tions of tissue integrity that may occur without volume loss.
One method previously applied to detect potential slight changes in neuronal integrity is diffusion-weighted MR imag-ing; voxel-based diffusion-weighted imaging has revealed in-creased diffusivity in the olfactory tracts of patients with mild-to-moderate PD (H&Y stage 2.1⫾0.7)12and in the frontal cortex as well as the cingulum of patients with PD without dementia.13
In the current study, we investigated cerebral tissue changes in a group of patients with PD without dementia with
Received December 21, 2010; accepted after revision March 11, 2011.
From the Central Institute of Mental Health (K.M.), Mannheim, Germany; Department of Neurology (K.M., L.W., B.A., I.R., M.K.), University of Giessen, Giessen, Germany; Bender Institute of Neuroimaging (K.M., G.S., D.V.), Giessen, Germany; Cognitive Neuroscience Lab at the Center for Psychiatry (G.S., B.A.), Giessen, Germany; Department of Radiology (C.M., G.F.B.), Kerckhoff-Klinik, Bad Nauheim, Germany; Soemmerring-Institut (D.S., I.R.), Bad Nauheim, Germany; and Parkinson-Klinik (M.O.), Bad Nauheim, Germany.
Please address correspondence to Katrin Morgen, MD, Central Institute of Mental Health, Department of Psychiatry and Psychotherapy, J5, 68159 Mannheim, Germany; e-mail: [email protected]
voxel-based analyses of MTR images and T1-weighted MR imaging. MT imaging relies on the continuous interchange of magnetization between free protons and protons bound to macromolecules and thus permits an indirect measurement of tissue integrity.14It has been used to provide quantitative
mea-sures of CNS damage in multiple sclerosis and other dis-eases.15,16In PD, changes in the CNS tissue structure have
been detected with MT imaging in selected regions, specifi-cally in the basal ganglia,17paraventricular WM, and brain
stem.18Our hypothesis was that MT imaging would be more
sensitive to the progression of PD than T1-weighted MR im-aging. We postulated that MT imaging would reveal injury to existing tissue in areas already affected by atrophy and would indicate subtle damage in additional locations.
Materials and Methods
Subjects
Forty-six patients between the ages of 42 and 76 (mean age, 61.0⫾7.1 years; 27 men and 19 women; 10.9⫾3.0 years of education) and 25 age- and education-matched healthy volunteers (mean age, 59.6⫾ 5.9 years; 10 men and 15 women; 11.9⫾3.3 years of education) participated in the study. Ten patients and 2 control subjects were excluded because of motion artifacts (8 patients and 2 control sub-jects) and susceptibility artifacts (2 patients). Characteristics of the remaining 36 patients (21 men and 15 women) and 23 control sub-jects (9 men and 14 women) are listed in On-line Table 1. Clinical evaluation of patients included complete neurologic examination and determination of the H&Y stage19and score on the UPDRS.20Nine
patients were in H&Y stages 1 and 1.5; thirteen, in stages 2 and 2.5; eleven, in stage 3; and 3 patients, in stage 4. Patients were categorized according to H&Y stage, so the nonlinear progression of PD brain pathology21could be analyzed in subgroup comparisons. After
com-paring the patient and control group overall, we performed compar-isons of the control group with patients in H&Y subgroups and of patients in early H&Y stages with patients in more advanced stages. We also used the more finely graded UPDRS to study associations between clinical status and cerebral tissue damage in the whole group (On-line Table 1). Patients met the UK brain bank criteria for idio-pathic PD.22Further inclusion criteria were the ability to tolerate a
session of MR imaging and the absence of dementia. Careful attention was paid to comfortable positioning of subjects in the scanner to minimize movement. Dementia was assessed by using theDiagnostic and Statistical Manual of Mental Disorders,Fourth Edition and the MMSE; the MMSE cutoff value was set atⱕ24/30 points.23All
pa-tients were on dopaminergic medication; 12 papa-tients showed motor fluctuations and were assessed during their “on” state.
The study was approved by the clinical institutional review board of Giessen University. All subjects gave informed consent.
Structural Image Analysis
MR imaging examinations were performed on a 1.5T whole-body unit (Magnetom Sonata; Siemens, Erlangen, Germany). They con-sisted of 3D high-resolution T1-weighted images (MPRAGE: TE, 3.49 ms; TR, 1900 ms; flip angle, 15°; 1.0⫻160 sections; matrix, 256⫻ 208; FOV, 210⫻170 mm [voxel size, 0.82⫻0.82⫻1 mm]). MT images were also 3D-acquired, consisting of axial oblique proton den-sity⫺weighted gradient-echo images with and without a saturation pulse (TR, 29 ms; TE, 6 ms; flip angle, 12°; 1.2⫻120 sections; matrix, 256⫻208; FOV, 320⫻260 mm [voxel size, 1.25⫻1.25⫻1.2 mm];
shaped pulse: 7.68 ms applied 1.5 KHz off-resonance). The total scan-ning time was 18 minutes.
Voxel-Based Morphometry with T1-Weighted MR Imaging. High-resolution T1-weighted images were processed according to the method for VBM described by Good et al24 with SPM2 software
(Wellcome Department of Imaging Neuroscience, London, UK; http//www.fil.ion.ucl.ac.uk/spm) and Matlab 6.5 software (Math-Works, Natick, Massachusetts). Briefly, this method involved an ini-tial segmentation of T1-weighted MR images into GM and WM im-ages in native space, followed by a normalization of the GM and WM images to templates in stereotactic space to obtain optimized normal-ization parameters. During normalnormal-ization, images were interpolated to isotropic 1⫻1⫻1 mm voxels. The normalization parameters were then re-applied to the original whole-brain structural images before a second segmentation.
We analyzed both the original nonmodulated probability maps (ie, GM and WM density images) and modulated maps (ie, GM and WM volume images). We included density maps in the analysis be-cause they could be more easily compared with (nonmodulated) MTR images. Nonmodulated probability maps based on T1-weighted images can be thought of as indicative of the proportion of GM or WM to all tissue types within a region. Modulated probability maps were also analyzed because they are intensity-corrected for volume changes resulting from normalization and thus are more sensitive to the distribution of GM and WM volume. Density maps and MTR images were smoothed with a 12-mm FWHM kernel; modulated im-ages were smoothed with a smaller FWHM kernel (8 mm) because of smoothing involved in the modulation step. For the analysis of the midbrain, we used a smoothing kernel of 6 mm for density maps and MTR images and of 4 mm for the modulated probability maps be-cause of the small size of the SN.25
MTR Analysis.By selectively saturating the macromolecular pro-ton pool, MT imaging permits quantification of the magnetization exchange between protons in macromolecules and unbound water. The MT effect can be measured as the ratio of voxel intensities, known as the MTR. The MTR was calculated voxel by voxel by using SPM2 and Matlab 6.5 software. The MT images with and without the satu-ration pulse were first coregistered with each other, then with the corresponding MPRAGE image. An MTR image was calculated ac-cording to the following equation:
MTR⫽共关M0⫺Ms]/M0),
whereM0andMSare voxel intensities of the MT images with and without the saturation pulse.
The transformation parameters derived from the normalization of the MPRAGE images were subsequently applied to the MTR im-ages. To analyze GM and WM damage separately, we applied masks derived from the GM and WM density probability maps to the MTR image. The threshold for the masks was chosen to ensure that voxels included had a⬎50% likelihood of belonging to GM or WM. We found that this threshold was conservative and yet successfully ex-cluded other tissue classes. Effects observed in the MTR image analy-sis, but not on density maps, were considered to indicate injury of existing brain tissue. We also compared the results of the MTR anal-ysis with the effects seen in the analanal-ysis of modulated GM and WM maps, which are sensitive to local volume differences, to see whether atrophy and damage to existing tissue occurred in the same areas.
Statistical Analysis of Regional Tissue Abnormalities.We used SPM2 to investigate group differences (with 1-way ANOVA) and per-form multiple regression analyses (with age, sex, and total cranial
BRAIN
ORIGINAL
volume as confounding variables) on a voxel-by-voxel basis. For group comparisons, multiple regression analyses were performed with group as an independent variable. Effects were reported as sig-nificant when whole-brain cluster-level FWE-correctedPwas⬍.05. Additional ROI analyses were performed for the olfactory cortex and SN, because these structures are known to be affected at the earliest stages of PD-related pathology (voxel-level ROI FWE-correctedP⬍ .05).1,2The “olfactory cortex” was defined as the anterior olfactory
cortex in the basal forebrain and the more dorsally located subcallosal region known as “Broca’s olfactory cortex” (http://www.fil.ion.ucl. ac.uk/spm/ext/).26,27Because the pars compacta is the focus of PD
pathology within the SN, we chose the SNc coordinates according to a previous MR imaging investigation of midbrain structures28and
cre-ated a 5-mm spheric ROI around these voxels (x⫽ ⫺4, y⫽ ⫺12, z⫽ ⫺10; x⫽4, y⫽ ⫺12, z⫽ ⫺10). The size of the SN ROI was chosen according to the estimated SN volume. The width of the minor axis of the crescent-shaped SN has been shown to be approximately 5 mm on axial MR imaging in healthy individuals.25
Results
Comparison of Patient and Control Groups Regarding Tissue Density, Volume, and MTR
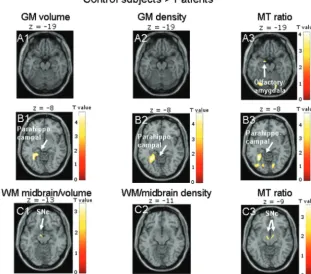
Patients showed reduced tissue integrity on MTR images in the left olfactory cortex bordering on the amygdala (GM analysis) and in the bilateral SN (WM analysis). Of note, the midbrain was classified as WM in all subjects during statis-tical parametric mapping segmentation. WM volume maps exhibited damage only in the left SN; WM density showed no significant effects. This finding provides evidence for distinguishable atrophy and damage to existing
tissue in the left SN. All types of GM images (density, vol-ume, and MTR) showed tissue damage in the left parahippocampal gyrus in the patient group (On-line Table 2 and Fig 1).
Comparison of Patient Subgroups According to H&Y Stage and Control Group
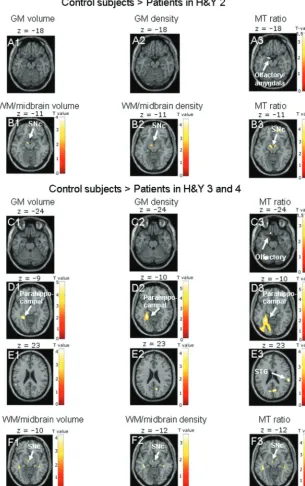
There were no significant differences in regional tissue density, volume, or MTR between control subjects and patients in H&Y stage 1. Patients in H&Y 2 showed reduced tissue integ-rity on GM MTR images in the left olfactory cortex bordering the amygdala, but not in GM density or volume maps (On-line Table 2 and Fig 2). The WM analysis indicated effects in bilat-eral SN on MTR images, but only in the left SN in density and volume maps (On-line Table 3 and Fig 2). When patients in H&Y stages 3 and 4 were compared with control subjects, pa-tients showed reduced GM integrity in the left olfactory cortex and in the right STG only on MTR images; all types of GM images revealed effects in the left parahippocampal gyrus (On-line Table 2 and Fig 2). WM analysis indicated tissue damage in the left SN in all image types (On-line Table 3 and Fig 2).
Comparison of H&Y Patient Subgroups Regarding Tissue Density, Volume, and MTR Distribution
[image:3.594.55.367.57.331.2]that showed an effect in the overall group comparison (On-line Table 2 and Fig 3).
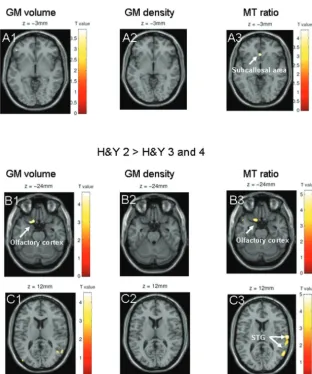
When patients in H&Y stage 2 were compared with pa-tients in H&Y stages 3 and 4, the GM density maps did not reveal differences; both the GM volume maps and the GM MTR images showed progression of tissue damage in the ol-factory cortex, indicating distinguishable atrophy and injury to existing tissue in the same region. In addition, only the MTR images revealed reduced tissue integrity in the right STG (On-line Table 2 and Fig 3). There were no group differences in WM integrity.
Correlations of UPDRS Score with Regional Distribution of Tissue Density, Volume, and MTR
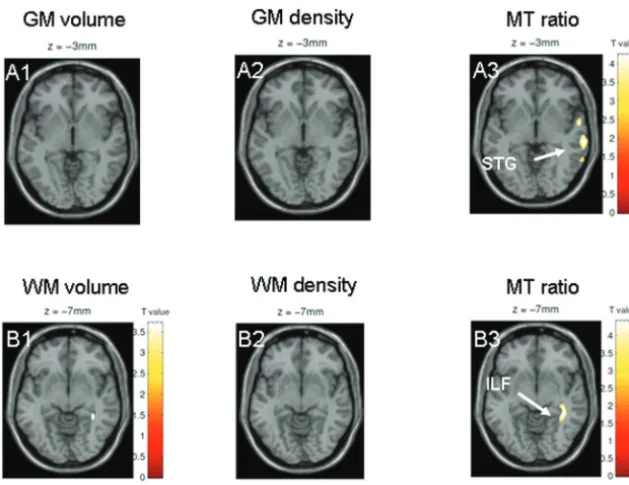
UPDRS scores in the patient group did not correlate with GM or WM density or volume. They did, however, correlate with
abnormalities on GM MTR images in the right STG. Further-more, UPDRS scores correlated with WM MTR in the right IFL (On-line Table 4 and Fig 4).
Discussion
The main finding of this study was that the voxel-based anal-ysis of MTR images permitted the detection of tissue damage in patients with PD not attributable to volume loss.
[image:4.594.58.364.51.538.2]sue damage was found in the midbrain and olfactory cortex in patients at H&Y stage 2 and in additional regions in the para-hippocampal gyrus, temporal neocortex, and paraventricular WM in a greater number of patients with more advanced PD, in line with the known progression of disease.
The fact that MTR images indicated structural changes in existing brain tissue of patients with PD presumably reflects the sensitivity of the MTR to decreases in axonal and dendritic density as well as to secondary myelin degeneration.15
Neuro-nal loss occurs in PD following the accumulation of Lewy bod-ies in cell somata and Lewy neurites in cellular processes, in-clusion bodies that contain misfolded and aggregated ␣-synuclein but, to some extent, may also be associated with amyloid deposition.1,2
Structural Abnormalities at Early Stages of PD (H&Y 1 and 2)
In the current group of patients with PD, changes in GM or WM structure did not become apparent in H&Y 1, presum-ably because these changes were not yet pronounced; the small group size may also have contributed to the absence of effects. In H&Y stage 2, patients showed tissue abnormalities, which were apparent in more regions on MTR images than on T1-weighted MR imaging. Only MT imaging indicated an
in-volvement of the olfactory cortex, specifically the subcallosal area and anterior olfactory cortex, known to be affected by PD-related pathology at early stages of the disease.2,26
More-over, MTR images were sensitive to bilateral SN damage, whereas T1-based probability maps indicated effects only in the left SN. Because of the small size of the SN and difficulties in segmenting midbrain regions, detection of SN damage has been difficult on MR imaging; recently a combination of a specific T1-weighted MR imaging and diffusion tensor imag-ing was presented as a means of identifyimag-ing PD-related abnor-malities in SN.29The current study provides evidence that
voxel-based MR imaging can detect damage in limbic and neocortical structures as well as in a midbrain region as small as the SN; MTR images proved to be more sensitive to abnor-malities in the right SN and olfactory cortex than T1-based probability maps at early stages of disease.
Structural Abnormalities at More Advanced Stages of PD (H&Y 3 and 4)
Only MTR images revealed additional neocortical tissue dam-age (in the right STG) in patients with more advanced PD, both in a H&Y subgroup comparison (stages 3 and 4 versus stage 2) and in an analysis of correlations with UPDRS. The right STG, in turn, is known to be an early site of neocortical Fig 3.Results are presented atP⬍.001 whole-brain uncor-rected; significant effects are marked with arrows and labeled.
[image:5.594.57.370.65.440.2]involvement.2,8Furthermore, MTR images of WM showed reduced tissue integrity in the right ILF, whereas T1-based probability maps did not reveal significant WM damage. This result is in line with a previous (nonvoxel-based) MTR analy-sis of selected GM and WM regions in patients with PD, which indicated paraventricular changes in tissue structure, and with the pronounced sensitivity of MTR images to macromolecular damage in WM.15,18
Between H&Y 2 and 3/4, progressive tissue abnormalities were observed in the left anterior olfactory cortex in both modulated GM maps and MTR images, reflecting distinguish-able atrophy and injury to existing tissue in the same region. No effects occurred on GM density maps; thus, the MTR find-ing in the olfactory cortex is not attributable to atrophy or registration error. The comparison of patients in H&Y stages 3 and 4 with control subjects confirmed the sensitivity of MTR images to abnormalities within existing tissue in the olfactory cortex; T1-based VBM was not sensitive to atrophy in this region.
While bilateral SN damage was apparent in patients with H&Y stage 2 versus control subjects as well as in the overall group comparison, patients in H&Y stages 3 and 4 showed only MR imaging abnormalities in the left SN compared with control subjects and no SN effects in comparison with less advanced (H&Y stage 2) patients. The absence of an apparent change in SN tissue integrity between patients with early and more advanced PD could reflect structural SN heterogeneity in the H&Y 3 and 4 subgroups and may also indicate a non-linear progression of abnormalities on MR imaging, in line with previous position-emission tomography results.21 In
contrast, the left parahippocampal gyrus showed tissue injury in the overall group comparison and between H&Y 3 and 4 and control subjects, not however in patients with H&Y stage 2 compared with the control group. This finding is in accord with the temporal pattern of pathology, which generally
in-volves the parahippocampal gyrus later than the olfactory cor-tex and SN.1
The UPDRS correlated with tissue changes only on MTR images; effects were apparent in the neocortex (STG) and ad-jacent WM. One reason for the absence of significant correla-tions with tissue integrity in the olfactory cortex and SN may be “floor effects,” which limit the sensitivity of the scale in the mild stage of disease.30Moreover, the UPDRS constitutes a
more universal scale than the classification according to H&Y stage, which is based on motor symptoms, and thus perhaps showed a closer association with SN damage in the current group of patients with PD.
Conclusions
The voxel-based analysis of MTR images has the capacity to reveal structural changes in existing brain tissue of patients with PD. Voxel-based MTR analysis constitutes a potentially effective method to track early PD-related pathology. In the current study, it confirmed involvement of the SN, olfactory and temporal cortices, and paraventricular WM, known to be foci of PD-associated tissue changes from histopathologic ev-idence. Whether MTR measures of cerebral tissue damage can be used as predictors of clinical progression remains to be investigated.
Disclosures: Katrin Morgen—Research Support (including provision of equipment or ma-terials): Jacksta¨dt Trust,Details: provision of resources for MR imaging scanning and neuropsychological testing. Lena Weber—Research Support (including provision of equip-ment or materials): Jacksta¨dt Trust, Details: provision of resources for MR imaging scanning and neuropsychological testing. Matthias Oechsner—Speaker Bureau: Desitin, Boehringer Ingelheim, Teva,Details: Speaker honoraria⬍$10 000,Consultant: Boehringer Ingelheim,Details: Consultant honoraria⬍$10 000. Iris Reuter—Research Support (in-cluding provision of equipment or materials): Jacksta¨dt Trust,Details: The Jackstaedt Trust is a foundation that supports medical research. Decisions about funding are based on a peer-review process.Speaker Bureau: PharmAllergan, Ipsen and Merz,Details: I received speaker fees for talks on botulinum toxin, which is not related to the current study. An individual contract was signed, and the University gave the permission.
[image:6.594.54.369.66.309.2]References
1. Braak H, Del Tredici K, Rub U, et al.Staging of brain pathology related to sporadic Parkinson’s disease.Neurobiol Aging2003;24:197–211
2. Braak H, Rub U, Jansen Steur EN, et al.Cognitive status correlates with neu-ropathologic stage in Parkinson disease.Neurology2005;64:1404 –10 3. Mattila PM, Roytta M, Torikka H, et al.Cortical Lewy bodies and
Alzheimer-type changes in patients with Parkinson’s disease.Acta Neuropathol1998; 95:576 – 82
4. Gomperts SN, Rentz DM, Moran E, et al.Imaging amyloid deposition in Lewy body diseases.Neurology2008;71:903–10
5. Burton EJ, McKeith IG, Burn DJ, et al.Cerebral atrophy in Parkinson’s disease with and without dementia: a comparison with Alzheimer’s disease, dementia with Lewy bodies and controls.Brain2004;127(pt 4):791– 800
6. Nagano-Saito A, Washimi Y, Arahata Y, et al.Cerebral atrophy and its relation to cognitive impairment in Parkinson disease.Neurology2005;64:224 –29 7. Summerfield C, Junque C, Tolosa E, et al.Structural brain changes in
Parkin-son disease with dementia: a voxel-based morphometry study.Arch Neurol
2005;62:281– 85
8. Beyer MK, Janvin CC, Larsen JP, et al.A magnetic resonance imaging study of patients with Parkinson’s disease with mild cognitive impairment and de-mentia using voxel-based morphometry.J Neurol Neurosurg Psychiatry2007; 78:254 –59
9. Bouchard TP, Malykhin N, Martin WR, et al.Age and dementia-associated atrophy predominates in the hippocampal head and amygdala in Parkinson’s disease.Neurobiol Aging2008;29:1027–39
10. Jokinen P, Bruck A, Aalto S, et al.Impaired cognitive performance in Parkin-son’s disease is related to caudate dopaminergic hypofunction and hippocam-pal atrophy.Parkinsonism Relat Disord2009;15:88 –93
11. Dalaker TO, Larsen JP, Bergsland N, et al.Brain atrophy and white matter hyperintensities in early Parkinson’s disease (a).Mov Disord2009;24:2233– 41 12. Scherfler C, Schocke MF, Seppi K, et al.Voxel-wise analysis of diffusion weighted imaging reveals disruption of the olfactory tract in Parkinson’s dis-ease.Brain2006;129(pt 2):538 – 42
13. Karagulle Kendi AT, Lehericy S, Luciana M, et al.Altered diffusion in the fron-tal lobe in Parkinson disease.AJNR Am J Neuroradiol2008;29:501– 05. Epub 2008 Jan 17
14. Ramio-Torrenta L, Sastre-Garriga J, Ingle GT, et al.Abnormalities in normal appearing tissues in early primary progressive multiple sclerosis and their relation to disability: a tissue specific magnetisation transfer study.J Neurol Neurosurg Psychiatry2006;77:40 – 45
15. Gass A, Barker GJ, Kidd D, et al.Correlation of magnetization transfer ratio with clinical disability in multiple sclerosis.Ann Neurol1994;36:62– 67 16. Filippi M, Rocca MA.Magnetization transfer magnetic resonance imaging in
the assessment of neurological diseases.J Neuroimaging2004;14:303–13 17. Eckert T, Sailer M, Kaufmann J, et al.Differentiation of idiopathic Parkinson’s
disease, multiple system atrophy, progressive supranuclear palsy, and healthy controls using magnetization transfer imaging.Neuroimage2004;21:229 –35 18. Tambasco N, Pelliccioli GP, Chiarini P, et al.Magnetization transfer changes of
grey and white matter in Parkinson’s disease.Neuroradiology2003;45:224 –30 19. Hoehn MM, Yahr MD.Parkinsonism: onset, progression and mortality.
Neu-rology1967;17:427– 42
20. Fahn SR, Elton, RL, Marsden CD, et al.Unified Parkinson’s Disease Rating Scale: Recent Developments in Parkinson’s Disease. London, UK: Macmillan; 1987 21. Hilker R, Schweitzer K, Coburger S, et al.Nonlinear progression of Parkinson
disease as determined by serial positron emission tomographic imaging of striatal fluorodopa F 18 activity.Arch Neurol2005;62:378 – 82
22. Gibb WR, Lees AJ.The relevance of the Lewy body to the pathogenesis of idiopathic Parkinson’s disease.J Neurol Neurosurg Psychiatry1988;51:745–52 23. Folstein MF, Folstein SE, McHugh PR.“Mini-mental state”: a practical method for grading the cognitive state of patients for the clinician.J Psychiatr Res
1975;12:189 –98
24. Good CD, Johnsrude IS, Ashburner J, et al.A voxel-based morphometric study of ageing in 465 normal adult human brains.Neuroimage2001;14(1 pt 1):21–36
25. Adachi M, Hosoya T, Haku T, et al.Evaluation of the substantia nigra in pa-tients with Parkinsonian syndrome accomplished using multishot diffusion-weighted MR imaging.AJNR Am J Neuroradiol1999;20:1500 – 06
26. Dejerine, ed.Anatomie des Centres Nerveux. Paris, France: Masson; 1980 27. Walter B, Blecker C, Kirsch P, et al.MARINA: an easy to use tool for the
cre-ation of MAsks for Region of INterest Analyses. In:Proceedings of the 9th Inter-national Conference on Functional Mapping of the Human Brain, June 19 –22, 2003; New York
28. Jahanshahi M, Jones CR, Dirnberger G, et al.The substantia nigra pars com-pacta and temporal processing.J Neurosci2006;26:12266 –73
29. Menke RA, Scholz J, Miller KL, et al.MRI characteristics of the substantia nigra in Parkinson’s disease: a combined quantitative T1 and DTI study. Neuroim-age2009;47:435– 41