http://www.scirp.org/journal/msa ISSN Online: 2153-1188 ISSN Print: 2153-117X
DOI: 10.4236/msa.2018.91011 Jan. 24, 2018 155 Materials Sciences and Applications
Ageing Behavior of LiNi
0.80
Co
0.15
Al
0.05
O
2
Cathode Based Lithium Ion Cells—Influence
of Phase Transition Processes
Christopher Betzin
1,2, Holger Wolfschmidt
11Siemens AG, Erlangen, Germany
2Friedrich-Alexander-University, Erlangen, Germany
Abstract
In this paper, commercial lithium ion battery cells consisting of graphite based anode and LiNi0.80Co0.15Al0.05O2 (NCA) oxide based cathode were inves-tigated regarding their aging behavior. The capacity loss is dependent on the state of charge (SOC) whereas the battery is operated with partial cycles at de-fined SOCs. The structural change of the positive electrode material is identi-fied as dominating aging process. Especially grid services such as primary control reserve are of economic interest for battery system operators. In this application, small charge and discharge cycles are the main operation mode. Considering the operation of single battery storage systems in a virtual storage power plant, different states of charges are much more of interest. Thus the battery aging behavior of lithium ion cells with NCA based cathode material with respect to cycling at specific state of charge with small depth of discharge (DOD) is investigated. The results in this paper provide understanding of small DOD cycling at given SOC behavior which is necessary for NCA life-time prediction in this particular case, especially in virtual storage plant with various storage systems and thus various SOCs for delivery primary reserve the small DOD behavior which has an important impact on efficiency and economy. It is a key finding, which aging mechanisms are essential in order to optimize the cell operation and adapt it to system performance.
Keywords
Cyclic Voltammetry, NCA, Fatigue of LiNCAO, Primary Control Reserve
1. Introduction
Lithium ion batteries play a prominent role for energy storage and are an
increa-How to cite this paper: Betzin, C. and Wolfschmidt, H. (2018) Ageing Behavior of LiNi0.80 Co0.15Al0.05O2 Cathode Based Li-thium Ion Cells—Influence of Phase Transi-tion Processes. Materials Sciences and Appli- cations, 9, 155-173.
https://doi.org/10.4236/msa.2018.91011
Received: October 24, 2017 Accepted: January 21, 2018 Published: January 24, 2018
Copyright © 2018 by authors and Scientific Research Publishing Inc. This work is licensed under the Creative Commons Attribution International License (CC BY 4.0).
http://creativecommons.org/licenses/by/4.0/
DOI: 10.4236/msa.2018.91011 156 Materials Sciences and Applications
singly important part of storage technologies in different sectors [1]-[6]. Based
on the reasonable power and energy density of lithium ion batteries, they occupy a huge market share on consumer market like portable electronic devices (e.g. notebooks and tablets) [7]. In the transportation sector, lithium ion storage is at the moment almost indispensable. For full electric vehicles, lithium ion batteries
are more important than ever before [8]. Also in hybrid vehicles, lithium ion
batteries are used [9]. In combination with grid support, battery vehicles could
even supply primary control reserve [10].
But the key role for grid support in an energy market with high share of re-newable energy behooves the stationary lithium ion battery energy storage
ex-cluded pumped hydro storage [11]. In the case of primary control reserve,
li-thium ion battery systems are the most promising technology, because of their
efficiency and cost structure [12]. One promising use case of lithium ion battery
storage systems could be the combination of residential battery systems, to store renewable energy, and the supply of primary control reserve in a virtual storage
power plant [13]. For primary control reserve, there are no more full cycles for
relevance, but partial cycling will gain in importance. In this case, it is insuffi-cient to know what the impact of decreasing depth of discharge (DOD) is, but even more it is necessary to know in which state of charge region the system be-havior could be improved considering aging characteristics of lithium ion cells.
The high efficiency of lithium ion cells compared to other storage technolo-gies like redox flow techniques or lead acid is an advantage. But, it is also cell degradation via aging observed, which is the main disadvantage of lithium ion
batteries. An overview of aging mechanisms in literature could be found in [14].
The main aging mechanisms could be divided into two parts, the aging behavior
on cycling and the calendric aging effects [15], both effects occur on anode
elec-trodes as well as on cathode elecelec-trodes. The most important anode material is graphite. The aging of graphite is dominated by growth of the solid electrolyte interface (SEI) [16] which leads to an increase of internal resistance. It changes the electrode/electrolyte interface via building a solid inorganic electrolyte inter-face. The main mechanism is the decomposition of organic electrolyte. SEI growth with direct increasing of internal resistance is the main factor of calen-dric aging. In addition different mechanisms on the cathode side are known for calendric aging. In literature, different materials with different aging behaviors are known, especially deactivation of active material, dissolution of particles and side-reactions of active material [17] [18] [19].
As mentioned before, all active materials suffer under degradation by cycling
[20] [21] [22] via mechanical stress and specific chemical depending
mechan-isms. Based on volumetric change of active material and dissolution and growth
of SEI micro, cracks could be observed which are leading to lithium plating [23].
Common used cathode electrode materials are the olivine structured LiFePO4,
manganese spinel electrode LiMn2O4 (LMO) and layered electrodes like
Li1+x(Ni1/3Co1/3Mn1/3)1−xO2 (NMC). One capacity loss factor of LFP based cathode
sur-DOI: 10.4236/msa.2018.91011 157 Materials Sciences and Applications
face while cycling [24]. In addition, at the LFP cathode, cracks could be observed by anisotropic effects during coexistence of a Li-rich and a Li-poor phase while cycling [25]. Positive electrodes with LiMn2O4 (LMO) spinel underlay a degrada-tion caused by local structure effects. The mechanism is the conversion of cubic
LiMn2O4 to a new tetragonal spinel phase with following disintegration in the
orthorhombic LiMn2O4 phase [26]. The layered NMC is very stable by cycling,
but structural rearrangements of NMC and change of stochiometry of transition metals leads to capacity loss caused due to higher electrolyte reactivity, which promotes side reactions [27].
In this study the focus is on the cathode material NCA, which is also a layered oxide material and known for long term stability and high energy density. The calendric aging progress is minted on the main effect of a graphite/NCA cell via
the growth of SEI and is described in [28]. But changing from calendaric aging
to the degradation on cycling aging a strong influence of the cathode is found in
[29]. In another investigation on NCA based lithium ion batteries increased
current rates with high DOD lead to a rapid degradation of the active material
caused by micro cracks on the surface [30]. Especially this finding will be
con-ducted in the following discussion for the findings obtained here. In addition an inactive state of Ni3+ and Ni2+ is observed in [31] with oxygen loss of the active material. This leads to disabled lithium for intercalation and deintercalation, re-sulting in changes of the cell behavior at exactly given potentials. As an impor-tant effect in NCA materials a phase transition is known with a crystal structure
change between monoclinic to hexagonal [32]. This transition is at a fixed
po-tential which can directly correlated with the finding obtained in the results part and discussed later on.
2. Measurements
In this section the measurement procedures are presented. The investigated cells are commercial 45 Ah lithium ion battery round cells with a graphite based anode and a LiNi0.80Co0.15Al0.05O2 (NCA) based cathode material with organic
electrolyte and hexafluorophosphate lithium salt LiPF6. The procedure is started
with a galvanostatic measurement for cycling with small depth of discharges at specific state of charge (SOC) and subsequent periodic capacity determination to
investigate capacity progress. After every 1000th partial cycle an electrochemical
impedance spectroscopy for the investigation of impedance development, in or-der to interpret ohmic, charge transfer and diffusion behavior is carried out. The third part of measurement procedure is the cyclic voltammetry (CV). Based on CV the mechanism of different degradation behavior is discussed. The potentio dynamic measurement allows conclusions about electrochemical behavior con-cerning the kinetics and physical processes on the electrodes [33].
2.1. Cycling Tests
DOI: 10.4236/msa.2018.91011 158 Materials Sciences and Applications
SOC is adjusted via Ah counter with an accuracy of ±0.2%. In this study two av-erage states of charge are considered. The first state of charge is at 30% SOC with an initial open circuit voltage of 3.53 V and the second cycle test belongs to the state of charge 70% (OCV of 3.75 V). For each cycle test two cells are considered and the current rate is C/3.
After every 1000th partial cycle with a DOD of 10% executed via an Ah-coun-
ter a characterization cycle is carried out. That characterization cycle is done for capacity determination and readjusting the SOC, which was not necessary dur-ing the whole testdur-ing time. In order to determine the capacity loss two discharge capacities are specified. After the common CC-CV charge cycle with CV poten-tial of 4.0 V and the abort criterion of C/20, a discharge with CC of C/3 like charging is done. Subsequently a constant voltage phase at 2.7 V with the same
abort criterion like charging is carried out. Table 1 shows the comparison of the
cycling conditions.
2.2. Electrochemical Impedance Spectroscopy (EIS)
After each 1000th cycle a galvanostatic electrochemical impedance spectroscopy
(EIS) is carried out to interpret the capacity loss behavior. The impedance spec-troscopy is done via multi-channel galvanostat/potentiostat EC-Lab Biologic VMP3 and a current Booster VMP3 B-10. The ambient temperature is con-trolled by the climate chamber Binder KB53. The impedance spectroscopy is used to determine internal resistance and interfacial capacitance of cell. The ba-sic of this measurement is by reference an AC source to determine the imped-ance depending on frequency by varying it. The measurement allows interpret-ing equivalent resistance and interfacial capacitance values by means of
correla-tion to electrode interfacial phenomena [34]. In this study the carried out
[image:4.595.209.539.549.719.2]band-with of frequency is 6 kHz up to 50 mHz band-with 36 points per decade in logarithm spacing. Per each frequency an average of two measurement points is carried out. The galvanostatic impedance mode is carried out with an amplitude of 1 A.
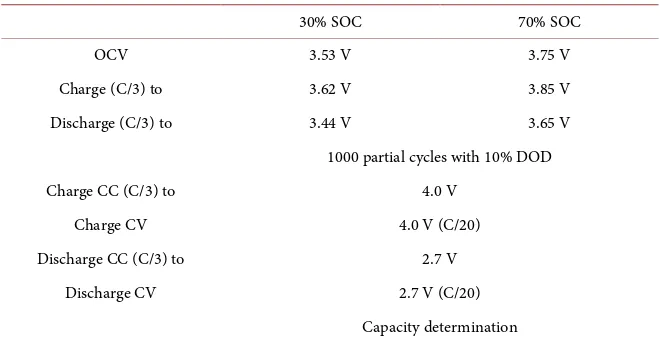
Table 1. Cycling initial condition (voltage limit) at 25˚C ambient temperature with 10% DOD at SOC 30% and 70%.
30% SOC 70% SOC
OCV 3.53 V 3.75 V
Charge (C/3) to 3.62 V 3.85 V
Discharge (C/3) to 3.44 V 3.65 V
1000 partial cycles with 10% DOD
Charge CC (C/3) to 4.0 V
Charge CV 4.0 V (C/20)
Discharge CC (C/3) to 2.7 V
Discharge CV 2.7 V (C/20)
DOI: 10.4236/msa.2018.91011 159 Materials Sciences and Applications
2.3. Cyclic Voltammetry (CV)
The potentio dynamic measurement cyclic voltammetry is realized by multi- channel galvanostat/potentiostat EC-Lab Biologic VMP3 and current Booster VMP3 B-10. The different ambient temperatures between 10˚C and 40˚C are controlled by a climate chamber Binder KB53. The constant potential scan rate
is varied between 0.020 mV∙s−1 and 0.022 mV∙s−1 in order to get physical
depen-dency. This measurement is carried out to evaluate electrochemical process at electrodes surfaces [35].
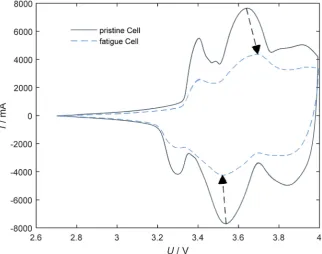
In order to get an impression which impacts the aging process on potentio
dynamic behavior has, in Figure 1 cyclic voltammograms of a pristine and
fati-gue cell are shown. In order to determine changes in electrochemical mechanism processes while aging, cyclic voltammetry is carried out to correlate aging
phe-nomena with electrochemical processes, which are known in literature [36].
3. Results
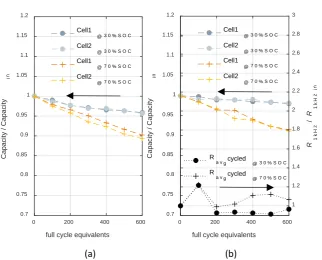
The first results are shown in Figure 2. Two cells were cycled at 70% SOC with a
DOD of 10% and a current of C/3 with an ambient temperature of 25˚C and two
cells were cycled at 30% SOC by the same conditions. In Figure 2(a) the capacity
was determined with common CC-discharge mode. In Figure 2(b) the capacity
[image:5.595.213.536.422.676.2]was determined with CC-CV-discharge mode shown at left y-axes and the aver-aged 1 kHz resistance determined from both cells per each test at 50% SOC is shown at the right y-axes.
DOI: 10.4236/msa.2018.91011 160 Materials Sciences and Applications Figure 2. Capacity fade of cycle tests at 25˚C ambient temperature (a) determined with CC-discharge protocol for each test with two cells, grey dots cycled at 30% SOC and yellow crosses cycled at 70% SOC; (b) Capacity progress determination via CC-CV-discharge protocol with two cells for each test with grey dots cycled at 30% SOC and yellow crosses cycled at 70% SOC with averaged 1 kHz resistance determined from both cells per each test at 50% SOC with same marker as capacity measurement.
The capacity loss shown in those figures allows assigning a state of charge de-pending degradation of NCA cathode based lithium ion cells with graphite based anodes. Discharge only with a constant current phase at the end correlates in general directly with the growth of resistance. In order to validate the reversible amount of capacity loss, caused due to lithium binding the capacity loss by CV discharge is considered. The additional CV procedure allows the interpretation of approximately current independent (I → 0) lithium loss, caused due to lithium binding which doesn’t inevitably directly correlate with growth in internal resis-tance.
Considering the subplot a) after 600 full cycle equivalents a quantitative high-er capacity loss with respect to CC discharge mode by cycling at 70% SOC com-pared to cycling at 30% SOC is observed. Whereas cycling at 30% SOC leads on-ly to a loss of about 2% of the initial capacity after 600th full cycle equivalents, cycling at 70% SOC leads under the same condition to 10% capacity loss. Both redundant cells show for each cycle test the same behavior.
The aging dependent capacity loss of these both cycling tests can be described by a linear or square root full cycle equivalent dependent function and is detailed discussed in [37].
Considering the subplot Figure 2(b) also a difference of capacity losses
be-tween cycling at 70% SOC compared to cycling at 30% SOC is observed, which is seen on the left y-axis. The capacity loss which is observed by CC-CV-mode
ad-full cycle equivalents
0 200 400 600
Capacity / Capacity
in 0.7 0.75 0.8 0.85 0.9 0.95 1 1.05 1.1 1.15 1.2 Cell1
@ 3 0 % S O C
Cell2
@ 3 0 % S O C
Cell1
@ 7 0 % S O C
Cell2
@ 7 0 % S O C
R 1 k H z / R 1 k H z in 1 1.2 1.4 1.6 1.8 2 2.2 2.4 2.6 2.8 3 R
a v gcycled @ 3 0 % S O C
R
a v gcycled @ 7 0 % S O C
full cycle equivalents
0 200 400 600
Capacity / Capacity
in 0.7 0.75 0.8 0.85 0.9 0.95 1 1.05 1.1 1.15 1.2 Cell1
@ 3 0 % S O C
Cell2
@ 3 0 % S O C
Cell1
@ 7 0 % S O C
Cell2
@ 7 0 % S O C
a) b)
DOI: 10.4236/msa.2018.91011 161 Materials Sciences and Applications
mits an interpretation of irreversible loss of lithium capacity. For both cycle test conditions also an irreversible capacity loss of lithium could be observed. In par-ticular for cycling at 70% SOC the irreversible loss is dominating. The difference
between CC-mode in subplot Figure 2(a) and CC-CV mode in subplot Figure
2(b) capacity leads to the conclusion, that cycling at 30% has less impact on
in-ternal resistance growth and on irreversible binding of lithium compared to 70% SOC.
Considering the right y-axis in subplot Figure 2(b) the internal resistance
progress at 1 kHz and 50% SOC is directly correlated with the ohmic resistance [38], is illustrated. The internal resistance is a slightly increasing cycling at 70% SOC leads to higher resistance compared to cycling at 30% SOC, but this result is not sufficient to explain the high rise of capacity loss.
In order to interpret the capacity fade results an EIS is carried out. The Ny-quist plot is illustrated to visualize the complex and real part of impedance [39]. The impedance spectroscopy is executed at 70% SOC and 30% SOC for each cell independent on cycle test.
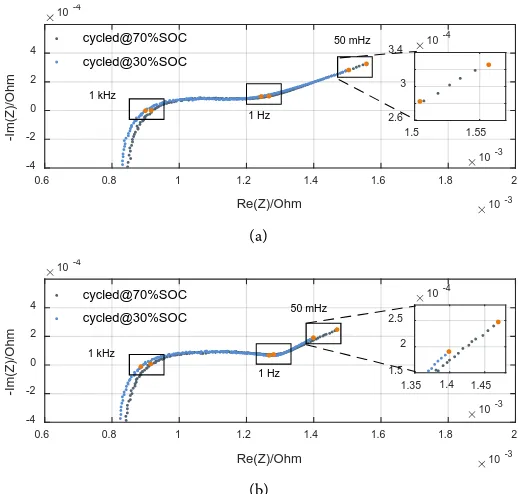
In Figure 3 the results of electrochemical impedance spectroscopy after 6000
partial cycle test at 70% SOC and 30% SOC from 6 kHz up to 50 mHz with
cur-rent amplitude of 1 A and 36 points per decade are shown. In Figure 3(a) the
results of EIS at 70% SOC where the dark grey dots after cycling at 70% SOC and the light blue dots after cycling at 30% SOC are illustrated.
(a)
[image:7.595.243.502.392.639.2](b)
Figure 3. Electrochemical impedance spectroscopy after 6000 partial cycle at 70% SOC and 30% SOC from 6 kHz up to 50 mHz with current amplitude of 1 A and 36 points per decade with logarithm spacing. (a) Two Nyquist plots at 70% SOC with cycled cell at 70% SOC (grey dots) and cycled cell at 30% SOC (light blue dots); (b) Two Nyquist plots at 30% SOC with cycled cell at 70% SOC (grey dots) and cycled cell at 30% SOC (light blue dots).
Re(Z)/Ohm 10-3
0.6 0.8 1 1.2 1.4 1.6 1.8 2
-Im(Z)/Ohm 10-4 -4 -2 0 2 4 cycled@70%SOC cycled@30%SOC 10-3 1.5 1.55 10-4 2.6 3 3.4 1 Hz 1 kHz 50 mHz )
Re(Z)/Ohm 10-3
0.6 0.8 1 1.2 1.4 1.6 1.8 2
-Im(Z)/Ohm 10-4 -4 -2 0 2 4 cycled@70%SOC cycled@30%SOC 10-3 1.35 1.4 1.45
DOI: 10.4236/msa.2018.91011 162 Materials Sciences and Applications
In Figure 3(b) the results of EIS at 30% SOC under otherwise identical
condi-tions as in subplot Figure 3(a) are shown.
Applying electrochemical impedance spectroscopy at lithium ion battery cells, three major frequency subdivisions are relevant. The first section deals with fre-quencies higher than 1 kHz, where inductive phenomena occur, which is not detailed investigated in this study. The intersection with the x-axis which is ap-proximately at 1 kHz in the Nyquist plot is one important point for investiga-tion. At this point no relevant imaginary term of impedance is observed; always the real part of impedance is decisive, which represents the ohmic resistance. The second subdivision in Nyquist plot is the medium frequency range. The frequencies are between 1 kHz and approximately 1 Hz. In this frequency range the electrochemical charge transfer processes with double-layer charging occur. At lower frequency as approximately 1 Hz the diffusion limiting process is ob-served [40].
Comparing the results of EIS at 70% SOC by cycling around 70% SOC a high-er increase of ohmic resistance (inthigh-ersection axis of abscissa) is seen compared to the cell cycled at 30% SOC. Also the ohmic resistance at 30% SOC is by cycling at 70% SOC compared to cycling at 30% SOC higher. Those results match to the observed behavior before. In this case no correlation between SOC and ohmic resistance is determined.
The resistance between intersection axis of abscissa and minimum at lower
frequencies [41] strongly depends on the charge transfer in a battery cell. As in
the Nyquist plot illustrated, no significant change in charge transfer could be observed. Neither differences at cycling at 30% SOC, nor cycling at 70% SOC in EIS at 30% SOC and 70% SOC are shown. Based on these results no charge transfer inhabitation is found.
For lower frequencies the diffusion process is the most important phenomena
[42]. The resistance part could be deduced at the point with highest real and
complex part of impedance in the Nyquist plot [43]. First it could be observed
that the diffusion resistance belongs is higher at 70% SOC. In addition cycling at 70% SOC leads also in EIS at 30% SOC and 70% SOC to higher value in imped-ance. The real term by cycling at 70% SOC of impedance as well as the imagi-nary term of impedance has larger values compared to cycling at 30% SOC.
According to literature at lower frequencies, diffusion limiting processes are the dominant phenomena in lithium ion battery cells. In order to describe those
processes the Warburg impedance is used in general [44] [45].
In Equation (1) the Warburg impedance ZW is shown, where ω the frequency,
RW(ω) the frequency depending real term of impedance, R the ideal gas constant,
T the temperature, i the imaginary unit, F the faraday constant and c0 the con-centration, n the amount of transferred electrons and D the diffusion coefficient is.
( )
W W 2 2 0
2
i 2
RT
Z R
n F c D
ω
ω
ω
DOI: 10.4236/msa.2018.91011 163 Materials Sciences and Applications
Considering the equation of Warburg impedance in connection with the pre-vious results the diffusion coefficient is of interest. The cells cycled at 70% SOC show at impedance spectroscopy at lower frequencies especially at 0.05 Hz both in real part of impedance as well as in the imaginary part higher values com-pared to the cells cycled at 30% SOC. With regard to Warburg impedance, where the frequency at 50 mHz is fixed and the temperature is constant, no changes in parameters are possible except the diffusion coefficient. The higher impedance values are possible if the diffusion coefficient decreases caused due changes in the material. In this case the aging mechanism with respect to impedance results is directly correlated with diffusion limiting processes.
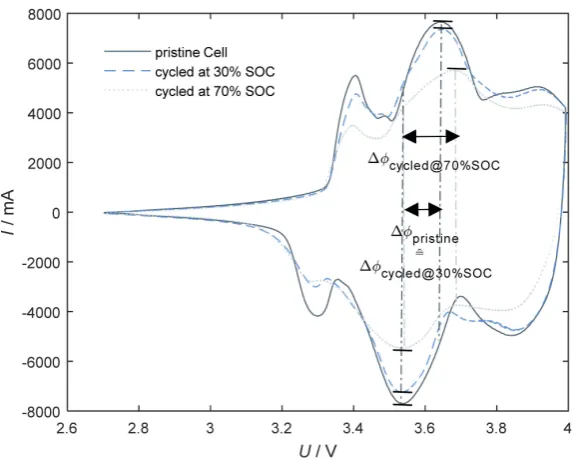
Based on cyclic voltammetry the oxidation and reduction process could be observed. In this study the change of oxidation and reduction processes of NCA
based lithium ion cells with graphite anode are shown. The CV’s in Figure 4
show the differences between a pristine cell and two cycled cells, cycled at 30% SOC and 70% SOC, while charge and discharge processes. The first process be-tween charge and discharge is around 3.3 V and 3.4 V, the peaks belong to the
graphite anode [46]. Considering the pristine cyclic voltammogram the two
[image:9.595.230.520.427.657.2]peaks between 3.53 for lithium intercalation in NCA and 3.63 from deintercala-tion show the primary electrode process. The cycled cell at 70% SOC shows a significant changed CV compared to the cycled cell at 30% after 500 full cycle equivalents. Considering the CV of the pristine cell compared to the cell cycled at 30% SOC no remarkable differences are seen. First of all the current intensity of the main peak pair for reduction and oxidation process between cycled
Figure 4. Cyclic voltammograms at 25˚C ambient temperature with a constant potential scan rate of 0.020 mV∙s−1 of a commercial pristine cell with NCA-based cathode (dark
DOI: 10.4236/msa.2018.91011 164 Materials Sciences and Applications
cell at 70% SOC compared to cycled cell at 30% SOC is decreased by 2000 mA, due to different aging processes. Beside the reduction of current intensity while discharge and charge, especially the overpotential of lithium deintercalation at
the NCA cathode is increased by 45 mV. Considering the potential shift ∆φ
be-tween all three cells a further difference in aging behavior is observed. Whereas the cell cycled at 30% SOC compared to the pristine cell no shift is shown, a
po-tential shift ∆φ by cycling at 70% SOC is indicated in Figure 4. Thus, aging
be-havior regarding cycling with small DOD at different SOC causes a phase change in NCA material.
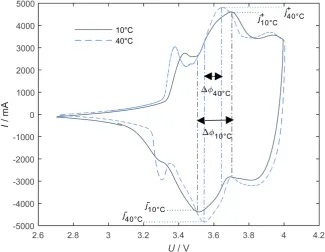
In Figure 5 cyclic voltammetry at two different temperatures in order to
de-termine temperature depending electrochemical processes is carried out. The
scan rate of 0.020 mV∙s−1 for the positive and the negative sweep is constant. For
each pair of peaks a potential shift ∆φ is observed, especially the lithiation and
delithiation is of interest. At higher temperature (40˚C) less potential difference compared to low temperature (10˚C) is detected. According to literature a diffu-sion process is the main inhibiting process, in addition the charge transfers play
no mayor role in this case [47]. The main mechanism of this electrochemical
[image:10.595.211.537.416.668.2]process is diffusion limited. But one additional mechanism is observed. The ratio of current density j+/j− is not constant, in this case a temperature depending change in charge transfer occurs. The reduction of current density depending on less temperature while lithinate NCA-based material is higher compared to the reduction of delithiation current density. Current density in general depends on
Figure 5. Cyclic voltammograms of a commercial Li NCA cell after partial cycles with 10% DOD at averaged 70% SOC with a constant potential scan rate of 0.020 mV∙s−1 at
DOI: 10.4236/msa.2018.91011 165 Materials Sciences and Applications
temperature. Decreasing temperature leads to decreasing current, because elec-trochemical processes are kinetic depending processes, which is seen in Equation (2) where j, j0 are the current densities with ∆rG the free reaction enthalpy, R the ideal gas constant and T the temperature.
r
0e
G RT
j j
∆
−
= (2)
Especially for electrochemical processes the Butler-Volmer equation is used, where F is the Faraday constant, α is the transfer coefficient and η is the overpo-tential.
(1 )
0 e e
nF nF
RT RT
j j
α
α −
− η − η
= −
(3)
Oxidation and reduction underlay different mechanism; a variation and an asymmetrical change of current density are shown. In this case lithiation while changing the crystal structure is inhibited. During this change the lattice para-meter varies. According to literature the oxide delithiation process which occurs
while charging the cell results in a decrease lattice occupancy fraction [47]. In
order to confirm the previous results the variation of potential scan rate is car-ried out.
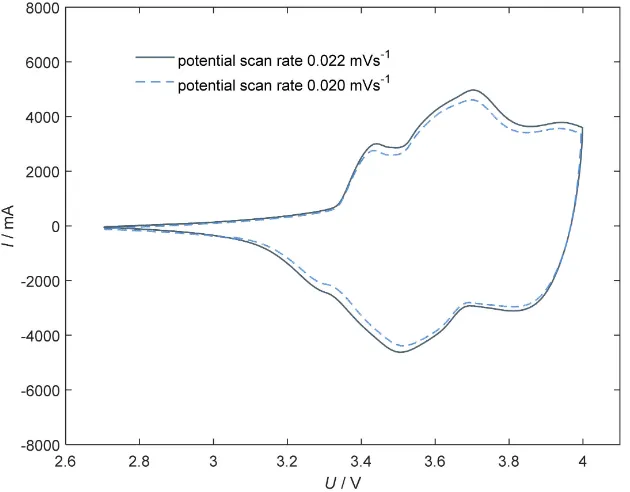
[image:11.595.218.533.424.670.2]One important parameter for interpreting CV is the potential scan rate. In
Figure 6 two CV’s with different potential scan rates 0.020 mV∙s−1 and 0.022
mV∙s−1 of the aged cell cycled at 70% are shown. In this case the current intensity
Figure 6. Cyclic voltammograms of a commercial NCA cathode based cell after partial cycles with 10% DOD at averaged 70% SOC at 10˚C ambient temperature with a constant potential scan rate of 0.022 mV∙s−1 (dark gray line) and a constant potential scan rate of
DOI: 10.4236/msa.2018.91011 166 Materials Sciences and Applications
decreases with lower potential scan rates. Also the difference between absolute current for oxidation and reduction is constant. But one important result is the fixed overpotential between oxidation to reduction peak. If a reaction with inhi-bited charge transfer as main mechanism exists a difference between overpoten-tial at different scan rates will occur. If a diffusion limited process is the main mechanism no change between overpotential will be observed. In this case the behavior hint to diffusion limited process.
In general the mechanisms of cyclic voltammetry are shown in Figures 4-6.
For an aged cell at Figure 5 a potential difference between lithiation and delithi-ation state at cycling around 70% is observed. The conclusion is a diffusion li-mitation in lithiation of NCA which is a conclusion of irreversible loss of lithium
while changing crystal structure, which leads to change in lattice parameter [48]
and changes in addition the state of nickel ions. In this case nickel ions will be inactive during change and the lithium intercalated in the NCA material is not completely able to delithinate, which leads to an additional barrier regarding change in order of nickel with potential change. In addition to this process the current density while discharge and therefore lithiation of NCA decreases.
According to literature [36], an overpotential ∆φ should be observed, if an
electrochemical charge transfer is inhibited. This is not seen in Figure 6, no
in-crease of ∆φ is observed. In this case the main mechanism is a diffusion limited
reaction. Considering Figure 5 it apparently supports that theory. If temperature
is changed, a high difference between potential of reduction and oxidation is de-termined, but also a change of current density ratio with limitation to lithiation of NCA happens. In this case a diffusion depending limitation could be observed with additional change in reaction mechanism, which is temperature depending.
In this case the lattice parameter change, which is known in literature [48]
play-ing a key role limitplay-ing the diffusion limitation and leadplay-ing to irreversible losses of lithium.
One additional important investigation during aging processes is temperature behavior. As mentioned before, change in crystal structure is one important mechanism of aging a NCA-based Li-ion cell by cycling with small DOD. The phase change leads to a variation in lattice parameter and changes the order of the system. In this case the entropy of system is changed. The entropic effect has an impact on aging behavior of NCA-cathodes, because entropy change of solid materials leads in general to structural stresses. In order to determine entropic
effects the change in temperature is the key factor [49]. The change in entropy in
general could be positive or negative, which results in positive or negative tem-perature gradients in the cell.
Considering Figure 7(c) at charging and discharging process the temperature
development shows a non linearity behavior. It is known that increased temper-ature gradients at boundary voltage areas occur due diffusion limitation [50].
DOI: 10.4236/msa.2018.91011 167 Materials Sciences and Applications (a) (b)
[image:13.595.232.514.63.303.2](c)
Figure 7. (a) Differential temperature voltammetry while charge at 25˚C ambient temperature; (b) Differential temperature voltammetry while discharge at 25˚C ambient temperature; (c) Temperature behavior of a commercial LiNCA cell while a standard CC-CV charge and CC-discharge cycle with C/5 and ambient temperature at 25˚C.
flow temperature arises with ohmic losses. Only entropic losses could change the behavior in electrochemical cells. In this case the phase transition of NCA could be the reason. Cycling between 3.65 V and 3.85 V leads to a higher average tem-perature in contrast to cycling between 3.44 V and 3.62 V. In this case two main factors for accelerated aging by cycling around 70% SOC are determined.
The derivative of voltage above the derivative of temperature could be used to describe the reaction entropy ∆rS[51].
r
d d
T nF
U =∆ S (4)
In order to determine the temperature development due to entropic effects the differential temperature voltammetry [52] is carried out.
d d d
d d
d T
T t DTV
U U
t
= = (5)
Shown in Figure 7(a) and Figure 7(b) the highest entropic effect of
posi-DOI: 10.4236/msa.2018.91011 168 Materials Sciences and Applications
tive temperature evolution. The negative change in entropy could be explained
by reduction of lattice parameter. Considering the peak in Figure 7(b) it is
shown, that the discharging process with respect to phase transition leads also to a positive temperature gradient, but the negative voltage development leads to a decrease in absolute temperature. The change in entropy regarding phase transi-tion while discharge process is positive caused due to negative temperature evo-lution. The positive change in entropy could be explained by increase of lattice parameter.
4. Discussion
It is known in literature, that the cathode material is the dominant part for aging
of NCA-cathode based with graphite anode based battery cells [29]. Also it is
well studied, that micro cracks in cathode material are one of the main
degrada-tion mechanism [48]. In those studies high current rates or high depths of
dis-charge are the typical measurement conditions [30].
Regarding the capacity fading different results are obtained with respect to cycling at 70% SOC compared to cycling at 30% SOC with small DOD. The de-tailed capacity progress with respect to d aging at 70% SOC is investigated. In li-terature a phase transition in the region of 70% SOC is known, this is a change
from monoclinic to hexagonal structure [32] where lattice parameter changes.
Based on impedance spectroscopy the diffusion behavior is determined as main inhibiting processes. Moreover, cyclic voltammetry is carried out to identify the impact of phase transition with respect to potentio dynamic behavior caused due to the different aging processes. This is a direct correlation between phase tran-sition and aging process. By varying the parameters potential scan rate and the temperature also a diffusion limitation is determined. According to literature an inactive state of Ni3+ and Ni2+ with oxygen loss of active material is known [31], which disabled lithium intercalation and deintercalation. With respect to the re-ceived results the diffusion limitation regarding the phase transition is an aging mechanism for cycling with small depth of discharges. Additionally, the diffe-rential thermal voltammetry is carried out to determine the effect of entropy with respect to the temperature influence. The results show a direct impact of entropy caused due to the temperature behavior regarding the change in crystal structure. This entropy depending temperature profile has an additional impact on aging processes.
In order to underpin the results received in this study, the anode material should be mentioned. According to literature the graphite anode combined with
NCA based cathode is not the main aging factor [28]. But one mechanism with
respect to cell aging of graphite/NCA belonging to anode side is discussed in li-terature [53]. Particular at 3.7 V and higher potential lithium plating is observed. In this region a lower charge transfer coefficient is expected. But also here high
current and particularly deep temperatures are necessary [54]. In both studies
DOI: 10.4236/msa.2018.91011 169 Materials Sciences and Applications
5. Conclusions
The study was performed with a graphite anode based lithium ion battery com-bined with a NCA oxide base cathode. A strong dependency between cycling with small DOD at different SOC was observed. If cycling around 30% SOC with 10% DOD is carried out, a much better life time performance could be reached in contrast to cycling around 70% SOC. The NCA based lithium ion battery cycling around 30% SOC shows after 600 full cycle equivalents only a degrada-tion of about 2%, whereas cycling around 70% SOC leads to a capacity decrease of 10%. Considering the results, the difference is a starting point for optimiza-tion, in order to enhance battery system lifetime. This cycling behavior know-ledge is necessary for NCA lifetime prediction, especially in virtual storage plant for delivering primary reserve and has an important impact on efficiency and economy, caused on the possibility to deal with different system states. It is im-portant to know, which aging mechanisms are essential in order to optimize the cell behavior and adapt it to system performance.
Furthermore, the behavior of capacity loss could be described by cyclic vol-tammetry in detail. We could correlate different effects to the physico chemical effects like phase transitions. It could be shown, that fatigued NCA lithium ion battery cells cycled with small DOD depend strongly on state of charge and so on phase transition. Also the impact of reversible heat and the entropic effect were interpreted. It was shown, that the diffusion of the electrochemical system is limited. In addition an electrochemical discharge inhibition occurs while de-gradation progress. According to literature and in post mortem analyses, the
disorientation of Ni [32] could be observed and confirmed.
Also impedance analysis via spectroscopy was carried out and confirmed the results. A higher temperature in average by cycling around 70% state of charge compared to cycling around 30% SOC was found. An additional increase of in-ternal resistance at higher frequencies which correlate with growth in SEI and also at lower frequencies which correlate with diffusion processes could be de-termined.
In future, additionally to existing results from NCA aging behavior, other state of charges (SOC) will be investigated to support the degradation theory and optimize the aging depending use of decentralized and distributed battery sys-tem for supplying primary control reserve in a virtual storage plant. Further-more, the ambient temperature of cycling will be changed to see the impact of temperature correlation to the phase transition. In following investigation, addi-tional cathode electrode chemistry will be investigated to encourage the results.
Acknowledgements
DOI: 10.4236/msa.2018.91011 170 Materials Sciences and Applications
References
[1] International Energy Agency (2015) Energy Technology Perspectives 2015. Paris. [2] International Energy Agency (2015) World Energy Outlook 2015. Paris.
[3] Thrän, D., Dotzauer, M., Lenz, V., Liebetrau, J. and Ortwein, A. (2015) Flexible Bio- energy Supply for balancing Fluctuating Renewables in the Heat and Power Sec-tor—A Review of Technologies and Concepts. Energy, Sustainability and Society, 5, 1-15. https://doi.org/10.1186/s13705-015-0062-8
[4] Price, A. (2015) Storage Technology and Future Developments. Energy Storage: What’s Next for the Grid? 1-23. https://doi.org/10.1049/ic.2015.0074
[5] Landry, M. and Gagnon, Y. (2015) Energy Storage: Technology Applications and Policy Options. Energy Procedia, 79, 315-320.
https://doi.org/10.1016/j.egypro.2015.11.494
[6] Pillot, C. (2012) The Worldwide Battery Market 2011-2025. Batteries 2012, Nice. [7] Markets and Markets (2014) Portable Battery Pack Market by Capacity Range, Pro-
duct Type (Smartphone, Tablet, Portable Devices and Others), Technology (Li-Ion, Nickel Metal Hydride, Li-Polymer, and Nickel Cadmium) & Geography—Global Forecast to 2014-2020.
[8] He, J.J., Hu, K.-W. and Liaw, C.-M. (2015) On a Battery/Supercapacitor Powered SRM Drive for EV with Integrated On-Board Charger. IEEE International Confe-rence on Industrial Technology (ICIT),March 17-19 2015, Seville, 2667-2672.
https://doi.org/10.1109/ICIT.2015.7125491
[9] Gunlu, G. (2015) Investigation of Hybrid Fuel Cell-Battery Systems. ECS Transac-tions, 65, 87-91. https://doi.org/10.1149/06501.0087ecst
[10] Dallinger, D., Krampe, D. and Wietschel, M. (2011) Vehicle-to-Grid Regulation Re- serves Based on a Dynamic Simulation of Mobility Behavior. IEEE Transactions on Smart Grid, 2, 302-313. https://doi.org/10.1109/TSG.2011.2131692
[11] Genoese, F. and Genoese, M. (2014) Assessing the Value of Storage in a Future Energy System with a High Share of Renewable Electricity Generation. Energy Sys-tems, 5, 19-44.https://doi.org/10.1007/s12667-013-0076-2
[12] Hoppmann, J., Volland, J., Schmidt, T., Hoffmann, S. and Volker, H. (2014) The Economic Viability of Battery Storage for Residential Solar Photovoltaic Systems— A Review and a Simulation Model. Renewable and Sustainable Energy Reviews, 39, 1101-1118.https://doi.org/10.1016/j.rser.2014.07.068
[13] Betzin, C., Wolfschmidt, H. and Luther, M. (2018) Electrical Operation Behavior and Energy Efficiency of Battery Systems in a Virtual Storage Power Plant for Pri-mary Control Reserve. International Journal of Electrical Power and Energy Sys-tems, 97, 138-145.https://doi.org/10.1016/j.ijepes.2017.10.038
[14] Schlasza, C., Ostertag, P., Chrenko, D., Kriesten, R. and Bouquain, D. (2014) Review on the Aging Mechanisms in Li-Ion Batteries for Electric Vehicles Based on the FMEA Method. Transportation Electrification Conference and Expo, Dearborn, June 15-18 2014, 1-6.https://doi.org/10.1109/ITEC.2014.6861811
[15] Vetter, J., Novák, P., Wagner, M.R., Veit, C., Möller, K.-C., Besenhard, J.O., Winter, M., Wohlfahrt-Mehrens, M., Vogler, C. and Hammouche, A. (2015) Ageing Mecha- nisms in Lithium-Ion Batteries. Journal of Power Sources, 14, 269-281.
[16] Lang, F., Wei, Z., Tan, C.M. and Yazami, R. (2017) Hierachical Degradation Pro- cesses in Lithium-Ion Batteries during Ageing, Electrochimica Acta, 256, 52-62.
https://doi.org/10.1016/j.electacta.2017.10.007
DOI: 10.4236/msa.2018.91011 171 Materials Sciences and Applications
Calendar Aging of a Graphite/LiFePO4 Cell. Journal of Power Sources, 208, 296-
305.https://doi.org/10.1016/j.jpowsour.2012.02.068
[18] Käbitz, S., Gerschler, J.B., Ecker, M., Yurdagel, Y., Emmermacher, B., André, D., Mitsch, T. and Sauer, D.U. (2013) Cycle and Calendar Life Study of a Graphite/Li- Ni1/3Mn1/3Co1/3O2 Li-Ion High Energy System. Part A: Full Cell Characterization.
Journal of Power Sources, 239, 572-583.
https://doi.org/10.1016/j.jpowsour.2013.03.045
[19] Cho, I.H., Kim, S.S., Shin, S.C. and Choi, N.S. (2010) Effect of SEI on Capacity Losses of Spinel Lithium Manganese Oxide/Graphite Batteries Stored at 60˚C. Elec-trochemical and Solid-State Letters, 13, A168-A172.
https://doi.org/10.1149/1.3481711
[20] Anseán, D., Gonzaléz, M., Viera, J.C., García, V.M., Blacno, C. and Valledor, M. (2013) Fast Charging Technique for High Power Lithium Iron Phosphate Batteries: A Cycle Life Analysis. Journal of Power Sources, 239, 9-15.
https://doi.org/10.1016/j.jpowsour.2013.03.044
[21] Bodenes, L., Naturel, R., Martinez, H., Dedryvére, R., Menetrier, M., Croguennec, L., Pérès, J.P., Tessier, C. and Fischer, F. (2013) Lithium Secondary Batteries Work-ing at Very High Temperature: Capacity Fade and UnderstandWork-ing of AgWork-ing Me-chanisms. Journal of Power Sources, 236, 265-275.
https://doi.org/10.1016/j.jpowsour.2013.02.067
[22] Joglekar, M.M. and Ramakrishnan, N. (2013) Cyclic Capacity Fade Plots for Aging Studies of Li-Ion Cells. Journal of Power Sources, 230, 143-147.
https://doi.org/10.1016/j.jpowsour.2012.12.060
[23] Barré, A., Deguilhem, B., Grolleau, S., Gérard, M., Suard, F. and Ríu, D. (2013) A Review on Lithium-Ion Battery Ageing Mechanisms and Estimations for Automo-tive Applications. Journal of Power Sources, 241, 680-689.
https://doi.org/10.1016/j.jpowsour.2013.05.040
[24] Liu, P., Wang, J., Hicks-Garner, J., Sherman, E., Soukiazian, S., Verbrugge, M., Ta-taria, H., Musser, J. and Finamore, P. (2010) Aging Mechanisms of LiFePO4
Batte-ries Deduced by Electrochemical and Strucutral Analysis. Journal of the Electroche- mical Society, 157, A499-A507.https://doi.org/10.1149/1.3246839
[25] Ramana, C.V., Mauger, A., Gendron, F., Julien, C.M. and Zaghib, K. (2009) Study of the Li-Insertion/Extraction Process in LiFePO4/FePO4. Journal of Power Sources,
187, 555-564.https://doi.org/10.1016/j.jpowsour.2008.11.042
[26] Tarascon, J.M., Mckinnon, W.R., Coowar, F., Bowmer, T.N., Amatucci, G. and Guyomard, D. (1994) Synthesis Conditions and Oxygen Stoichiometry Effects on Li Insertion into the Spinel LiMn2O4. Journal of the Electrochemical Society, 141,
1421-1431.https://doi.org/10.1149/1.2054941
[27] Gabrisch, H., Tanghong, Y. and Yazami, R. (2008) Transmission Electron Micro-scope Studies of LiNi1/3Mn1/3Co1/3O2 before and after Long-Term Aging at 70˚C.
Electrochemical and Solid-State Letters, 11, A119-A124.
https://doi.org/10.1149/1.2919713
[28] Liu, W., Delacourt, C., Forgez, C. and Pelissier, S. (2011) Study of Graphite/NCA Li-Ion Cell Degradation during Accelerated Aging Tests—Data Analysis of the Sim Stock Project. Vehicle Power and Propulsion, Chicago, 6-9 September 2011, 1-6.
https://doi.org/10.1109/VPPC.2011.6043110
DOI: 10.4236/msa.2018.91011 172 Materials Sciences and Applications
[30] Watanabe, S., Kinoshita, M., Hosokawa, T., Morigaki, K. and Nakura, K. (2014) Capacity Fading of LiAlyNi1−x−yCoxO2 Cathode for Lithium-Ion Batteries during
Accelerated Calendar and Cycle Life Tests (Effect of Depth of Discharge in Charge Discharge Cycling on the Suppression of the Micro-Crack Generation of LiAl
y-Ni1−x−yCoxO2 Particle). Journal of Power Sources, 260, 50-56.
https://doi.org/10.1016/j.jpowsour.2014.02.103
[31] Muto, S., Sasano, Y., Tatsumi, K., Sasaki, T., Horibuchi, K., Takeuchi, Y. and Ukyo, Y. (2009) Capacity-Fading Mechanisms of LiNiO2-Based Lithium-Ion Batteries II.
Diagnostic Analysis by Electron Microscopy and Spectroscopy. Journal of the Elec-trochemical Society, 156, A371-A377. https://doi.org/10.1149/1.3076137
[32] Yang, X., Sun, X. and McBreen, J. (1999) New Findings on the Phase Transitions in Li1−xNiO2: In Situ Synchrotron X-Ray Diffraction Studies. Electrochemistry
Com-munications, 1, 227-232.https://doi.org/10.1016/S1388-2481(99)00046-6
[33] Atkins, P.W. and Paula, J.D. (2014) Physical Chemistry. Oxford University Press, Oxford, 10th Edition, 920-926.
[34] Macdonald, D.D., Varma, R. and Selman, J.R. (1991) Techniques for Characteriza-tion of Electrodes and Electrochemical Processes. Wiley, New York.
[35] Hamann, C.H. and Vielstich, W. (2005) Elektrochemie. Wiley-VCH, Weinheim, 4th Edition, 284-295.
[36] Bard, A.J. and Faulkner, L.R. (2001) Electrochemical Methods. John Wiley & Sons, New York, 2nd Edition, 226-256.
[37] Betzin, C., Wolfschmidt, H. and Luther, M. (2016) Long Time Behavior of Li-Ni0.80Co0.15Al0.05O2 Based Lithium-Ion Cells by Small Depth of Discharge at Specific
State of Charge for Primary Control Reserve in a Virtual Energy Storage Plant. Energy Procedia, 99, 235-242.https://doi.org/10.1016/j.egypro.2016.10.114
[38] Wong, D., Shrestha, D., Wetz, D.A. and Heinzel, J.M. (2015) Impact of High Rate Discharge on the Aging of Lithium Nickel Cobalt Aluminum Oxide Batteries. Jour-nal of Power Sources, 280, 363-372.https://doi.org/10.1016/j.jpowsour.2015.01.110
[39] Barsoukov, E. and Macdonald, J.R. (2005) Impedance Spectroscopy Theory, Experi- ment and Applications. Wiley, New York.https://doi.org/10.1002/0471716243
[40] Schindler, S., Bauer, M., Petzl, M., Danzer, M. and Michael, A. (2016) Voltage Re-laxation and Impedance Spectroscopy as In-Operando Methods for the Detection of Lithium Plating on Graphitic Anodes in Commercial Lithium-Ion Cells. Journal of Power Sources, 304, 170-180.https://doi.org/10.1016/j.jpowsour.2015.11.044
[41] Amemiya, T., Hashimoto, K. and Fujishima, A. (1993) Faradaic Charge Transfer with Double-Layer Charging and/or Adsorption-Related Charging at Polymer- Modified Electrodes as Observed by Color Impedance Spectroscopy. The Journal of Physical Chemistry, 97, 9736-9740.https://doi.org/10.1021/j100140a033
[42] Stroe, D.-I., Swiercynski, M., Stroe, A.-I., Kaer, S.K. and Teodorescu, R. (2017) Li-thium-Ion Battery Power Degradation Modelling by Electrochemical Impedance Spectroscopy. IET Renewable Power Generation, 11, 1136-1141.
https://doi.org/10.1049/iet-rpg.2016.0958
[43] Stroe, D.-I., Swierczynski, M., Stroe, A.-I., Knap, V., Teodorescu, R. and Andreasen, S.J. (2015) Evaluation of Different Methods for Measuring the Impedance of Li-thium-Ion Batteries during Ageing. 10th International Conference on Ecological Vehicles and Renewable Energies, Monte Carlo, March 31-April 2 2015, 1-8. [44] Schönleber, M., Uhlmann, C., Braun, P., Weber, A. and Ivers-Tiffée, E. (2017) A
DOI: 10.4236/msa.2018.91011 173 Materials Sciences and Applications https://doi.org/10.1016/j.electacta.2017.05.009
[45] Wang, Q. (2017) Ionic Transport and Dielectric Properties in NaNbO under High Pressure. Applied Physics Letters, 111, 152903-152907.
https://doi.org/10.1063/1.4999206
[46] Sivakkumar, S.R., Nerkar, J.Y. and Pandolfo, A.G. (2010) Rate Capability of Gra-phite Materials as Negative Electrodes in Lithium-Ion Capacitors. Electrochimica Acta, 55, 3330-3335.https://doi.org/10.1016/j.electacta.2010.01.059
[47] Abraham, D.P., Kawauchi, S. and Dees, D.W. (2008) Modeling the Impedance Ver-sus Voltage Characteristics of LiNi0.8Co0.15Al0.05O2. Electrochimica Acta, 53, 2121-
2129.https://doi.org/10.1016/j.electacta.2007.09.018
[48] Kleiner, K., Dixon, D., Jakes, P., Melke, J., Yavuz, M., Roth, C., Nikolowski, K., Lie-bau, V. and Ehrenberg, H. (2015) Fatigue of LiNi0.8Co0.15Al0.05O2 in Commercial Li
Ion Batteries. Journal of Power Sources, 273, 70-82.
https://doi.org/10.1016/j.jpowsour.2014.08.133
[49] Williford, R.E., Viswanathan, V.V. and Zhang, J.-G. (2009) Effects of Entropy Changes in Anodes and Cathodes on the Thermal Behavior of Lithium Ion Batte-ries. Journal of Power Sources, 189, 101-107.
https://doi.org/10.1016/j.jpowsour.2008.10.078
[50] Smith, K. and Wang, C.Y. (2006) Solid-State Diffusion Limitations on Pulse Opera-tion of a Lithium Ion Cell for Hybrid Electric Vehicles. Journal of Power Sources, 161, 628-639.https://doi.org/10.1016/j.jpowsour.2006.03.050
[51] Schlögel, P. (2013) Chemical Energy Storage. De Gruyter Graduate, Berlin, 135-150. [52] Wu, B., Yufit, V., Merla, Y., Martinez-Botas, R.F., Brandon, N.P. and Offer, G.J.
(2015) Differential Thermal Voltammetry for Tracking of Degradation in Lithium- Ion Batteries. Journal of Power Sources, 273, 495-501.
https://doi.org/10.1016/j.jpowsour.2014.09.127
[53] Legrand, N., Knosp, B., Desprez, P., Lapicque, F. and Raël, S. (2014) Physical Cha-racterization of the Charging Process of a Li-Ion Battery and Prediction of Li Plat-ing by Electrochemical ModelPlat-ing. Journal of Power Sources, 245, 208-216.
https://doi.org/10.1016/j.jpowsour.2013.06.130