2017, Volume 4, e4045 ISSN Online: 2333-9721 ISSN Print: 2333-9705
DOI: 10.4236/oalib.1104045 Dec. 6, 2017 1 Open Access Library Journal
Study on Spatial Structure Dynamic Evolution
of Tourism Economic Zone along
Wuhan-Guangzhou HSR
Chun Liu
1,21Department of Management, Wuhan Technology and Business University, Wuhan, China 2Hubei Business Service Development Research Center, Wuhan, China
Abstract
Wuhan-Guangzhou HSR is a passenger line, communication with Wuhan Urban Agglomeration, Changsha-Zhuzhou-Xiangtan Urban Agglomeration and the Pearl River Delta Urban Agglomeration. Wuhan-Guangzhou HSR achieves a bus-based operation, shortens the distance between cities, condu-cive to economic development, regional tourism. Applying Point Axis theory and Spatial Structure theory, this paper analyzes and contrasts regional economy and society, analyzing the dynamic change of regional tourism economy along Wuhan-Guangzhou HSR with its operation for the past five years, revealing high-speed transportation on the impact of regional tourism space, proposes that Tourism Economic Zone along Wuhan-Guangzhou HSR is divided into core tourism economic zone, compact tourism economic zone and radiant tourism economic zone, and makes recommendations, promoting regional tourism economy healthy and rapid development.
Subject Areas
Economic System, Public Economics
Keywords
Wuhan-Guangzhou HSR, Tourism Economic Zone, Spatial Structure, Dynamic Evolution
1. Introduction
After 5 years of operation, Wuhan-Guangzhou HSR fully implements the opera-tion of High Frequency and Public Transport, connecting Wuhan Urban Ag-How to cite this paper: Liu, C. (2017)
Study on Spatial Structure Dynamic Evolution of Tourism Economic Zone
along Wuhan-Guangzhou HSR. Open
Access Library Journal, 4: e4045. https://doi.org/10.4236/oalib.1104045
Received: October 20, 2017 Accepted: December 3, 2017 Published: December 6, 2017
Copyright © 2017 by author and Open Access Library Inc.
This work is licensed under the Creative Commons Attribution International License (CC BY 4.0).
DOI: 10.4236/oalib.1104045 2 Open Access Library Journal glomeration, Changsha-Zhuzhou-Xiangtan Urban Agglomeration and the Pearl River Delta Urban Agglomeration into an organic whole, achieving cross-regional Urban Integration traffic. Wuhan-Guangzhou HSR shortens the spatial percep-tion distance between cities along the railway, speeds up the cooperative process of regional tourism, and promotes the integration of regional tourism resources.
The factors affecting the formation of regional tourism space include five as-pects: tourist attraction, traffic conditions, accommodation, infrastructure and other service facilities [1]. Among them, the convenient transport mode is the precondition for the formation of large-scale regional tourism economic space. High-speed railway promotes the formation of Tourism Economic Zone along Wuhan-Guangzhou HSR, which is important to achieve the complementation of inter-provincial tourism resources in the Pan-PRD region, to promote the tour-ism economic cooperation between Hubei, Hunan, Guangdong provinces, and peripheral regions, to optimize and integrate regional tourism industry. By Wu-han-Guangzhou HSR, the Pearl River Delta Urban Agglomeration expands the hinterland, Hubei and Hunan provinces open the window facing to the forefront of reform and opening. The resultant force of regional tourism economic devel-opment will be more powerful.
Huang Ai-lian (2011) [2], Xiao Yan-fei (2013) [3], Wang De-gen (2015) [4]
build a double logarithm model, use the new economic geography model, the grey prediction model, the social survey questionnaire, GIS and social network analysis method, to discuss the influence of Wuhan-Guangzhou HSR and Bei-jing-Shanghai HSR on the development of tourism and producer services indus-try in their neighboring areas, put forward the contribution of the diffusion and agglomeration effects of High-speed railway on the regional tourism and service industry. Li Lin (2011) [5], Yang Xi (2014) [6], Mu Cheng-lin (2015) [7] conduct a quantitative research about the impact the high-speed railway exerted on Hu-nan Province, Yangtze River Delta region on the basis of Accessibility evaluation method, Moran’s I index analysis method, the shortest travel time modified gravity model, analyze the change of tourism traffic pattern along the high speed railway. Yin Ping (2012) [8], Wang De-gen (2013) [9], Yang Zhong-yuan (2013)
[10], Guo Jian-ke (2016) [11] take Zhengzhou-Xi’an HSR, Wuhan-Guangzhou HSR, Harbin-Dalian HSR for example, establish Social network analysis model, Transportation superiority degree model, Accessibility model to analyze the spa-tial variation characteristics of regional tourism structure along High-speed railway, then discuss the impact of transportation on the regional tourism spatial structure variation.
DOI: 10.4236/oalib.1104045 3 Open Access Library Journal railway, quantitatively analyzes Tourism Economic Zone along Wuhan-Guangzhou HSR by mathematical statistics method, dynamically explores the spatial struc-ture of Tourism Economic Zone along Wuhan-Guangzhou HSR based on the statistical data of 2010-2016, and puts forward the suggestion on the develop-ment of Tourism Economic Zone along Wuhan-Guangzhou HSR.
2. The Definition of Spatial Area of Tourism Economic Zone
along Wuhan-Guangzhou HSR
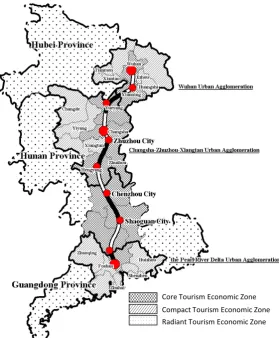
On the basis of John Friedman’s Core-Periphery Theory about the interaction and diffusion of city space, the core area is a subsystem of social regional organ-izations, which can generate and attract a large number of innovations; the pe-riphery area is another subsystem, which is interdependent with the core area, and its development direction mainly depends on the core area. The core area and the periphery area form a complete space system. According to the devel-opment situation of economic and society and tourism of the region along Wu-han-Guangzhou HSR, the spatial structure of Tourism Economic Zone along Wuhan-Guangzhou HSR is divided into the Core Tourism Economic Zone, the Compact Tourism Economic Zone and the Radiant Tourism Economic Zone. By the use of MapInfo software, draw the schematic diagram of spatial structure of Tourism Economic Zone along Wuhan-Guangzhou HSR (Figure 1). The spe-cific area coverage is defined as follows:
2.1. Area Coverage Definition of the Core Tourism Economic Zone
The core cities along Wuhan-Guangzhou HSR, accept substance flow, people flow and energy flow transfer of High-speed railway, the interaction between the cities is the strongest and the most extensive. The area coverage includes the ci-ties along Wuhan-Guangzhou HSR, such as Wuhan, Changsha, Guangzhou, Xianning, Yueyang, Zhuzhou, Hengyang, Chenzhou, Shaoguan and Qingyuan (Figure 1).2.2. Area Coverage Definition of the Compact Tourism Economic
Zone
DOI: 10.4236/oalib.1104045 4 Open Access Library Journal
Figure 1. Schematic diagram of spatial structure of Tourism Economic Zone
along Wuhan-Guangzhou HSR.
E’zhou, Huangshi, Xiaogan, Tianmen, Qianjiang and Xiantao in Wuhan Urban Agglomeration, Changde, Xiangtan, Yiyang and Loudi in Chang-sha-Zhuzhou-Xiangtan Urban Agglomeration, Shenzhen, Zhuhai, Foshan, Jiangmen, Dongguan, Zhongshan, Zhaoqing and Huizhou in the Pearl River Delta Urban Agglomeration (Figure 1).
2.3. Area Coverage Definition of the Radiant Tourism Economic
Zone
From the tourism economic potential energy and spatial accessibility of the cities in the Core Tourism Economic Zone and the Compact Tourism Economic Zone, the Radiant Tourism Economic Zone takes Wuhan-Guangzhou HSR as tourism economic transmission axis, takes the cities of the Core Tourism Eco-nomic Zone as tourism ecoEco-nomic growth pole, takes transport network of the Compact Tourism Economic Zone as tourism economic conduction carrier, tourism economy of which radiates remote areas in Hubei Province, Hunan province and Guangdong Province. The spatial scale covers the western Hubei Province of Hubei Province, the Xiangxi region of Hunan Province, the eastern and the western Guangdong Province (Figure 1).
DOI: 10.4236/oalib.1104045 5 Open Access Library Journal
3. Study on Spatial Structure Dynamic Evolution of Tourism
Economic Zone along Wuhan-Guangzhou HSR
3.1. Economic-Social-Tourism Analysis of the Core Tourism
Economic Zone
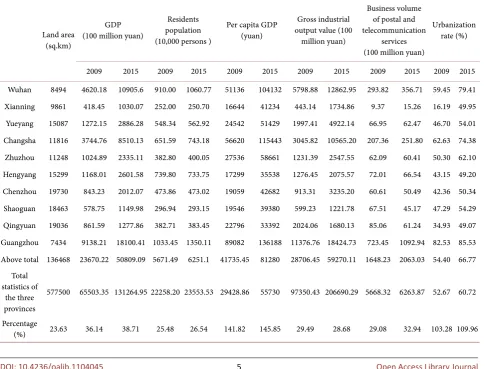
According to statistical data from Hubei Statistical Yearbook (2010-2016), Hunan Statistical Yearbook (2010-2016), Guangdong Statistical Yearbook (2010-2016) and Chinese City Statistical Yearbook (2010-2016), collecting variables data such as Land Area, GDP, Residents Population, Per Capita GDP, Gross Industrial Output Value, Business Volume of Postal and Telecommunication Services, Ur-banization rate. By means of mathematical statistics, quantitatively reflects the social economic development situation of the Core Tourism Economic Zone (such as Table 1).
The Core Tourism Economic Zone covers an area of 13.65 × 10⁴ km2, which is
[image:5.595.58.544.380.749.2]23.63% of the total area of Hubei Province, Hunan province and Guangdong province. After 5 years operation, Wuhan-Guangzhou HSR narrow the distance between big cities, the attraction of towns and cities along Wuhan-Guangzhou HSR is also increasing, the economic and social changes have significantly taken place in the Core Tourism Economic Zone, agglomeration of which highlights
Table 1. The social economic development situation of the Core Tourism Economic Zone.
Land area (sq.km)
GDP (100 million yuan)
Residents population (10,000 persons )
Per capita GDP (yuan)
Gross industrial output value (100
million yuan)
Business volume of postal and telecommunication
services (100 million yuan)
Urbanization rate (%)
2009 2015 2009 2015 2009 2015 2009 2015 2009 2015 2009 2015
Wuhan 8494 4620.18 10905.6 910.00 1060.77 51136 104132 5798.88 12862.95 293.82 356.71 59.45 79.41
Xianning 9861 418.45 1030.07 252.00 250.70 16644 41234 443.14 1734.86 9.37 15.26 16.19 49.95
Yueyang 15087 1272.15 2886.28 548.34 562.92 24542 51429 1997.41 4922.14 66.95 62.47 46.70 54.01
Changsha 11816 3744.76 8510.13 651.59 743.18 56620 115443 3045.82 10565.20 207.36 251.80 62.63 74.38
Zhuzhou 11248 1024.89 2335.11 382.80 400.05 27536 58661 1231.39 2547.55 62.09 60.41 50.30 62.10
Hengyang 15299 1168.01 2601.58 739.80 733.75 17299 35538 1276.45 2075.57 72.01 66.54 43.15 49.20
Chenzhou 19730 843.23 2012.07 473.86 473.02 19059 42682 913.31 3235.20 60.61 50.49 42.36 50.34
Shaoguan 18463 578.75 1149.98 296.94 293.15 19546 39380 599.23 1221.78 67.51 45.17 47.29 54.29
Qingyuan 19036 861.59 1277.86 382.71 383.45 22796 33392 2024.06 1680.13 85.06 61.24 34.93 49.07
Guangzhou 7434 9138.21 18100.41 1033.45 1350.11 89082 136188 11376.76 18424.73 723.45 1092.94 82.53 85.53
Above total 136468 23670.22 50809.09 5671.49 6251.1 41735.45 81280 28706.45 59270.11 1648.23 2063.03 54.40 66.77 Total
statistics of the three provinces
577500 65503.35 131264.95 22258.20 23553.53 29428.86 55730 97350.43 206690.29 5668.32 6263.87 52.67 60.72
Percentage
DOI: 10.4236/oalib.1104045 6 Open Access Library Journal the role in the three provinces such as Hubei Province, Hunan province and Guangdong Province, the economic and social development indicators of the Core Tourism Economic Zone have shown rapid growth, especially GDP, resi-dent population, per capita GDP, industrialization, informatization and urbani-zation have made a great development. During the 2009-2015 year study period, the development speed of the above indicators except industrial development were faster than that of the three provinces, and the leading development ad-vantages become increasingly obvious. The share of industrial development in the three provinces showed a downward trend.
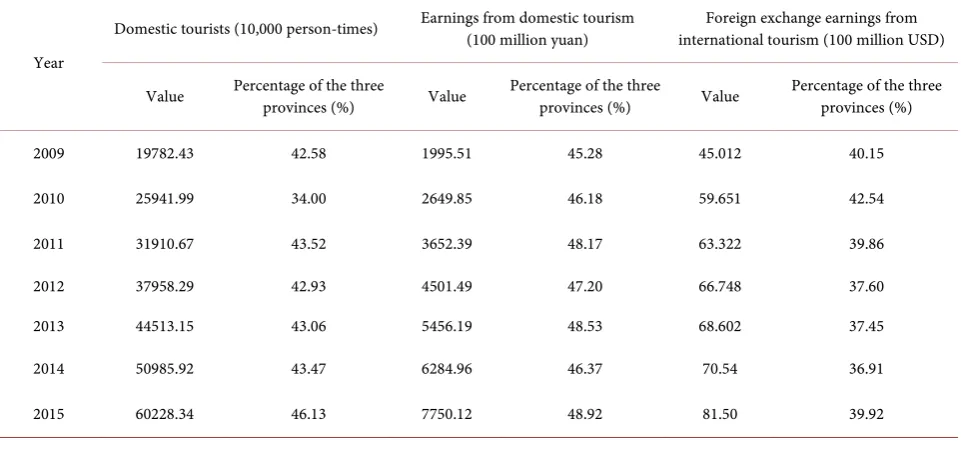
After 5 years operation of Wuhan-Guangzhou HSR, reception of Domestic Tourists in the Core Tourism Economic Zone increased from 197.8243 million person-times in 2009 to 602.2834 million person-times in 2015. The corres-ponding period, Earnings from Domestic Tourism increased from 199.551 bil-lion yuan to 775.12 bilbil-lion yuan, Foreign Exchange Earnings from International Tourism increased from 4.5012 billion USD to 8.150 billion USD. Domestic Tourists and Earnings from Domestic Tourism accounted for more than 40% of the three provinces such as Hubei Province, Hunan province and Guangdong Province, and grows significantly. The proportion of Foreign Exchange Earnings from International Tourism in the three provinces shows a trend of fluctuation
(Table 2). From the above analysis, it can be concluded that tourism economy
[image:6.595.59.540.505.730.2]developed, transport network fast and convenient in the Core Tourism Eco-nomic Zone, especially the role of the railway. The Core Tourism EcoEco-nomic Zone has the advantages of funds, information, markets, etc. Wuhan-Guangzhou HSR operation and greatly enhance the strength of tourism economy core tour-ism economic zone. The operation of Wuhan-Guangzhou HSR has greatly im-proved the tourism economic strength of the Core Tourism Economic Zone.
Table 2. The tourism economic development situation of the Core Tourism Economic Zone (2009-2015).
Year
Domestic tourists (10,000 person-times) Earnings from domestic tourism (100 million yuan) international tourism (100 million USD) Foreign exchange earnings from
Value Percentage of the three provinces (%) Value Percentage of the three provinces (%) Value Percentage of the three provinces (%)
2009 19782.43 42.58 1995.51 45.28 45.012 40.15
2010 25941.99 34.00 2649.85 46.18 59.651 42.54
2011 31910.67 43.52 3652.39 48.17 63.322 39.86
2012 37958.29 42.93 4501.49 47.20 66.748 37.60
2013 44513.15 43.06 5456.19 48.53 68.602 37.45
2014 50985.92 43.47 6284.96 46.37 70.54 36.91
DOI: 10.4236/oalib.1104045 7 Open Access Library Journal
3.2. Economic-Social-Tourism Analysis of the Compact Tourism
Economic Zone
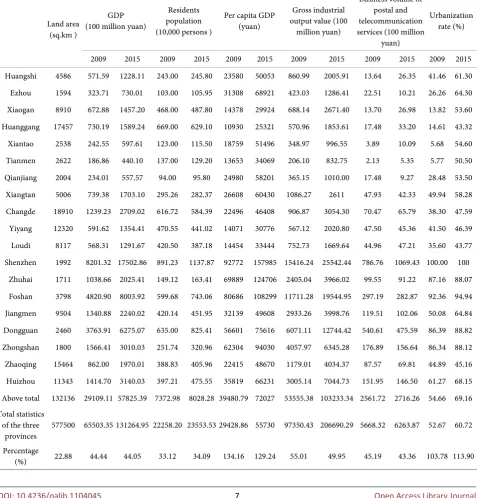
From the social economic development situation of the Compact Tourism Eco-nomic Zone (Table 3), the Compact Tourism Economic Zone covers an area of 13.21 × 10⁴ km2, which is 22.88% of the total area of Hubei Province, Hunan
[image:7.595.60.538.250.749.2]province and Guangdong province. By means of the transport network system in Wuhan Urban Agglomeration, Changsha-Zhuzhou-Xiangtan Urban Agglome-ration and the Pearl River Delta Urban AgglomeAgglome-ration, relying on the huge socio-economic potential energy of the Core Tourism Economic Zone, the social
Table 3. The social economic development situation of the Compact Tourism Economic Zone.
Land area (sq.km )
GDP (100 million yuan)
Residents population (10,000 persons )
Per capita GDP (yuan)
Gross industrial output value (100 million yuan)
Business volume of postal and telecommunication services (100 million
yuan)
Urbanization rate (%)
2009 2015 2009 2015 2009 2015 2009 2015 2009 2015 2009 2015
Huangshi 4586 571.59 1228.11 243.00 245.80 23580 50053 860.99 2005.91 13.64 26.35 41.46 61.30
Ezhou 1594 323.71 730.01 103.00 105.95 31308 68921 423.03 1286.41 22.51 10.21 26.26 64.30
Xiaogan 8910 672.88 1457.20 468.00 487.80 14378 29924 688.14 2671.40 13.70 26.98 13.82 53.60
Huanggang 17457 730.19 1589.24 669.00 629.10 10930 25321 570.96 1853.61 17.48 33.20 14.61 43.32
Xiantao 2538 242.55 597.61 123.00 115.50 18759 51496 348.97 996.55 3.89 10.09 5.68 54.60
Tianmen 2622 186.86 440.10 137.00 129.20 13653 34069 206.10 832.75 2.13 5.35 5.77 50.50
Qianjiang 2004 234.01 557.57 94.00 95.80 24980 58201 365.15 1010.00 17.48 9.27 28.48 53.50
Xiangtan 5006 739.38 1703.10 295.26 282.37 26608 60430 1086.27 2611 47.93 42.33 49.94 58.28
Changde 18910 1239.23 2709.02 616.72 584.39 22496 46408 906.87 3054.30 70.47 65.79 38.30 47.59
Yiyang 12320 591.62 1354.41 470.55 441.02 14071 30776 567.12 2020.80 47.50 45.36 41.50 46.39
Loudi 8117 568.31 1291.67 420.50 387.18 14454 33444 752.73 1669.64 44.96 47.21 35.60 43.77
Shenzhen 1992 8201.32 17502.86 891.23 1137.87 92772 157985 15416.24 25542.44 786.76 1069.43 100.00 100
Zhuhai 1711 1038.66 2025.41 149.12 163.41 69889 124706 2405.04 3966.02 99.55 91.22 87.16 88.07
Foshan 3798 4820.90 8003.92 599.68 743.06 80686 108299 11711.28 19544.95 297.19 282.87 92.36 94.94
Jiangmen 9504 1340.88 2240.02 420.14 451.95 32139 49608 2933.26 3998.76 119.51 102.06 50.08 64.84
Dongguan 2460 3763.91 6275.07 635.00 825.41 56601 75616 6071.11 12744.42 540.61 475.59 86.39 88.82
Zhongshan 1800 1566.41 3010.03 251.74 320.96 62304 94030 4057.97 6345.28 176.89 156.64 86.34 88.12
Zhaoqing 15464 862.00 1970.01 388.83 405.96 22415 48670 1179.01 4034.37 87.57 69.81 44.89 45.16
Huizhou 11343 1414.70 3140.03 397.21 475.55 35819 66231 3005.14 7044.73 151.95 146.50 61.27 68.15
Above total 132136 29109.11 57825.39 7372.98 8028.28 39480.79 72027 53555.38 103233.34 2561.72 2716.26 54.66 69.16 Total statistics
of the three
provinces 577500 65503.35 131264.95 22258.20 23553.53 29428.86 55730 97350.43 206690.29 5668.32 6263.87 52.67 60.72
Percentage
DOI: 10.4236/oalib.1104045 8 Open Access Library Journal economic strength of the Compact Tourism Economic Zone can be greatly proved, especially urbanization and per capita GDP have been significantly im-proved. Urbanization increased from 54.66% in 2009 to 69.16% in 2015, the per capita GDP increased from 39480.79 yuan to 72027 yuan, the growth rate of the above two indicators is higher than that of the three provinces such as Hubei Province, Hunan province and Guangdong Province. Wuhan-Guangzhou HSR plays an important role in promoting coordinated development between big ci-ties and small and medium-sized cici-ties.
It can be seen from Table 4, Domestic Tourists, Earnings from Domestic Tourism, Foreign Exchange Earnings from International Tourism in the Core Tourism Economic Zone increased respectively from 137.1631 million per-son-times, 140.397 billion yuan, 6.1262 billion USD in 2009 to 316.7226 million person-times, 410.383 billion yuan, 11.382 billion USD in 2015. The proportion of Domestic Tourists and Earnings from Domestic Tourism in the three prov-inces such as Hubei Province, Hunan province and Guangdong Province de-creased obviously. The proportion of Foreign Exchange Earnings from Interna-tional Tourism in the three provinces shows a growth trend. The Core Tourism Economic Zone is the main destinations for inbound tourism, Foreign Exchange Earnings from International Tourism accounted for more than 50% of the total of Hubei Province, Hunan province and Guangdong province.
[image:8.595.55.541.554.733.2]The growth rate of the three tourism economic indicators such as Domestic tourists, Earnings from Domestic Tourism and Foreign Exchange Earnings from International Tourism in the Compact Tourism Economic Zone are lower than those of the Core Tourism Economic Zone. It is necessary to strengthen effective convergence between the transport of the three major urban agglomerations and the cities along Wuhan-Guangzhou HSR. Seen from Figure 1, there is a spatial discontinuity in the Compact Tourism Economic Zone. From the regional tour-ism economic development perspective, Changsha-Zhuzhou-Xiangtan Urban Agglomeration should plan Chenzhou into the development of Urban Agglo-meration, the Pearl River Delta Urban Agglomeration should plan Shaoguan and
Table 4. The tourism economic development situation of the Compact Tourism Economic Zone (2009-2015).
Year
Domestic tourists (10,000 person-times) Earnings from domestic tourism (100 million yuan) international tourism (100 million USD) Foreign exchange earnings from
Value Percentage of the three provinces (%) Value Percentage of the three provinces (%) Value Percentage of the three provinces (%)
2009 13716.31 29.53 1403.97 31.86 61.262 54.64
2010 16614.63 21.78 1727.60 30.11 72.871 51.97
2011 19228.16 26.22 2139.21 28.22 85.743 53.97
2012 22082.96 24.97 2571.27 26.96 99.771 56.20
2013 25800.41 24.96 3042.13 27.06 107.231 58.54
2014 27597.49 23.53 3506.16 25.87 109.64 57.36
DOI: 10.4236/oalib.1104045 9 Open Access Library Journal Qingyuan into the development of Urban Agglomeration. This can make tour-ism economic development of the Compact Tourtour-ism Economic Zone along Wuhan-Guangzhou HSR more efficient.
3.3. Economic-Social-Tourism Analysis of the Radiant Tourism
Economic Zone
The Radiant Tourism Economic Zone covers an area of 30.89 × 10⁴ km2, which
is 53.49% of the total area of Hubei Province, Hunan province and Guangdong province. From Table 5, it can be seen that absolute values of GDP, Residents Population, Per Capita GDP, Gross Industrial Output Value, Business Volume of Postal and Telecommunication Services have increased in different degrees, but their proportion in the three provinces has declined. The absolute value of urbanization and its proportion in the three provinces have shown a slight downward trend. Gross Industrial Output Value is increasing rapidly, its pro-portion in the three provinces increased from 15.50% to 21.38% because of un-dertaking industries of the core cities along HSR and the coastal cities. The pro-portion of social and economic indicators except Gross Industrial Output Value in the Radiant Tourism Economic Zone is declining in the three provinces.
After 5 years aggregation and diffusion of Wuhan-Guangzhou HSR, the aver-age annual growth rate of the three indicators such as Domestic Tourists, Earn-ings from Domestic Tourism, Foreign Exchange EarnEarn-ings from International Tourism in the Radiant Tourism Economic Zone was 31.26%, 26.47% and 11.36% respectively, the increasing degree is obvious. The proportion of the above three indicators in the three provinces has increased to some extent, but remains low level, especially inbound tourism. We should further strengthen the access of the Radiant Tourism Economic Zone, speed up the pace of urbaniza-tion and enhance the construcurbaniza-tion of tourist recepurbaniza-tion facilities (Table 6).
4. Conclusion
[image:9.595.58.539.570.728.2]Following the Point-Axis Development Theory, Tourism Economic Zone along Wuhan-Guangzhou HSR takes Wuhan-Guangzhou HSR as the development
Table 5. The social economic development situation of the Radiant Tourism Economic Zone.
2009 2015
Value Percentage of the three provinces (%) Value Percentage of the three provinces (%)
GDP (100 million yuan) 12724 19.43 22630 17.24
Residents population (10,000 persons ) 9214 41.39 9274.15 39.37
Per capita GDP (yuan) 13810 −15619 24402 −31328
Gross industrial output value (100 million yuan) 15089 15.50 44187 21.38
Business volume of Postal and telecommunication
services (100 million yuan) 1458 25.73 1484.6 23.70
DOI: 10.4236/oalib.1104045 10 Open Access Library Journal
Table 6. The tourism economic development situation of the Radiant Tourism Economic Zone (2009-2015).
Year
Domestic tourists (10,000 person-times) Earnings from domestic tourism (100 million yuan) international tourism (100 million USD) Foreign exchange earnings from
Value three provinces (%) Percentage of the Value Percentage of the three provinces (%) Value Percentage of the three provinces (%)
2009 12955.80 27.89 1007.14 22.86 5.836 5.21
2010 33740.54 44.22 1360.13 23.71 7.687 5.48
2011 22183.22 30.25 1789.91 23.61 9.801 6.17
2012 28382.34 32.10 2464.11 25.84 11.019 6.21
2013 33060.61 31.98 2743.68 24.41 7.336 4.00
2014 38705.37 33.00 3763.78 27.77 10.959 5.73
2015 38652.21 29.61 3988.67 25.18 8.83 4.32
axis, and gradually becomes the agglomeration area of tourism economy and urban economy upgrading. Referring to benefit analysis of the tourism economy generated by the operation of Wuhan-Guangzhou HSR in the past 5 years, tour-ism economic benefits are obvious, the promotion of tourtour-ism economic strength is relatively large, interaction between cities is strengthened, the aggregation and diffusion of tourist flows are prominent in Tourism Economic Zone along han-Guangzhou HSR. On the basis of the regional development along Wu-han-Guangzhou HSR and quantitative analysis of the data, the spatial structure of Tourism Economic Zone along Wuhan-Guangzhou HSR can be divided into the Core Tourism Economic Zone, the Compact Tourism Economic Zone and the Radiant Tourism Economic Zone. Tourism Economic Zone along Wu-han-Guangzhou HSR takes the cities along WuWu-han-Guangzhou HSR as the core growth pole to drive tourism economic development in the Compact Tourism Economic Zone, to build tourism economic compact district, to further promote the tourism economic development of the radiation edge area, and to promote the tourism economic competitiveness of the Radiation Tourism Economic Zone.
References
[1] Pearce, D. (1995) Tourist Development: A Geographical Analysis. Longman Press, London, 1-25.
[2] Huang, A.-L. (2011) Effects of High Speed Railway on Regional Tourism Develop-ment: Case of High Speed Railway between Wuhan and Guangzhou. East China Economic Management, 25, 47-49.
[3] Xiao, Y.-F., Zhang, Q., Cao, X.-N., et al. (2013) The Impact of Wuhan-Guangzhou High-Speed Railway on the Development of Hunan Producer Services. Economic Geography, 33, 103-107.
[4] Wang, D.-G., Chen, T., Lu, L., et al. (2015) Mechanism and HSR Effect of Spatial Structure of Regional Tourist Flow: Case Study of Beijing-Shanghai HSR in China.
Acta Geographical Sinica, 70, 214-233.
DOI: 10.4236/oalib.1104045 11 Open Access Library Journal
along the Wuguang High Speed Railway in Hunan. Economic Research Guide, 12, 144-148.
[6] Yang, X. and Wang, Z.-F. (2014) Exploratory Analysis of Hunan Tourist Flow Ag-glomeration and Diffusion Based on Traffic Network. Areal Research and Devel-opment, 33, 96-100.
[7] Mu, C.-L., Lu, L., Huang, J.-F., et al.(2015) Research on Yangtze River Delta Tourist Traffic Pattern and Linkage under the High-Speed Rail Network. Economic Geo-graphy, 35, 193-202.
[8] Yin, P. (2012) High-Speed Railway (HSR) and Establishment of New Pattern of Re-gional Tourism: A Case Study of the High-speed Railway between Zhengzhou and Xi’an. Tourism Tribune, 27, 47-53.
[9] Wang, D.G. (2013) The Impact of Wuhan-Guangzhou HSR on Regional Tourism Spatial Pattern in Hubei Province. Geographical Research, 32, 1555-1564.
[10] Yang, Z.-Y. and Lu, S. (2013) The Impacts of Traffic Improvements on Spatial Structure of Regional Tourism: Case of Southern Anhui. Scientia Geographica Sini-ca, 33, 806-814.