warwick.ac.uk/lib-publications
A Thesis Submitted for the Degree of PhD at the University of Warwick
Permanent WRAP URL:
http://wrap.warwick.ac.uk/106617
Copyright and reuse:
This thesis is made available online and is protected by original copyright.
Please scroll down to view the document itself.
Please refer to the repository record for this item for information to help you to cite it.
Our policy information is available from the repository home page.
Mixture Analysis by Metastable Mapping
by
Martin John Farncombe
Submitted to the University of Warwick in partial fulfilment of the degree of Doctor of Philosophy.
Department of Chemistry and Molecular Sciences University of Warwick
Covent ry CV A 7AL
'4*
To my parents, and Peter, and Alan.
Table of Contents
Table of contents lii
Acknowledgements vli
Dec la rat Ion vl i1
List of Abbreviations lx
List of Figures x
List of Tables xv
Abstract
1) Introduction 1
2) Methods of Mixture Analysis 3
2.1 The Need for Mixture Analysis 3
2.2 Alternatives to Mass Spectrometry 3
2.3 Basic Mass Spectrometry 4
2.3.1 Ion Production 5
2.3.2 Ion Separation 5
2.3.3 Ion Detection
2.A Mass Spectrometry in Mixture Analysis H 2.A.1 High Resolution Mass Spectrometry H 2.A.2 On-line Chromatographic Techniques 12
2.A.3 Soft Ionization Methods 13
2.5 Metastable and Collision-induced Decompositions 1®
2.5.1 Metastable Ions 1®
2.5.2 Collision-induced Decompositions 17
2.5.3 Uses for Mixture Analysis 1®
20
2.6 Various Methods of Scanning
20
2.6.1 Constant Parent Scans
21
r/. lv
2.6.3 The Constant Neutral Loss Scan 23 2.6.4 The Effects of Energy Release 23 2.7 Mass Spectrometry/Mass Spectrometry 24 2.7.1 Reversed Geometry Instruments 25 2.7.2 Triple Ouadrupole Instruments 25
2.7.3 Multisector Instruments 26
3) Theory of Metastable Mapping 27
3.1 Position of a Peak on the B,E' Plane 27
3.1.1 Three linked scans 29
3.1.1.1 The B/E Linked Scan 30 3.1.1.2 The BZ /E Linked Scan 31 3.1.1.3 The Constant Neutral 31
Loss Linked Scan
3.1.2 Forward Geometry instruments 32
3.1.3 Reversed Geometry instruments 52
3.2 The History of Metastable Mapping 34
4) Experimental Methods 36
4.1 The Method Used for This Work 36
4.2 Controlling the Mass Spectrometers 38 4.2.1 Manual control of the MS-30 38
4.2.2 Control of the MS-50 hy a Microcomputer 40
4.2.3 Control by the Data System 44
4.3 Data acquisition 45
4.4 Data processing 47
4.4.1 To give Metastable Maps 47
4.4.2 To give Linked Scans 51
5) Analysis of some Simple Maps 56
5.1 Methanol 56
5.2 Decan-l-o1 60
5.3 The Shape of Peaks on the B,E' Plane 64
5.3.1 Calculating the Peak Shape 64
5.3.2 The Peak Shape in Linked Scans 67
5.3.3 Determining the Kinetic Energy Release 68
6) Angle-resolved Mass Spectrometry 6.1 Introduction
6.2 The Z-deflection Method 6.3 Results
6.3.1 Argon 6.3.2 Methanol
6.3.3 Carbon Disulphide 6.4 Determining the Angle 6.5 Angular Resolution
6 . 6 Discussion
7) Results and Discussion 7.1 A Phosphonate Ester 7.2 Industrial Surfactants
7.2.1 Electron Ionization Maps 7.2.2 Chemical Ionization Maps 7.3 Some Proprietary Headache Cures 7.4 Phthalate Plasticizers
7.4.1 Analysis of a Phthalate Mixture
7.4.2 Distinguishing Between Phthalate Isomers 7.5 Peptide Sequencing
7.6 Negative ions
V 1
7.7 An Assessment of Metastable Mapping jjg
7.7.1 Resolution 1 1 9
7.7.2 Sensitivity 121
7.7.3 Artifact Peaks 122
7.8 Suggestions for Future Work 125
8) Factor Analysis 129
8.1 Introduction 129
8.2 Theory of Factor Analysis 130
8.2.1 Extracting the Factors 130
8.2.1.1 The Differences Between the Spectra 1 3 0
8.2.1.2 Extracting the Eigenvectors 133
8.2.1.3 Theory of Error 135
8.2.1. A Finding the Number of Factors I36
8.2.2 Factor rotation 138
8.2.2.1 Thurstone's Criteria 138
8.2.2.2 Orthogonal and Oblique Rotation 139
8.2.2.3 Target Transformation 140
8.2.2. A Empirical Rotation 141
8.3 Experiments and Results 143
8.3.1 Extracting the Factors 143
8.3.2 Determining the Number of Factors 144
8.3.3 Obtaining the Cofactors 147
8.3.A What is a Pure Peak? *48
8.3.5 Selecting the Pure Peaks *49
8.3.6 The Factor Analysis Program *50
8.3.7 Testing the Program *5*
8.3.7.1 Mass Spectral Data *5^
8.3.7.2 Carbon NMR Data *57
1^2 8.A Conclusion
Acknowledgeme nt s
I acknowledge the financial support of the Science and Engineering Research Council and T.C.T. Petrochemicals and Plastics Division under the Co-operative Awards in Science and Engineering (CASE) Award scheme. I also thank the Department of Chemistry and Molecular Sciences, University of Warwick, for a travel grant.
Most projects are team efforts: I should first like to thank the heads of the teams involved in this work - Professor Keith Jennings and Dr. Jim Scrivens - for their help and constant encouragement. I should thank the members of the Warwick group (Roger Greathead, John Headley, Colin Moore, Mol Passman, Inder Katyal, Jim laramee, Anil Shukla, David Brown, Willem Bouma etc.) and all those who helped me at Wilton (Norman Moore and his Merry Men, the programmers and Dr. Angus Hearmon). T also gratefully acknowledge the help of Alex Colburn, Ron Fathers, Eric Burgess and their respective staffs, and lain, Deena and Bill from the Computer Unit. I am indebted to Ian Gregor, Graham Cooks, Derek Nelson, Dr. David Hirst and Prof. John Beynon for useful discussions. I should also like to thank Urs Schlunegger, Paul Cload and David Hutchinson for providing samples, and Sensei Mike Brown for showing me a gentler way. Last, but by no means least, I should like to thank Dr. Rod Mason (il miglior fabbro) for always being there to tell me how I should have done it.
"In the pursuit of learning, every day something is acquired. In the pursuit of Tao, every day something is dropped."
vili
Dec la ra t i on
Parts of the work contained in this thesis have been published or accepted for publication. They
are:-G.A.Warburton, R .S .Stradling, M .J . Fa rncombe , R.S.Mason, Org.Mass Spectrom., 16 (1981) 507
M . J .Farncombe, R.S.Mason, K.R.Jennings, J.Scrivens, Int.J.Mass Spec.Ion Phys. , 44 ( 1982) 91
R. S.Mason, M . J .Farncombe, K.R .Jennings, J.Scrivens, Int.J.Mass Spec.Ion Phys., 48 (1983) 415
S . A.McLuckey, S.Verma, R.G.Cooks, M.J.Farncombe, R.S.Mason, K.R.Jennings, Int.J.Mass Spec.Ion Phys., 48 (1983) 423 R.S.Mason, M .J. Farncombe, K.R .Jennings, R.G.Cooks, Int.J.Mass Spec.Ion Phys., 43 (1982) 327
M .J.Farncombe, K . R .Jennings, R.S.Mason, U . P .Schlunegger, to be published in Org.Mass Spectrom.
J .Scrivens,R.A.Hearmon, M . J .Farncombe, to be published in Anal.Chem.
Parts of this work have also been presented at the 12th and 13th meetings of the British Mass Spectrometry Society (Cambridge 1981 and Coventry 1983), the 9th International Mass Spectrometry Conference (Vienna 1982).
List of Abbreviations
A Kinetic energy release amplification factor ARMS Angle-resolved mass spectrometry
R Magnetic sector field strength
CT Chemical Ionization
Cl D Collision-induced decomposition CNL Constant Neutral Loss linked scan d .c. Direct current
DIOP Di isooctylphthalate
DOP Dioctylphthalate
E Electric sector field strength
El Electron Ionization
FA Factor analysis
FAB Fast atom bombardment
GC Gas Chromatography
IE Imbedded Error
IND Indicator function
LC Liquid chromatography
MS/MS Mass Spectrometry/Mass Spectrometry NMR Nuclear Magnetic Resonance
PFK Perfluorokerosene
RE Real Error
r. f • Radio frequency
T Kinetic energy release
V Accelerating voltage
X
Number
2 . 1
3.1
4.1
4.2
4.3
4.4
4.5
4.6
List of Figures
Page Title
8 A diagram of a forward-geometry mass spectrometer
33 The positions of first and second field-free region metastable peaks on the B,E' plane, in
a) Forward-geometry mass spectrometers, and b) Reversed-geometry mass spectrometers.
39 A diagram of the MS-50 reference voltages
39 Control of the MS-50 reference voltages by the MINC-11
42 Circuit diagrams of the amplifiers used in between the MINC-11 and the MS-50
49 A plot of scan number vs. apparent mass vs. Intensity for decan-l-ol
50 A plot of parent ion mass vs. daughter ion mass vs. intensity for decan-l-ol
53 A comparison of B/F. linked scans for
m/z 1 1 2+ from decan-l-ol, showing
M a linked scan generated by conventional means
5 . 1 57 A metastable map of the nnimolecular
decompositions of methanol
5.2 59 A simulated B2/E linked scan for m/z 29+ f rom methanol
5.3 61 A simulated B/E linked scan for m/z 30+ from methanol
5-4 62 A simulated B/E linked scan for m/z 31+
f rom methanol
5.5
63 A metastable map of decan-l-ol
5 . 6 Simulated linked scans from decan-l-ol
a) a CNL scan for a neutral loss of 28
2 +
b) a B /E scan for m/z 56
6 . 1 73 A diagram showing the collision cell
and the deflector plates on the M S - 50
6.2 7 5 Energy loss spectra for scattered argon atoms taken at
a) V z . OV, 0 - 0° b) V - 140V, 0 - 0.75°
z
xll
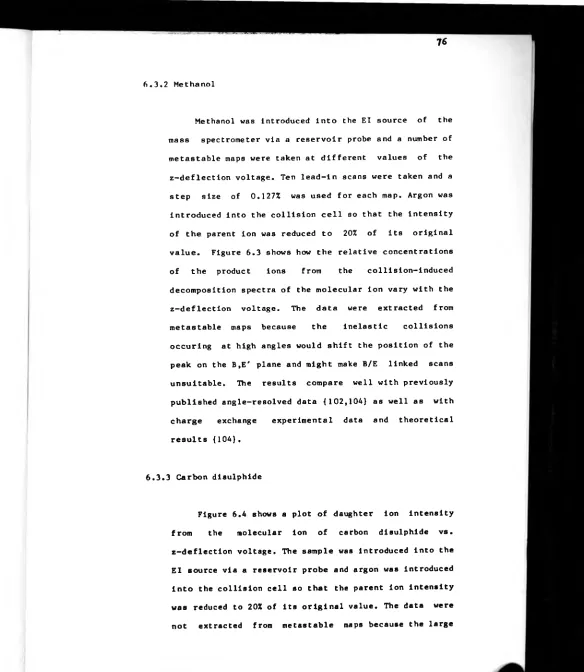
6.3 77 The variation of the collision-induced decomposition spectrum of the molecular ion of methanol with the z-deflection voltage.
6.4 78 The variation of the collision-induced decomposition spectrum of the molecular ion of carbon disulphide with the z-deflection voltage
6.5 82 The arrangement of the slits in the MS-50
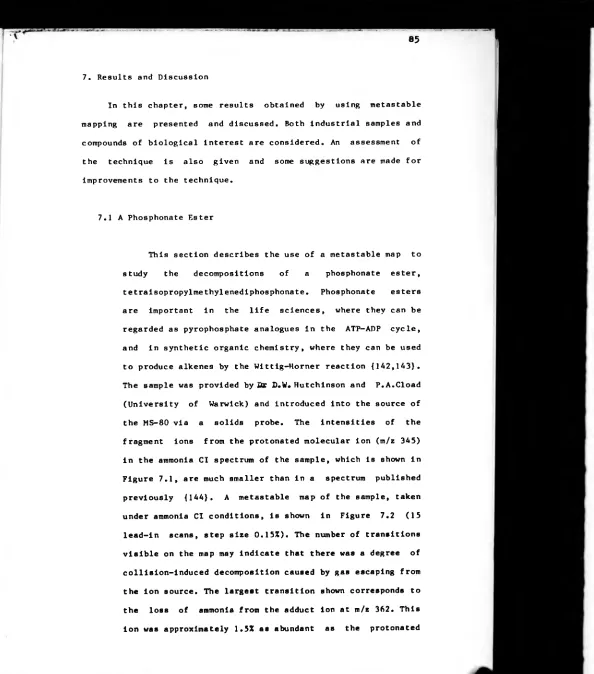
7.1 86 The ammonia Cl mass spectrum of Tetraisopropylmethylenediphosphonate
7.2
7.3
07 Part of a metastable map of
Te t raisopropylmethylenediphosphonate
89 Possible structures for some of the ions seen in Figure 7.1
< ’4 , . y y
«
7.4
7.5
7.6
7.7
7.«
92 Part of a metastable map of S35
9j Part of a metastable map of S35M
94 Part of a metastable map of S35DM
96 Part of a metastable map of caffeine
97 Part of a metastable map
■*
7.9
7.10
7.11
7.12
7.13
7.14
7.15
7.16
7.17
7.18
7.19
99 A metastable map of an "Anadtn" tablet, showing peaks due to the presence of caffeine
101 Part of a metastable map of a six-component phthalate mixture
2 +
102 A simulated B /E linked scan for m/z 149 from a six-component phthalate mixture
104 The ammonia Cl mass spectrum of DOP and DIOP
105 The structures of the phthalate isomers DOP and DI0P
106 Simulated B/E linked scans for m/z 391+ from DOP and DI0P
109 The structures of the peptides and the
masses of some of their possible fragment ions
110 The El mass spectra of the peptides
113 Part of a metastable map of Ac-Va1-1le-Gly-Leu-OMe
115 Part of a metastable map of Ac—(?lu(OMe) —Ala—Leu—OMe
x l V
7.20
8 . 1
8 . 2
126 Simulated B/E linked scans
using window parameters of a ) 1 .0 Da lton, and b) 0.1 Dalton,
showing an artifact peak at m/z f>9+
137 The RE, IE, X E , IND and Scree functions
156 Predicted and extracted mass spectra of a) Methylcyclohexane
Number
8 . 1
8 . 2
8.3
8.A
8.5
List of Tables
Pape Title
145 The number of factors Indicated by the results of some common tests.
153 Mass spectral data for Methylcyclohexane, methylbenzene and A-methylpentan-2-one obtained on a Balzers QMG 511
Mass spectral data for Methylcyclohexane, methylbenzene and 4-methylpentan-2-one obtained on a VG 7070
160 Carbon-13 NMR for Anisóle, Benzyl
alcohol and Benzyl acetate.
161 Carbon-13 NMR data for Benzil,
- < v i
Summa rv
1. Introduction
Mass spectrometry has for many years provided a sensitive tool for the determination of gas phase organic ion structures, but the technique has been less successful at identifying the components of mixtures because the signals from a minor species are often masked by fragment peaks for the major components. Methods such as chemical ionization, field desorption and mass spectrometry/mass spectrometry, as well as the traditional on-line chromatographic techniques, have all been used to overcome this problem. This thesis describes two methods of analysing mixtures which do not involve the prior separation of the components: the data for the entire mixture (or set of mixtures) are obtained and the components are identified from these. The first method, known as metastable mapping, involves the collection of some, or all, of the metastable or collision-induced decomposition products in a field-free region of a double-focussing mass spectrometer by a standard commercial data system. Software has been written which can process the data to simulate linked scans or two- or three-dimensional maps which can show how ions from the components of the sample fragmented.
2
2. Methods of Mixture Analysis
2.1 The Need for Mixture Analysis
It has been pointed out {1} that as we pollute the world we live in the need for mixture analysis becomes greater. Indeed, most of the work of the analytical chemist is concerned with the identification and quantification of the components of mixtures. For example, many industrial products will be multicomponent mixtures, by accident or design, and the price obtainable for them will often depend on the type and amount of the components present. Biological samples will almost certainly be mixtures, and here the rapid identification of trace impurities can be especially important.
2.2 Alternatives to Mass Spectrometry
Methods of mixture analysis can be divided into two general classes. Methods of the first type attempt to separate the mixture into its components and analyse them Individually and those of the second type attempt to extract information about the components from the results for the entire mixture. The techniques described in this thesis fall into this second category.
4
free from further contamination. Chromatographic techniques fail to do this, because the sample is deliberately contaminated with large amounts of stationary and mobile phases which must be subsequently removed. In addition, some components of a mixture might not be amenable to chromatographic separation because, for example, they are insoluble or involatile. Chromatographic techniques are cheap and sensitive, but they c a n offer little information about the structure of individual components unless they are coupled to expensive detectors such as N M R instruments, or mass or infra-red spectrometers. Chromatography can also be very slow and can require extensive sample work-up, and if the analysis needs to be very rapid one must turn to a technique such as mass spectrometry {2}.
Amongst the second class of techniques - those which a 11 emp t to ext ract i
the data for the c omp u t e r da ta base statistical methods known by the g eneric of a s tatist ical spectra of a set of i
2.3 Basic Mass Spectrometry
2.3.1 Ion Production
The most commonly-used means of producing ions in a mass spectrometer is electron ionization (El), where the ionization is caused by high-energy electrons, produced from a hot metal filament, colliding inelastically with a molecule in the gas phase. The electrons' energies are large when compared to the ionization energy of an organic molecule, which is usually about 10 eV , and the ion can be formed with a large amount of energy which may be channelled into bond cleavage and rearrangement reactions and give rise to fragment ions. The daughter ions so produced may contain enough internal energy to fragment further, thus producing the complex spectra typical of El {6}.
2.3.2 Ion Separation
It is assumed throughout this section that ions leaving the source have been accelerated by a potential of several thousand volts. The mass-analyser of a mass spectrometer has two purposes: it must be able to separate the ions according to their mass-to-charge ratios and must obtain the maximum resolved ion intensities. The first action is dispersive while the second is focussing.
path through such a field. The radius of the path followed is dependent on the mass and the velocity of the ion, and so the field disperses Ions according to their momenta. An electromagnet used as a mass disperser also has the property of bringing an angularly divergent beam to focus at a single point {7} and may thus be said to be direction— focussing.
An important property of a dispersing field is its ability to separate ions of similar mass, M and M+^M. A popular definition of the resolving power, known as the
1 0% valley definition, is the value of M/^M at which the height of the valley between two peaks of equal height is 1 0% of their intensity {1 2}.
The resolution of a magnetic sector is governed by the radius of the ions' path, the sizes of any slits at the entrance and exit of the sector, the aberrations in the ion optical system and the energy spread of the ion beam {7}. Of these, the only factors which can be altered without changing the geometry of the instrument are the slit dimensions and the energy spread of the incoming ion beam. Although the former improves resolution at the cost of beam intensity, the resolution can be helped considerably by placing an electric sector before or after the magnetic sector without major losses in sensitivity.
A radial electrostatic field between two
used as mass-analysers if they exploit some property of an ion which is dependent on its mass. For example, in an Ion Cyclotron Resonance spectrometer {9}, the ions absorb energy from a radio-frequency (r.f.) electric field perpendicular to a magnetic field when its frequency is equal to the cyclotron frequency of the ion (w). This is related to the strength of the magnetic field (B) and the mass-to-charge ratio (m/e) of the ion by w = eB/m and a mass spectrum may thus be generated by measuring the r.f. absorbance while scanning the magnetic field. Ion Cyclotron Resonance instruments have recently become popular because of the use of Fourier transform techniques and the advent of large computers, and instruments with very high mass resolution can now be obtained {1 0}.
I
Ions of different mass-to-charge ratios accelerated from an ion source will acquire the same kinetic energy but will have different velocities. This can be exploited by measuring the arrival time of the ions at the detector of a time-of-f1ight mass spectrometer {1 1}. Such machines have again enjoyed a recent revival in popularity because of their theoretically unlimited mass range.
10
mass-to-charge ratio will be transmitted by the field. Such instruments have a relatively low mass range and resolution when compared to sector instruments, but they are cheap and comparatively easy to use. They may also be readily controlled by computers and very fast field scan rates may be obtained.
2.3.3 Ion Detection
Perhaps the simplest way of detecting the ions is to use a Faraday cup, where the ions hit a metal 'bucket' and the resulting charge is amplified and recorded. The detector is sensitive only to the number and charges of the ions which reach it. The more sensitive electron multiplier has a series of curved plates which emit electrons when struck by a charged particle. An ion hitting the first plate will cause a cascade of electrons to reach the end of the detector. The electron multiplier has a much faster response than the Faraday cup, but its output is dependent o n the kinetic energy of the ions. Photomultipliers are similar to electron multipliers, but the ions strike a scintillator plate which emits photons, and these cause a cascade of electrons to be detected. These detectors are much less sensitive to the ions' kinetic ene rgy , however.
spectrometer. Most large data systems record the time, measured from the start of the scan, at which the ions are detected, and an acquired spectrum can be compared to that of a suitable reference compound and converted from a table of time-vs.-intensity to a mass spectrum. The calibrated scan can be stored on a magnetic medium such as a disk or tape and processed later {13}.
2.4 Mass Spectrometry in Mixture Analysis
A conventional mass spectrum consists of a large number of peaks, each of which is the result of a chemical reaction occurring somewhere in the mass spectrometer. If the sample is a mixture, the situation is more complicated, because it can be difficult to tell which of the low mass ions came from which, if any, of the higher mass ions. The molecular ion of one component may even be completely obscured by fragments from another. This section will attempt to review some of the techniques used to overcome these problems, and some other mass spectrometric techniques used for mixture analysis.
2.4.1 High-resolution Mass Spectrometry
12
the same nominal mass (isobaric ions) may often be distinguished by increasing the resolution of the instrument and thus separating the peaks. The technique cannot be used to separate isobaric peaks from isomers.
2.4.2 On-line Chromatographic Techniques
These techniques involve chromatographic separation of a mixture and the analysis of its components by mass spectrometry. Three separative techniques have been used: gas chromatography (GC), liquid chromatography (LC) and thin-layer chromatography (TLC). Of these, the one most commonly used is G C . The sample, which must be fairly volatile, is injected into a stream of carrier gas (usually helium) which is flowing over a liquid stationary phase suspended on a solid support or coated on the walls of the column. Good peak separation and sensitivity may be obtained, especially with capillary columns, although problems may be encountered at the interface between the chromatograph and the mass spectrometer {1 2} because of the pressure differences between the column and the mass spectrometer.
Compounds separated on thin polyamide layers have been introduced into an ion source via a standard probe and good spectra obtained {18} although each spot on the TLC plate had to be examined individually. Entire chromatograms have also been examined without further preparation by using secondary ion mass spectrometry (vide infra) although the sensitivity has been shown to be greater if the chromatogram is first transferred to a silver substrate {19}.
2.4.3 Soft Ionization Methods
Electron ionization is probably the most widely used form of ionization, but it does have limitations. Firstly, some polar compounds are too involatile to be studied. Secondly, the amount of energy imparted to the molecule during the ionization process means that a large amount of fragmentation results. A molecule may dissociate without giving rise to a molecular ion {2 0} even if low-energy electrons are used. The result is that El mass spectra often carry a great deal of the total ion current concentrated in the fragment ions, which can be confusing if the spectrum is that of a mixture. One way to overcome this is to use an method of ionization which does not supply much excess energy to the ion. Perhaps the best known form of 'soft' ionization is chemical ionization (Cl) {21}.
Consider, for example, an ion source containing a
14
partial pressure of the sample. Most of the ions generated by electron bombardment will be those from methane, some of which will act as Bronsted acids and will protonate the sample molecules: for example,
CH + + M —» Mll+ + CH. .
5 4
The energy supplied to the sample molecule (M) during the reaction, which controls the degree of
fragmentation, is determined by the difference between the proton affinities of the sample and the conjugate base of the reagent gas (methane, in this case). The most widely used reagent gases are methane, isobutane and ammonia, although others have been used (23-25). The degree of fragmentation will thus be greater for a given molecule protonated by methane, which has a proton affinity of 530 kjmol than it will be for the same molecule protonated by ammonia (865 kjmol *). If the components of the mixture have widely differing proton affinities, it may be possible selectively to ionize one of them by choosing a suitable reagent gas. The reagent ion may also be captured: for example, adduct ions are common in ammonia Cl. Ions can be generated with precise amounts of energy by charge transfer processes, where the internal energy of the ion is determined by the difference between the ionization potential of the sample molecule and the recombination energy of the ionizing species (1 2).
ions {26}. If the sample has a positive electron affinity the technique can be an extremely fast process {27}. Negative ion Cl may also be used to form quasimolecular
sample ions: attachment of chloride ions to the sample molecule and the extraction of protons by (for example) hydroxide ions {26,28} are possible.
It is also possible to use electric fields to ionize molcules. Intense fields can be generated at metallic edges, points and wires, and they can induce electrons to tunnel out of the molecule. This technique is known as field ionization {29} and the resulting ion has very little excess internal energy. Consequently, molecular weight information can be obtained, but little structurally revealing fragmentation occurs. A related technique is that of field desorption {30}, where the sample is coated onto, and ionization occurs on, the surface of a wire covered in small carbon fibres. Molecules may be similarly desorbed by the use of Californium fission fragments {31}, lasers {32}, or by the bombardment of the sample with ions (secondary ion mass spectrometry {33,34}) or atoms (fast atom bombardment {35-37}).
16
2.5 Metastable and Collision-Induced Decompositions
2.5.1 Metastable Ions
Metastable ions are defined to undergo
unimolecular decompositions which occur after the parent ion has left the source and before it reaches the collector. Their existence can be predicted from the quasi-equilibrium theory {6} by considering the ions formed in the source to have a range of internal energies which can lead to decompositions a few microseconds after excitation: it will take an ion of m/z 100 approximately fifteen microseconds to reach the detector of an MS - 50 if it is accelerated by a potential of 8 kV. Such ions would have an internal energy range of 0.1 to 1 eV above decomposition threshold {6}. Ions formed with more energy would probably decompose in the source, and ions with energies below the decomposition threshold will reach the detector intact.
There are three field-free regions in a
explained by Hippie and Condon in 1946 {38}. The peaks *
will appear at an apparent mass, m , given by * 2 /
m = m2 'ra]
where m^ is the mass of the parent ion and m2 is the mass of the daughter ion. The peaks are broad because some of the internal energy of the fragmenting species is released as excess translational energy of the fragments leaving the daughter ions with a range of velocities which results in an apparent uncertainty in the momentum of the peak. The magnitude of this kinetic energy release is small - it is usually less than 1 eV - but the peaks observed have substantial spectral widths because the energy is released in the centre-of-mass coordinate system and the fragments are observed in the laboratory coordinate system. When converting from one system to the other, a large amplification factor, A, results {39}. For singly charged ions, this is given by
A 2 = 1 6 (eV/T).((m1-m2)m2)/mj2 .
It may be observed that the factor is inversely proportional to the magnitude of the energy release (T). Very small kinetic energy releases may thus be observed because they result in large amplification factors.
2.5.2 Collision-induced decompositions
If ions do not undergo unlmolecular dissociation it is possible to induce decomposition by supplying them with excess energy by a process known as
18
usually located at, or close to, a focal point the ions will undergo collisions which convert some of their translational energy to internal energy. If the ions have energies of several thousand electronvolts, glancing collisions are sufficent to change their internal energy by up to 10 e V , but if they are moving more slowly, for example, in a quadrupole mass spectrometer, then 'head-on' collisions are required for activation and the fragments must be gathered together by an electric field {40}. For high-energy ions, very little energy is transferred to the target molecule, and thus the amount of translational energy lost by the ion will be approximately equal to the amount of internal energy it gains. The change of velocity of the ions results in a shift in the centre of the resulting peak from what would be expected for a metastable transition, and this shift can be used to determine the amount of energy deposited in the ion during the collision {6}.
ions have been col 1Islonally activated than from those which undergo metastable decompositions. The range of energies deposited in an ion by a collision Is similar to that deposited by an Impacting electron, and CID spectra are similar to those produced In the source under electron ionization conditions, and can be compared to libraries of El spectra. Because the ion has more energy available to it after collisional activation, more internal energy may be released as translational energy and so the velocity spread of the daughter ions after the fragmentation may be larger and thus broaden the peak, because the activation of the ion by collision is much faster than a bond vibration. CID may be regarded as a two-stage process: the activation of the ion followed by its unimolecular decomposition.
2.5.3 Uses for Mixture Analysis
In a mass spectrometer of Nier-Johnson geometry, the products of decompositions in the first field-free region would not normally be observed because the electric sector would filter them out. The product of a second field-free region decomposition will be observed in the normal mass spectrum as a broad peak. The products of decompositions in the third field— free region cannot be distinguished from their parent ions unless a special detector is used {A 1} .
20
third field-free regions, but ions may be mass-selected by the magnetic sector and their second field-free region decomposition products may be examined by altering the electric sector field.
Metastable and collision-induced decompositions are useful for mixture analysis because the means of detecting their products allow access to both the parent ion mass and the daughter ion mass. For a first field-free region decomposition in a forward-geometry mass spectrometer the ratio by which the electric sector field must be decreased to allow the daughter ion to pass through and the apparent mass at which it appears after traversing the magnetic field are both dependent on these masses.
2.6 Various Methods of Scanning
There are three participants in the unimolecular decomposition of an ion: the parent ion, the daughter ion and the neutral fragment. This section studies ways in which one of these may be regarded as constant during a series of decompositions and the other two studied.
2.6.1 Constant Parent Scans
magnetic sector may be used to select Ions of a certain mass and their second field-free region metastable or collision-induced decompositions may be studied by scanning the electric sector field {42}. The observed peaks arise from the collection of the daughter ions and are broadened by the release of internal energy during the decomposition. Such a scan has been called {43} a Mass-analysed Ion Kinetic Energy scan. The MIKE scan will be further discussed in section 2.7.1
It has been shown {44,45} that if the magnetic sector field (B) and the electric sector field (E) are scanned such that the ratio B/E remains constant then the daughter ions which are detected all arise from a selected parent ion. This scan is discussed further in section 3.1.1.1.
It is also possible to achieve the same result by scanning the accelerating (V) and electric sector (E)
2
22
2.6.2 Constant Daughter Scans
The methods of scanning discussed here allow the masses of all of the parent ions of a given daughter ion to be deduced. If the magnetic field is adjusted to transmit a specific daughter ion from decompositions in the source, the parent ions of decompositions which give that ion in the first field-free region can be detected by raising the kinetic energy of the parent ions - i.e. by increasing the accelerating voltage {48-50}. Again, the mass range is limited by the performance of the instrument when the accelerating voltage is changed. The peaks observed in the spectrum are broadened by the release of internal energy during the decompostion.
Similar results may be obtained without the limitations on the mass range by a scan of the magnetic
2
and electric sector fields such that the ratio B /E remains constant {51}. The peaks observed are again broad. This scan is discussed further in section 3.1.1.2.
A spectrum of all the ions which decompose to give a certain ion in the second field-free region of a reversed geometry mass spectrometer can be obtained from
o
2.6.3 The Constant Neutral Loss Scan
A scan in which the peaks detected are all due to decompositions in which a neutral fragment of constant mass is lost has been performed {54,55}. The magnetic and electric sector fields are scanned such that the
2 2
ratio B /E (1-E) remains constant. Another form of this scan has been suggested {56}, but it seems to offer little advantage over the previous one. The peaks in a constant neutral loss (CNL) linked scan are fairly narrow.
2.6.4 The Effects of Energy Release
24
If more than one field is being scanned
simultaneously, the width of the peaks depends on the velocity discrimination of the combination of the fields used. The deflection of an ion in a magnetic sector is dependent on its momentum, and thus its velocity, whereas its behaviour in the other two fields is related to its kinetic energy, and thus to the square of its velocity. If the two parameters in the linked scan do no t have the same velocity dependence, only ions of a certain velocity will be transmitted and the peak will be sharp. If their velocity dependence is the same, however, the full range of velocities will be transmitted and the peak will be broad. Broad peaks from metastable or collision-induced decompositions will thus
2
be observed in the B /E linked scan and in normal mass spectra, accelerating voltage and MIKE spectra. This is discussed further in section 5.3.
The shape of a metastable peak in the normal mass spectrum can be altered by improving the mass and energy resolution of the mass spectrometer {57}. The magnitude of the kinetic energy release can also be calculated from the width of the peak in such a scan {39,58}.
2.7 Mass Spectrometry/Mass Spectrometry
role of the first mass analyser has been likened to that of a gas or liquid chromatograph in that it can separate out single components of a mixture for analysis {59}. The use of such instruments has been extensively reviewed {1,40,59-62}. Such techniques require the use of mass spectrometers with geometries other than the Nier-Johnson.
2.7.1 Reversed Geometry Instruments
The simplest, and perhaps the most popular, type of MS/MS instrument is the reversed geometry mass spectrometer, in which the magnetic sector precedes the electric sector. The peaks observed in a MIKE spectrum are broad due to the release of internal energy, and this 'can seriously limit the resolution of the spectrum' {62}, especially when collision-induced decompositions are being studied, where more internal energy is available for conversion into translational energy of the fragments. Such instruments can also achieve very good resolution for ions formed in the source {42,43,63}.
2.7.2 Triple Quadrupole Instruments
26
computer control. Unit resolution can be obtained from both mass spectrometers.
2.7.3 Multisector Instruments
In Instruments where an electric sector follows a mass spectrometer of forward geometry, MIKE spectra of ions selected at high mass resolution can be obtained {69-73}. Instruments have been constructed which have four sectors, which can theoretically achieve both high parent ion and daughter ion resolution {74,75}.
3. Theory of the Metastable Map
After every metastable or collision-induced decomposition the kinetic energy and momentum of the parent ion will be partitioned between the daughter ion and the neutral fragment. The daughter ion so produced may have to pass through kinetic energy or momentum filters, depending o n where the decomposition occurs, and the resulting peak may not be observed in the same way as those arising from decompostions occurring in the ion source. These differences in observation methods may be used to determine uniquely the masses of both the parent an d daughter ions in a transition. This chapter attempts to explain the theoretical background to the metastable map and three of the linked scans. The phrase 'metastable map' is used to refer to a set of peaks which represent the products of unimolecular or collision-induced decompositions displayed either as a plot of the magnetic field strength against the electric sector field strength or as a plot of parent ion mass vs. daughter ion mass.
3.1 Position of a Peak on the B,E' Plane
When an ion enters the radial electric field present in the electric sector of a mass spectrometer, it experiences a force perpendicular to its direction of motion and follows a uniform circular path (assuming that it passes equidistant between the sector plates). The force on the ion is defined by F * e.E where e is the ion's charge and E is the field strength (77). The ion undergoes a centripetal acceleration, and we may thus write
m ]Vj^/r - Eje
f
f26
or - 2V/r
because Ve = (l/2)nijVj
where Ej is the field between the sector plates, nij and Vj are the ion's mass and velocity, V is the accelerating potential and r is the radius of the electric sector. The deflection of the ion is thus dependent on its kinetic energy. If a daughter ion from a decomposition in the first field-free region is to pass through the electric sector, the sector field must be reduced from the value required to transmit the parent ion, E j , to a lower value, , given by
E2 “
thus E' = E2/Ej = ra2/m1
Ions passing through a uniform magnetic field experience a force given by F - Bev perpendicular to their direction of motion, where B is the field strength. Again, the path they follow will be circular, and thus
2
Bev - m iv i /R or BeR “ m iv i
where R is the radius of the ions' path. The magnetic sector will thus act as a momentum filter. By considering the kinetic energy gained by the ions during acceleration, and by eliminating their velocity, it can be seen that
as Ve ■ (l/2)mjVj^
and BeR - m iv i
Thus 2Vemj - B2R2e2
or trij/e - B2R2/2V
This equation is only true for ions formed in the source. If an ion decomposes after it has been accelerated, its momentum will be partitioned between the fragments In the
ratio of their masses, and a daughter ion, m2» will not be observed at the same value of B as that required for the parent ion. If these daughter ions are transmitted at a
and if the mass of a hypothetical ion formed in the source *
and collected at this same field strength is m , then, by equating the momenta of the ions,
It is at this apparent mass that the peak will be observed.
It is thus possible to determine where the peaks arising from transitions in the various field-free regions of a double-focussing mass spectrometer will fall on a plane described by B (the magnetic field) and E (the electric field) by considering what combinations of electric and magnetic sectors the daughter ions must pass through before they are collected.
3.1.1 Three Linked Scans
This section considers in more detail the three linked scans which can be used on Instruments of both geometries and which are simulated by the programs described later. All of these scans detect the daughter ions from decompositions in the first field-free region,
•k
field strength B , such that n^Vj = B eR
Thus
* *? 2
m /e - B R /2V * *2 2 2 2m eV = B e R = m 2
* 2 2 2
2m (l/2)mjVj - m2 Vj
* 2 / m * /nij •
30
scan. Scan laws have been derived {55,78,79} in which the ratio is dependent on the value of the mass of the parent ion (m^), the daughter ion mass (m^), or the mass of the neutral fragment (m^). The peaks observed in such scans will then be due to decompositions which involve that particular ion or fragment.
3.1.1.1 The B/E Linked Scan
In this type of scan, the magnetic and electric field strengths, B and E, are altered simultaneously such that the ratio B/E is kept constant. If the instrument is adjusted so that the parent ion of a transition in the first field-free region is transmitted at values of the magnetic and electric field strengths Bj and Ej, and if these fields are then altered to allow the daughter ion to be
* *
detected at B-B and E-E , then the apparent mass, m*, at which the daughter ion will be observed is given by {78}
* * 2 2. 2 . m - B R /2V - m 2 /mj
* , , But since E' E /Ej
-m* = m j E ' 2
*2 2 * 2
So B R /2V - mj(E / E j T * , * i--- , Rearranging, B /E -
J
2Vmj/REjBecause this constant is not dependent on m2
scan. Scan laws have been derived {55,78,79} in which the ratio is dependent on the value of the mass of the parent ion (m^), the daughter ion mass (m2), or the mass of the neutral fragment (m^). The peaks observed in such scans will then be due to decompositions which involve that particular ion or fragment.
3.1.1.1 The B/E Linked Scan
In this type of scan, the magnetic and electric field strengths, B and E, are altered simultaneously such that the ratio B/E is kept constant. If the Instrument is adjusted so that the parent ion of a transition in the first field-free region is transmitted at values of the magnetic and electric field strengths B^ and Ej, and if these fields are then altered to allow the daughter ion to be
* *
detected at B-B and E-E , then the apparent mass, m*, at which the daughter ion will be observed is given by {78}
* *2 2. 2 .
m - B ^ir/2V - m 2i/m1 But since E' • E /E^ - n^/nij
* ,1
m ** m j E
So B*2R2/2V - m 1(E*/E1)2 Rearranging, B / E - ,/2Vmj/REj
Because this constant is not dependent on m2
31
3.1.1.2 The B /E Linked Scan
In this scan, the ratio of the electric field strength to the square of the magnetic field strength is kept constant. If the daughter ions from transitions in the source are transmitted at B=B2 and E=E2 , and if B and E are then decreased to
* *
detect the transitions at B=B and E»E , then
* 2,
m = m 2 /m i = m 2E where E' = E*/E2 = m 2/m
Thus B R /2V - m 2(E ,*2 2. *
*2 . * . 2
B V E = 2Vm2/R E 2
A scan where this ratio is kept constant will thus detect the products of all transitions in which the mass of the daughter ion is nij.
3.1.1.3 The Constant Neutral Loss Linked Scan
The peaks observed in this linked scan are due to decompositions which give rise to a neutral fragment of a specified mass. As before,
*
m * B R /2V - m 22/m *2 2 j “ nijE' 2 where E' - mj/mj « l-(m3/m j ) Thus - m ^ / (1 —E ')
and m* - m 3E'2/(l -E')
Rearranging, B*2 (1-E' )/E' 2 - 2m3V/R2
Thus a scari where B and E are varied so as to this ratio constant will only show peaks
neutral fragment of mass m^ was lost.
3.1.2 Forward Geometry Instruments
In mass spectrometers where the electric sector precedes the magnetic sector, the products of decompositions in the first field-free region must pass through both sectors, and so the resulting peak will not be seen at normal mass or E' values. Peaks which result from decompositions in the second field-free region, however, only need pass through the magnetic sector before collection, and so will be observed at the same E' value as those arising from decomposition in the source (i.e. E'-l). This is represented in Figure 3.1a, where it can be seen that only first field-free region decompositions give rise to peaks with values of E' of less than one, and that the three linked scans described above will all detect this transition.
3.1.3 Reversed Geometry Instruments
33
B
B
Figure 3.1 The positions of first and second field-free region metastable peaks on the b,E' plane, in
[image:51.639.124.619.35.657.2]region transitions and at same value of B as the parent ion: these peaks may be detected by a MIKF. scan or a
2
B F. linked scan {52}. Because there may be two peaks on the plane due to any given transition, linked scans designed to examine peaks from decompositions in the first field-free region might also detect peaks from second field-free region decompositions (and vice versa) thus giving rise to artifact peaks in the linked scans.
3.2 The History of Metastable Mapping
The phrase "metastable map" was first used in the literature in 1967 by Shannon et al. {80}, who produced a map using a mass spectrometer of Mattauch-Herzog geometry. On such an instrument, peaks over a wide mass range are detected simultaneously by a photoplate and the map was acquired by raising the accelerating potential. The experiment proved slow and the data difficult to extract from the photoplate, however.
Metastable ions have long been studied in
sector potential rapidly: this technique has also been used more recently {86-88}.
Lacey and Macdonald have acquired maps on forward- {89} and reversed-geometry {90} mass spectrometers and at high mass resolution {91}, and have studied the causes of artifact peaks on maps {92-94}. Their studies, however were of a more fundamental nature than those considered here, and were not primarily intended to produce maps of use in determining ion structures or the composition of mixtures.
4. Experimental Methods
4.1 The Method Used for this Work
37
a Krntos OS— 55 data system using standard software, or plotted on a chart recorder.
Three methods of mapping have been used previously for double-focussing mass
spectrometers:-1) Repetitively scan the magnetic field and slowly increase the accelerating voltage,
2) Scan the magnetic field slowly and repetitively scan the electric field downwards, or
3) Repetitively scan the magnetic field and slowly decrease the electric field.
Of these, the first is impracticable because the source conditions change during the scan, thus altering the sensitivity of the instrument. Both of the second and third methods have been used with some success, but the latter method was chosen
because:-1) The electric field is decreased slightly after each magnetic field scan, and so only one of the fields needs to be adjusted at a time,
2) The magnetic field scans on the mass spectrometers are reproducible and do not need to be controlled by a computer, and
3) The software needed to acquire mass-vs.-intensity data from the mass spectrometer during magnet scans was already written and tested.
A.2 Controlling the Mass Spectrometer
If the ion production and collection systems are ignored, the mass spectrometer may be regarded as having three components: an electric field which is used to accelerate the ions, another electric field which is used to energy-analyse them, and a magnetic field which is used to momentum-analyse them.
A.2.1 Manual Control of the MS-50
39
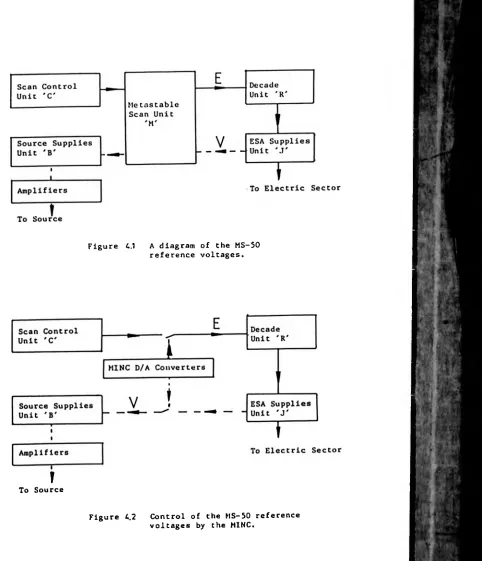
Figure 4.1 A diagram of the MS-50 reference voltages.
f
To Source
[image:57.633.139.621.79.640.2]V, E, or V/E scans, and the Decade Unit 'R' can be used to accurately measure mass by high-resolution peak matching.
4.2.2 Control of the MS - 50 by a microcomputer
The microcomputer used to control the reference voltages of the MS-50 was a MINC-11, manufactured by Digital Equipment Corporation (DEC). The MINC is based on an LSI-11 microprocessor functioning as a PDP-11/03 minicomputer. It is equipped with 32k words (lk=1024) of core memory, each of sixteen bits, two 5 Mbyte floppy disk drives, a DEC LA38 line printer, a DEC VT105 graphics terminal and a Hewlett-Packard 7225A graphics plotter. The operator can use either the R T - 11 operating system (which supports FORTRAN IV and a macroassembler language) or a special operating system which incorporates a BASIC intepreter.
The MINC has a number of modules which can be used to receive data or to control external devices attached to the central processor. It has a 1 MHz clock module, modules which can accept or transmit 16-bit digital words, four 12-bit digital-to-analog (D/A) converters, sixteen 12-bit analog-to-dlgital (A/D) converters and interfaces conforming to the IEEE-488 and RS-232 standards to communicate with peripheral devices.
It was decided to use the MINC to control the electric and accelerating fields, and to leave the
41
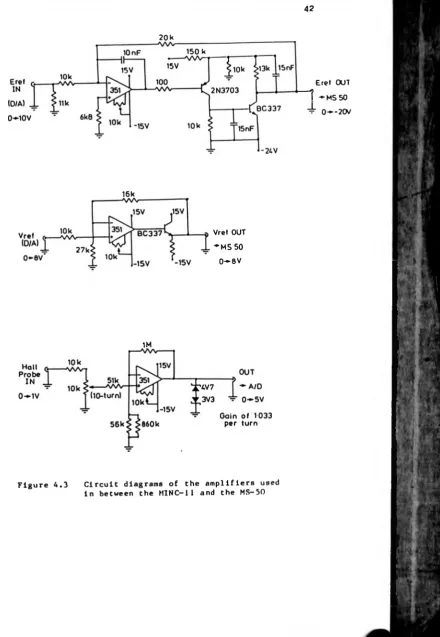
control of the magnetic field during the scan to the electronics of the MS-50. A BASIC program was written {96} which supplied the appropriate electric sector reference voltage via one of the D/A converters. As this is usually linked to the accelerating voltage reference, it was also necessary to supply that via another D/A converter. A diagram of the MINC/MS-50 connections are shown in Figure A.2. The D/A converters produce voltages in the range -5V to +5V or 0 to 10V. These had to be amplified to produce the correct voltages for the MS-50 (accelerating voltage reference: 0 to 8V; electric sector reference: 0 to 20V) by amplifiers whose circuits are shown in Figure A.3.
Because the data system was to be used to acquire the individual scans which compose the map, it was decided to use it to start the magnet scan by sending a logic pulse to the electronics of the MS-50. On receipt of this "start" pulse, the electronic circuits of the MS-50 decreased the magnetic field until a low mass limit was reached (preset by a dial on unit 'C'), when the mass spectrometer sent a "stopped" pulse back to the data system which caused it to stop acquiring data. This pulse was also sent to a logic input on the clock module of the MINC, which triggered the output of a slightly decreased electric sector reference voltage.
20 k
16k
Vret OUT - M S 50
0 - 8 V
1M
Figure 4.3 Circuit diagrams of the amplifiers used in between the M1NC— 11 and the MS-50
Eret OUT I - M S 50
[image:60.633.177.618.39.677.2]43
1. Generate the accelerating reference voltage. 2. Generate the electric sector reference voltage. 3. Read in the number of lead-in scans, the step
size and the initial value of E ' . 4. Wait for the operator to start the map.
5. Work out the electric sector voltage to be generated for the next scan. 6. On receipt of a "scan stopped" pulse
from the MS-50,
7. Send out the new electric sector reference voltage,
8. If the map is not finished, then go to 6. 9. Reset the original reference voltages and stop.
4.2.3 Control by the data system
45
system was used on both the MS-50 and the MS-80.
The accelerating voltage reference was generated from the d.c. supplies of the mass spectrometer by a variable potential divider. The electric sector reference voltage, which was generated by the D/A converter, and the accelerating voltage reference were fed directly to the appropriate circuit board in the Source Supplies Unit 'B' of the MS - 50. Changing between normal control of the reference voltage and control by the D/A converter was controlled by a switch installed on the console of on Source Supplies Unit 'C'. In the MS-80, the accelerating voltage reference and electric sector reference voltage were fed directly to the appropriate amplifiers. A switch on the rear of the MS-80 electric sector amplifier allowed the selection of externally-generated reference voltages.
The system was installed and found to have a much better electric sector resolution than the MINC (1 part in 65536) and proved much easier to use. It did not, however, allow the user to start at E' values of less than one, and any subsequent alteration of the programs will prove difficult as the KRATOS acquisition software is written in NOVA assembly language.
4.3 Data Acquisition
General Ltd.). The NOVA 2 has 32K words of core memory, each of sixteen bits, and it Is equipped with a TEKTRONIX 4010 graphics terminal with a COMPLOT 8600 screen copier, two 5 Mbyte hard disk drives and an interface to a mass spectrometer. The acquisition software and some of the processing software were supplied by KRATOS Ltd.
Before the map was acquired, it was usual to collect a few time-vs.-intensity spectra of a reference compound, such as perfluorokerosene, and to use one of these to perform a time-to-mass calibration. Peaks in subsequent scans could then be mass-assigned by the standard data acquisition program. Spectra taken at low resolution were usually processed prior to storage to ensure that the peaks were rounded up (or down) to the nearest integral mass by a process called Hites-Biemann correction {98}, but because the metastable ion peaks collected would not necessarily fall at integral masses, this could not be used.
47
4.4 Data Processing
Once the data have been collected, they must be displayed in a form that would help the user identify the composition of the sample. Although the data are stored in large mass files with an index to each {99}, it is convenient to regard them as being stored in separate disk files, each containing the data from one magnet scan. The scans are numbered consecutively, and If the step size (S) and the number of lead-in scans (L) are known, it is possible to compute the fractional electric sector value, E', at which the Nth scan appears, by;-
E' - 1 - S(N-L).
The daughter ion from a decomposition in the first field-free region will appear, if that ion passes through a
*
magnetic sector, at an apparent mass, m , which is given
by;-* 2,
m ” ®2 'm l
and it is the apparent mass of each peak which is stored in the files. The programs described here treat the data as if all the decompositions occur in the first field-free region and they would thus need adapting for use with reversed
geometry mass spectrometers.
4.4.1 To Give Metastable Maps
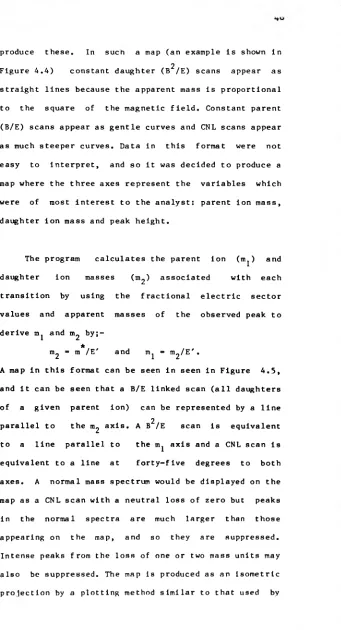
Figure 4.4) constant daughter (B /E) scans appear as straight lines because the apparent mass is proportional to the square of the magnetic field. Constant parent (B/E) scans appear as gentle curves and CNL scans appear as much steeper curves. Data in this format were not easy to interpret, and so it was decided to produce a map where the three axes represent the variables which were of most interest to the analyst: parent ion mass, daughter ion mass and peak, height.
The program calculates the parent ion (m^) and daughter ion masses (m2) associated with each transition by using the fractional electric sector values and apparent masses of the observed peak to derive m } and m2 by;-
*
m2 ” m /E' and m^ - n^/E'.
A map in this format can be seen in seen in Figure 4.5, and it can be seen that a B/E linked scan (all daughters of a given parent ion) can be represented by a line
2
[image:66.631.214.555.29.659.2]O u n
¡S M
51
GCMAP. The program requests the user to specify mass and intensity ranges for the axes and thc;n opens the disk files and reads the peaks' masses and intensities. The masses of the parent ions and daughter ions are then calculated, and if the peak falls within the specifed mass ranges and has a non-zero intensity, the intensity and masses are stored in a pair of arrays. Because of the limited core space in the NOVA a maximum of two thousand values can be stored in each of these arrays, and the user must ensure that the mass and intensity ranges which he selects do not produce more than this number of peaks to be stored.
The user specifies the horizontal and vertical angles at which he wishes to look at the map. To make the program compatible with GCMAP, the user is asked to choose the height-to-width ratio of the plot and the tangent of the angle between the daughter ion axis and the screen vertical. Using these, the program projects the positions of the peaks and axes from the three-dimensional map onto the two-dimensional screen and draws them.
4.4.2 To Give Linked Scans
writo it set of programs which could simulate the linked scans from data stored on disk.
The programs ask the user to specify which of the three linked scans he requires, and on what mass. The user is also asked to specify a 'window' parameter which is used to compensate for calibration errors caused by the absence of Hites-Biemann correction. Typical values of this parameter would lie between 0.1 and 0.5 Dalton. The disk files are then opened and the programs calculate the mass at which a peak appears in the linked scan,
using;-* 2
m - m.(E') for a B/E linked scan, - m^E' for a B2/E linked scan, and m = m (E')^/(l-E') for a CNL scan,
n
These formulae are derived in sections 3.1.1.1 to 3.1.1.3. If a peak with a mass difference of less than half the window width from the predicted apparent mass is found, it is assumed that that peak would appear in the linked scan and it is stored for output. A maximum of five hundred peaks can be stored, but this limit is rarely exceeded. Once all such peaks have been collected, the simulated scans may be produced by plotting parent ion mass vs. intensity for the B/E scan
5 2
write a set of programs which could simulate the linked scans from data stored on disk.
The programs ask the user to specify which of the three linked scans he requires, and on what mass. The user is also asked to specify a 'window' parameter which is used to compensate for calibration errors caused bv the absence of Hites-Bieaann correction. Typical values of this parameter would lie between 0.1 and 0.5 Oalton. The disk files are then opened and the programs calculate the mass at which a peak appears in the linked scan,
using;-* i
m * m.j(E')~ for a B^F linked scan, * m,E' for a B V E linked scan, and ra* - m (E') /(1-E') for a CNE scan,
n
These formulae are derived in sections 3.1.1.1 to 3.1.1.3. If a peak with a mass difference of less than half the window width from the predicted apparent mass is found, it is assumed that that peak would appear in the linked scan and it is stored for output. A maximum of five hundred peaks can be stored, but this limit is rarely exceeded. Once all such peaks have been collected, the simulated scans may be produced by plotting parent ion mass vs. intensity for the B/E scan
2
a) a linked scan simulated from the metastable map (see Fig 4.5), and
54
A.5 Computer-controlled Linked Scans
When only a few metastable (or collision-induced) decompositions are of interest, a metastable map can take too long to acquire, and so a set of programs was written to allow the MINC to control the three linked scans described in detail in the previous chapter. BASIC, which had been used for the metastable mapping control program, was found to be much too slow for these programs, and so FORTRAN IV was used.
With the accelerating voltage and electric sector references under control of the MINC, the mass spectrometer was tuned to the top of a peak of interest in the normal spectrum. This peak was the parent ion for the B/E
2
spectrum, the daughter ion for the B /E linked scan, or any peak of known mass for the CNL linked scan. The output of the Hall probe was then read by an A/D converter. The gain of the amplifier (the circuit of which is illustrated in Figure A.3) used to convert the output of the Hall probe (0 to IV) to the 5V maximum input of the A/D converter was variable from 1 to 10 to allow the full resolution of the A/D converter to be used for peaks of relatively low mass.
magnet scan could then be started by sending '1', which has the digital value 1, to the module. The lead carrying the **s top** pulse was connected to 'bit 1' of the module. The scan could thus be stopped by sending '2' , which has the binary value 1 0, to the module.
Once the scan was started, the Hall probe voltage was sampled and the appropriate electric sector voltage could then be calculated and output from knowledge of the original electric and magnetic field values. The Hall probe voltage was then sampled again and the process repeated. This cycle was performed at about 200 times per second for
o