Design
of
Reinforced Concrete Frames
of
Limited Ductility
A Thesis
Presented for the Degree
of
Doctor of Philosophy in Civil Engineering
at the
University of Canterbury
Christchurch
New Zealand
by
Soesianawati Watson
:>
Abstract
An experimental programme was carried out to investigate the flexural strength and ductil-ity.of reinforced concrete columns under simulated earthquake loading. The main variable examined was the quantity of transverse reinforcement for concrete confinement. The ex-perimental results were described and compared with theoretical studies. It was found that to achieve adequate ductility in columns, the current New Zealand concrete design code NZS3101:1982 equations for concrete confinement need to be refined. Using design charts for ductility, which were previously derived from a theory for cyclic moment-curvature be-haviour, a refined design equation to replace the current code equations is proposed.
Acknow ledgements
The research reported in this thesis was undertaken at the Department of Civil Engineering, University of Canterbury, under the overall guidance of its Head, Professor R. Park.
I wish to sincerely thank Prof. R. Park, the supervisor of this project, for his invaluable help and constant encouragement. The helpful advice given by Prof. T. Paulay, and the assistance given by Dr. A.J. Carr in the computer work are also gratefully acknowledged. Prof. M.J .N. Priestley is thanked for the fruitful discussions at the early stage of this project.
Thanks are extended to the technical staff of the Department of Civil Engineering, for their assistance and advice in the experimental programme. In particular, thanks are due to Messrs N.W. Prebble (now retired), G.E. Hill, G.H. Clarke, S. Pasa, R. Allen, P. Yellowance. Mr. L. Gardner is thanked for developing the photographs, and Mrs. V. Grey is thanked for her drafting assistance.
I am also grateful for the permission to use the computer. facilities in the Department of Electrical and Electronic Engineering, University of Canterbury, during the preparation of this thesis.
The financial assistance provided by the Ministry of Works and Development and the Uni-versity of Canterbury, and the materials supplied by the Pacific Steel Limited, Auckland and the Fletcher Steel Limited, Christchurch, are greatly appreciated.
otation
al,a2Ab
Ae
Ag
Ash
Asa;
Asy
Av
b be bw C GIl-d db de D -orMass and stiffness participation factors, respectively Area of reinforcing bar
Area of core concrete of column section Gross area of column section
Area of hoop bars and supplementary cross-tie confining reinforcement in one principal direction of column section
Total area of x-direction transverse bars Total area of y-direction transverse bars Area of effective hoop legs in resisting shear Overall width of rectangular column section
Width of concrete core, measured to the centre-line of perimeter hoop Width of web of concrete section
Concrete cover thickness, measured to the centre-line of perimeter hoop Basic seismic coefficient, given in DZ4203:1986 [39]
Effective depth of concrete section Diameter of reinforcing bar
Diameter of confined concrete core of circular column section, measured to the centre-line of spiral or circular hoop
Overall diameter of circular column section Dead load
Earthquake load
Young's modulus of elasticity for concrete
Young's modulus of elasticity for for steel in tension Young's modulus of elasticity for for steel in compression
Esee
Secant modulus of confined concrete at maximum strengthStrain hardening modulus for steel in tension
Eshe
Strain hardening modulus for steel in compressionf
Section type factorfe Concrete stress
f~ Specified concrete compressive strength feo
fl
ff
In-situ unconfined concrete compressive strength Transverse confining stress
fs1J.C
f:
fy fyc fyh FiFt
9 g' G hK
I or or orEffective transverse confining stress [4] Steel stress
Ultimate tensile strength of steel Ultimate compressive strength of steel Tensile strength of concrete
Yield strength of steel in tension Yield strength of steel in compression
Yield strength of transverse reinforcing steel Horizontal static load at level i
Horizontal static load at top storey Acceleration of gravity
Ratio of distance between the centres of the longitudinal bars in the extreme faces to the width of concrete core
Shear modulus
Overall height of rectangular column section Storey height
Dimension of concrete core of section measured to outside of peripheral hoop Overall beam depth
Concrete core dimension, measured to the centre-line of perimeter hoop Overall column depth
Lateral applied load
Lateral applied load, corresponding to MAGI Maximum experimental lateral load
Second moment of area of section
Effective second moment of area of section Second moment of area of gross section
Lever arm between the centroid of the tension reinforcement and the centre of the compression stress block of a reinforced concrete section
Strength enhancement factor for confined concrete Confinement effectiveness coefficient, based on area ratio
Confinement effectiveness coefficient, based on ratio of first moments of area Stiffness matrix
Length of cantilever column, measured from the point of maximum moment to point of contraflexure
Length of confined region of column
Length of cantilever column, measured from the face of central stub to point of con traflexure
Clear storey height
Equivalent plastic hinge length Live load
m
M
or
Mass per unit length
fy/0.85f~
Bending moment
or Structural material factor or Mass matrix
Theoretical flexural strength, calculated using the code [2] approach
Column bending moment at the centre-line of a beam, derived from the code specified lateral seismic loading
Design moment at critical section of column
Reduced design moment at critical section of column
Ideal flexural strength, defined as maximum moment reached before the curva-ture ductility factor
CPu/
CPy exceeds 5.0Maximum bending moment Pure bending moment
Moment calculated at the first yield of longitudinal reinforcement, or when the extreme compressive fibre strain reaches 0.002, whichever is smaller
Flexural strength from moment-axial force interaction diagram with applied axial load of 2Pb/3
Flexural strength from moment-axial force interaction diagram with applied axial load of Pb/3
Axial load at balance failure point
Axial compression load on column due to design gravity and seismic loading Ultimate axial force in compression
Ultimate axial force in tension
Design axial load of column due to earthquake load only
Ec/(Ec - Esec)
in Popovics' equationor Bilinear factor
R
Ratio of strain increase to stress increase at the peak strength of confined con-creteor Risk factor
Rr
Reduction factor for live loadRm
Bending moment reduction factor Axial force reduction factorClear spacing between spiral or hoop bars in which arching action of concrete develops
Centre-to-centre spacing of spiral or hoop sets Structural type factor
First moment of total core area of concrete First moment of effectively confined core area Time
v
Vc
Vcode
Vcol
Vi
Ideal shear stress carried by concrete Total horizontal seismic shear force at base
Shear resistance of concrete member provided by concrete mechanisms Column shear force derived from code specified seismic loading
Column design shear force
Vc+Vs
Total ideal shear strength of column
'Voe
Maximum earthqual(e induced beam shear force at the development of beam flexural overstrengthx Xejj
Yejj
z
(3,
,j~ ,jy ,jyh !::l !::ly !::lp orShear resistance of concrete member provided by shear reinforcement mecha-nIsms
Shear force associated with flexural overstrength of member
Clear transverse spacing between longitudinal bars in which arching action of concrete develops
Total seismic weight of structure
fe/ fee in Popovics' equation
Effective number of transverse bars with area
Ab
in x direction Effective number of transverse bars with areaAb
in y direction Zone factors' / de or s' / he
Modification factor for the cover thickness of square section to be used for the rectangular section, depends on the section side ratio b / h
be/he
Unit weight of concrete
Curvature ductility modification factor to allow for the influence of j~
Curvature ductility modification factor to allow for the influence of jy
Curvature ductility modification factor to allow for the influence of jyh
Lateral displacement of column
Lateral displacement of column at yield
Lateral displacement of column due to plastic deformations along the member
fe Concrete compressive strain
fce Strain at maximum confined strength of concrete j~e
fcmax - Maximum concrete compressive strain
feu Ultimate concrete compressive strain
feo
Compressive strain at maximum in-situ unconfined concrete strength j~o fsh - Steel strain at the commencement of strain hardening of steel in tension fshe Steel strain at the commencement of strain hardening of steel in compression fspall Compressive strain at which unconfined cover concrete spallsJ-l J-ln J-lr P
Pee
ps ps,eode Pt
or
=
Equivalent plastic hinge rotation
XeJJlhe
+
Yeff/beParameter in CEB [22] equation for concrete confinement Fraction of critical damping
Displacement ductility factor
Nominal displacement ductility factor Real displacement ductility factor
Area of longitudinal tension reinforcement divided by effective area of beam section
Volumetric ratio of longitudinal reinforcement in the confined core concrete Volumetric ratio of confining reinforcement
Volumetric ratio of confining reinforcement required by the code [2]
Area of longitudinal reinforcement divided by gross area of column section Ptm Mechanical reinforcing ratio
<Pmax
<ppeak
W
Volumetric ratio of tension reinforcement Strength reduction factor
Flexural overstrength factor Curvature
Yield curvature
Curvature calculated at the first yield of longitudinal tension steel, or when the extreme compressive fibre strain of concrete reaches 0.002, whichever is smaller Maximum curvature
Curvature at peak of moment-curvature hysteresis loops Dynamic magnification factor
Contents
1 INTRODUCTION 1
2 SUMMARY OF PREVIOUS STUDIES AND CODE PROVISIONS FOR CONFINING REINFORCEMENT IN THE POTENTIAL PLASTIC HINGE REGIONS OF COLUMNS 3 2.1 I n t r o d u c t i o n . . . 3 2.2 Previous Experimental Investigations of Strength and Ductility of Columns
at the University of Canterbury. . . .. 3 2.3 Code Provisions for Seismic Design of Confining Reinforcement in the
Poten-tial Plastic Hinge Regions of Columns . . . .. 5 2.3.1 G e n e r a l . . . .. . . 5 2.3.2 Basic Principles Concerning the Role of Confining Reinforcement. 8 2.3.3 ACI Building Code Requirements. . . 9 2.3.4 CEB Model Code Requirements for Seismic Design of Concrete
Struc-tures . . . .. 10 2.3.5 New Zealand Concrete Design Code NZS3101 Seismic Design Provisions 11 2.4 Comparison of the Code Provisions for Quantities of Confining Reinforcement
in the Potential Plastic Hinge Regions of Columns . . . .. 14
3 EXPERIMENTAL INVESTIGATION OF THE BEHAVIOUR OF SQUARE AND OCTAGONAL COLUMNS UNDER COMBINED FLEXURE AND
AXIAL LOADS 16
3.4 Instrumentation of Column Units. 23 3.5 Material Properties. . . 25 3.6 Comparison of the Quantities of Transverse Reinforcement in Column Units
with Requirements Specified by the Code and by Design Charts for Ductility 29 3.6.1 Introduction . . . 29 3.6.2 Comparison of the Requirements of the Code and the Design Charts
for Ductility with the Quantity of Transverse Reinforcement Provided in Column Units for Concrete Confinement . . . .. 29 3.6.3 Comparison of the Code Requirements with the Quantities of
Trans-verse Reinforcement Provided in Column Units for Maintaining Sta-bility of Compressed Longitudinal Bars . . . 30 3.6.4 Comparison of the Code Requirements with the Quantities of
Trans-verse Reinforcement Provided in Column Units for Shear 31 3.7 Testing Procedures for Column Units . .
3.8 Experimental Results and Observations
32 34 3.8.1 General Performance. 34 3.8.2 Hysteretic Behaviour. 35 3.8.3 Measured Curvature Distribution, Available Curvature Ductility
Fac-tor, Equivalent Plastic Hinge Length and Plastic Rotation . 55 3.8.4 Measured Strain Profiles . . . 69 3.9 Comparison of the Experimental Results with Theoretical Predictions 86 3.9.1 G e n e r a l . . . 86 3.9.2 Yield Curvature and Yield Displacement. 87 3.9.3 Lateral Load-Displacement Hysteresis Loops 88 3.9.4 Flexural Strength Enhancement Factor . . . 89 3.9.5 Maximum Plastic Rotation and Curvature, and Available Curvature
Ductility Factor . . . 90 3.9.6 Theoretical Monotonic Moment-Curvature Relations 92 3.10 Discussions of the Length of Confined Region of Column . . 95
3.10.1 New Zealand Code Recommended Length of Confined Regions of Columns. . . .. 95 3.10.2 Estimation of the Length of Confined Region Based on the
3.11 Concluding Remarks . . . .. 97
4 ANALYTICAL INVESTIGATION OF THE FLEXURAL DUCTILITY OF REINFORED CONCRETE COLUMNS LEADING TO A DESIGN EQUATION FOR THE QUANTITIES OF CONFINING
REINFORCE-MENT 99
4.1 Introduction . . . . 4.2 Parameters Investigated 4.3 Design Charts for Ductility
4.3.1 Background...
99 100 104 104 4.3.2 Assumptions and Definitions Used in the Design Charts for Ductility. 105 4.3.3 Presentation of the Design Charts for Ductility . . . 118 4.4 Application of the Design Charts and Derivation of Refined Design Equation 120
4.4.1 Applications of the Design Charts for Ductility and Comparisons with the NZS 3101:1982 Equations . . . 120 4.4.2 Derivation of Refined Design Equation for the Quantities of Confining
Reinforcement Required in Columns for Adequate Ductility . . . 130 4.4.3 Alternative Derivation of Refined Design Equation Using
Optimiza-tion Methods . . . 143 4.5 Verification of the Refined Design Equation
4.6 Concluding Remarks . . . .
5 COMPARISON OF THE INELASTIC DYNAMIC RESPONSE OF RE-INFORCED CONCRETE FRAMES OF LIMITED DUCTILITY AND
146 147
DUCTILITY 149
5.1 Introduction . . . . 5.2 Structural Layout and Description of the Buildings . 5.3 Equivalent Lateral Static Load Analysis
5.4 Design of Prototype Frames. 5.4.1 General... 5.4.2 Design of Ductile Frames
5.4.3 Design of Frames of Limited Ductility
5.5.2 Dynamic Analysis to Examine the Flexural Behaviour of Columns 163 5.5.3 Dynamic Analysis to Examine the Shear Behaviour of Columns. 163 5.6 Computer Modelling and Selected Ground Acceleration Record
5.6.1 Computer Program . . .
163 163 164 166 167 5.6.2 Input for Dynamic Analysis
5.6.3 Sources of Inaccuracy in Time History Analysis. 5.6.4 Selected Ground Acceleration Records . . . .
5.7 Inelastic Dynamic Response of Non-Capacity Designed Frames of Limited Ductility and Comparison with the Inelastic Dynamic Response of Capacity Designed Ductile Frames . . . 169 5.7.1 Inelastic Dynamic Response of Non-Capacity Designed Frames of
Lim-ited Ductility . . . . . . 169 5.7.2 Comparison of the Inelastic Dynamic Response of Non-Capacity
De-signed Frames of Limited Ductility and Capacity DeDe-signed Ductile Frames . . . 195 5.7.3 Comparison of Capacity Design and Non-Capacity Design Procedures 212 5.7.4 Suggested Design Steps for Non Capacity Designed Frames of Limited
Ductility. . . 212 5.8 Concluding Remarks 213
6 PROPOSED SEISMIC DESIGN PROVISIONS FOR FRAMES OF LIM-ITED DUCTILITY 215 6.1 Introduction . . . 215 6.2 The Existing New Zealand Codes For Moment-Resisting Frames of Limited
Ductility. . . 215 6.3 Comparison of New Zealand Codes for Ductile Frames and Frames of Limited
Ductility. . . 217 6.4 'Experimental Investigation of Columns and Beam-Column Joints of Limited
Ductility. . . . 217 6.4.1 General
6.4.2 Results from Beam-Column Joint Tests
6.5.3 Transverse Reinforcement in Beams and Columns
6.5.4 Limit for Number of Storeys . . . .
7 MAJOR CONCLUSIONS AND RECOMMENDATIONS FOR FUTURE 222 223
RESEARCH 224
7.1 Conclusions . . . .
7.2 Recommendations for Future Research.
224
Chapter
1
I TRODUCTION
The performance of structures under seismic excitations has been investigated widely in New Zealand and overseas. The basic criteria that have to be satisfied in designing an earthquake resistant structure are: to provide adequate stiffness and strength to ensure that structural damage can be prevented under moderate earthquakes, and to provide sufficient stiffness and adequate ductility to dissipate energy during major earthquakes so that collapse does not occur.
Adequate ductility in a reinforced concrete structure can be achieved by means of providing appropriate longitudinal reinforcement and sufficient transverse reinforcement in potential plastic hinge regions of structural members where the energy dissipation is expected to take place.
One role of transverse reinforcement in potential plastic hinge regions of columns is to provide confinement to compressed concrete in the core of the section.
Seismic codes of various countries have formulated recommendations for confining reinforce-ment, in terms of design equations for the quantities, and limitation of the spacings of confining reinforcement, length of confined regions etc. to ensure that the required ductility demand can be achieved. The development of code provisions together with previous studies regarding the role of confining reinforcement in columns is summarized in Chapter 2.
Some structures, however, due to the configuration of structural components or functional requirements, may possess strengths which are greater than needed for full ductility. The seismic performance of this type of structure, which need only limited ductility, is of in-terest to structural engineers in New Zealand. This was shown by the establishment of a study group by the Management Committee of the New Zealand National Society for Earth-quake Engineering (NZNSEE) in late 1985 to examine the behaviour of structures of limited ductility [1].
The main object of the NZNSEE study group of structures of limited ductility was to compile information to enable the engineers to:
Chapter
1
INTRODUC ION
The performance of structures under seismic excitations has been investigated widely in New Zealand and overseas. The basic criteria that have to be satisfied in designing an earthquake resistant structure are: to provide adequate stiffness and strength to ensure that structural damage can be prevented under moderate earthquakes, and to provide sufficient stiffness and adequate ductility to dissipate energy during major earthquakes so that collapse does not occur.
Adequate ductility in a reinforced concrete structure can be achieved by means of providing appropriate longitudinal reinforcement and sufficient transverse reinforcement in potential plastic hinge regions of structural members where the energy dissipation is expected to take place.
One role of transverse reinforcement in potential plastic hinge regions of columns is to provide confinement to compressed concrete in the core of the section.
Seismic codes of various countries have formulated recommendations for confining reinforce-ment, in terms of design equations for the quantities, and limitation of the spacings of confining reinforcement, length of confined regions etc. to ensure that the required ductility demand can be achieved. The development of code provisions together with previous studies regarding the role of confining reinforcement in columns is summarized in Chapter 2.
Some structures, however, due to the configuration of structural components or functional requirements, may possess strengths which are greater than needed for full ductility. The seismic performance of this type of structure, which need only limited ductility, is of in-terest t9 structural engineers in New Zealand. This was shown by the establishment of a study group by the Management Committee of the New Zealand National Society for Earth-quake Engineering (NZNSEE) in late 1985 to examine the behaviour of structures of limited ductility [1].
The main object of the NZNSEE study group of structures of limited ductility was to compile information to enable the engineers to:
• Evaluate existing structures that do not possess the ductility detailing required by modern codes nor possess adequate strength to respond elastically to design earthquake loads.
For this type of structure, less ductility demand can be expected and therefore the required quantities of confining reinforcement can be reduced.
One of the aims of the present study is to investigate the behaviour of columns under simulated earthquake loading, containing various quantities of confining reinforcement, par-ticularly columns with less confining reinforcement than that recommended by the New Zealand code [2]. The test results of this type of column are described and compared with recent theoretical studies [3,4] in Chapter 3.
The theoretical studies, confirmed by experimental results [5], indicate that the New Zealand code [2] design equations for concrete confinement need to be refined to achieve satisfactory performance of columns under seismic disturbances. Chapter 4 describes the theoretical predictions of flexural ductility of columns. A refined design equation for the quantities of confining reinforcement to replace the existing code equations is proposed.
To ensure that the energy dissipation occurs in the chosen structural members as expected, a capacity design approach has been developed in New Zealand [6]. In this approach, the chosen energy-dissipating members are suitably designed and detailed, and sufficient reserve strengths are given to the other members. Since a large ductility demand can be more easily achieved in beams than in columns, a strong column-weak beam concept was adopted. This means that columns must be stronger than beams to ensure that beam sidesway mecha-nisms will develop. In structures of limited ductility, column sidesway mechamecha-nisms may be acceptable, provided that the required ductility is not so great and the other brittle failure can be prevented. In such structures, the capacity design procedure becomes less important and a simplified design procedure can be applied. Chapter 5 compares the inelastic dynamic response of capacity designed ductile frames and non-capacity designed frames of limited ductility. A step-by-step design procedure for frames of limited ductility is outlined.
The existing code seismic requirements for ductile frames and frames of limited ductility are compared in Chapter 6. Some provisions to extend the existing seismic requirements of frames of limited ductility, as in Section 14 of the New Zealand code [2], are also proposed.
Chapter
2
SUMMARY OF P EVIOUS
STUDIES AND CODE
PROVISIONS FOR CO FINING
REINFORCEMENT IN THE
POTENTIAL PLASTIC HINGE
REGIONS OF COLUMNS
2.1
Introduction
This chapter reviews briefly the experimental studies of columns with solid sections subjected to simulated earthquake loading, undertaken at the University of Canterbury over the past ten years. The results of these studies, together with the other studies as summarized by Priestley and Park [13,14], have greatly improved the understanding of the behaviour of columns under seismic attacks, and led to an improvement in the seismic design provisions used in New Zealand.
The New Zealand code provisions [2], with regard to the requirements of confining reinforce-ment in the potential plastic hinge regions of columns, are also discussed and compared with the overseas provisions in this chapter.
2.2
Previous Experimental Investigations of Strength
and Ductility of Columns at the University of
Can-terbury
ductility of reinforced concrete columns, bridge piers and piles, containing different quantities and configurations of longitudinal and transverse reinforcement, under simulated earthquake loading.
The experimental research of the behaviour of columns with solid sections, was initiated by Gill
et
al. [7] and Potangaroaet
al. [8], who investigated the behaviour of squat columns with square and octagonal sections. Further tests of more slender columns were carried out by Anget
al. [9] and Zahnet
al. [4].The confining reinforcement in the columns tested, in the form of spirals or rectangular hoops, was generally designed to the requirements of versions of the New Zealand code [10,11,2]. The other variables investigated were the type of section, the level of axial com-pression, the aspect ratio L / D or L / h of columns, and the use of different grades of transverse reinforcement.
More recent experimental work was carried out by Soesianawati
et
al. [5] on the behaviour of square columns with low axial compression containing less quantities of confining rein-forcement than recommended by the New Zealand code [2]. The test results indicated the necessity of further investigation into the behaviour of columns, with large axial compres-sion. Tests of this type of column were then conducted. For convenience, the results of both studies are described together in Chapter 3.Gill
et
al.[7]
Four column units with 550 mm square cross section, and with an aspect ratio of L/h
=
2.2, were designed to the first draft DZ3101:1978 [10] requirements for confining reinforcement. The aim of the tests was to investigate the possible improvement of these provisions.Potangaroa
et
al.[8]
In this project, a total of five octagonal columns of 600 mm cross section were tested. The aim of the tests was similar to that of the investigation by Gill
et
al. [7]. Four units were designed in accordance with the DZ3101 [10] recommended quantities of confining reinforcement. The fifth column was designed using the Ministry of Works and Development requirements CDP 810/ A [12], for an axial load level of Pc = 0.35f~Ag. Due to the over conservatism of CDP 810/A, this unit was re-tested with an axial compression of Pc=
0.7f~Ag. For this level of axial load, the transverse reinforcement for this unit satisfied the DZ3101 recommended quantity. These squat columns have an aspect ratio of L/ D = 2.0.Ang
et
al.[9]
A further investigation was carried out to examine the ductility of columns with higher aspect ratio, designed as recommended by the revised draft DZ3101 [11]. Four column units, two with octagonal sections and two with square sections, were tested. The lateral dimension and the length of the units were 400 mm and 1600 mm, respectively, giving an aspect ratio of 4.
Zahn
et
al.[4]
strength transverse steel. It is known that the yield force of the confining reinforcement bar is the main parameter in determining the efficiency of confinement. The test, therefore examined the possibility of the replacement of larger quantities of Grade 275 steel with smaller quantities of Grade 380 steel.
Table 2.1 compares the properties of the column units tested [7,8,9,4]' with the current New Zealand code requirements [2]. It is evident that the quantities of confining reinforcement ranged from 0.83 to 2.0 times the code recommended quantity. A comparison with the quantities required by the design charts derived by Zahn
et
al. [4] to achieve an available<Pu/<py
=
20, is also made in Table 2.1.It is obvious, that the quantities provided were generally sufficient, to provide that level of ductility, except for three columns, namely Ang
et
al. Oct. 2, and Potangaroaet
al. Unit 3, and Zahnet
al. Oct.6, which contained ~ 80% of the design charts requirements. For some columns with low axial compression, such as those of Ang et al. Oct.1 and Zahn et al. Oct.5, the charts did not indicate the necessity for confining reinforcement.In general, the other code requirements for concrete confinement, and for preventing pre-mature buckling of longitudinal bars, were also satisfied.
The test results for the above columns are summarized in Table 2.2. A comparison with the theoretical predictions using the analytical procedures of Mander
et
al. [3] is also made. Itcan be seen that the theory predicts the experimental results reasonably well. The available curvature ductility in some columns was under-estimated by the theory, because of the larger confinement available in the units due to the central stub, which was not taken into account in the analysis. This resulted in more ductile behaviour, and therefore larger available curvature ductility. The moment enhancement above the code flexural strength predicted by an empirical equation [14] (see Chapter 3 for details) agreed well with the experimental values. Due to lack of information, some items are not listed in Table 2.2.
2.3
Code Provisions for Seismic Design of Confining
Reinforcement in the Potential Plastic Hinge
Re-gions of Columns
2.3.1 . General
Table 2.1: Properties of Column Units Tested by Previous Researchers at University of Canterbury
Transverse Reinforcement for Researcher Unit ~ r/>J~Ag /~ dia.-sh /yh Confinement An ti buckling
(MPa) (mm) (MPa) 1 2 3 4 5
Gill et al. [7] 1 0.26 23.1 R10-80 297 0.95 3.04 0.15 3.3 1.56
2 0.214 41.4 R12-75 316 0.92 3.08 0.14 3.1 2.38
3 0.42 21.4 R10-75 297 1.03 1.62 0.14 3.1 2.21
4 0.60 23.4 R12-62 294 1.32 1.30 0.11 2.6 3.14
Potangaroa 1 0.237 28.4 R10-75 300 0.83 1.88 0.13 3.1
-et al. [8] 3 0.543 26.6 R10-50 300 0.89 0.77 0.08 2.1
-4 0.387 32.9 HD10-70 423 0.87 0.97 0.12 2.9
-5 0.35 32.5 R16-55 280 2.00 2.75 0.09 2.3
-5b(6) 0.70 32.5 R16-55 280 1.36 0.95 0.09 2.3
-Ang et ill. [9] Oct.1 0.20 26.0 R6-40 308 1.00 - 0.1 2.5
-Oct.2 0.56 28.5 R10-55 280 1.04 0.85 0.14 3.4
-Sq.3 0.38 23.6 R12-100 320 1.47 1.41 0.25 6.3 6.7
Sq.4 0.21 25.0 R10-90 280 1.22 4.95 0.23 5.6 4.1
Zahn et al. [4] Oct.5 0.13 32.1 HD10-135 466 1.11
-
0.34 8.4-Oct.6 0.67 23.5 HD10-75 466 1.35 0.80 0.19 4.7
-Sq.7 0.23 28.0 HD10-117 466 1.26 4.0 0.29 7.3 6.6
Sq.8 0.42 37.2 HD10-92 466 0.93 1.12 0.23 5.8 6.6
Notes:
1. ratio of actual Ash to Ash required by New Zealand code [2]
2. ratio of actual Ash to ASh required by design charts [4] for curvature ductility factor
tpul tpy
=
203. ratio of Sh to b (New Zealand code [2] requires shlb ::; 0.2)
4. ratio of Sh to db (New Zealand code [2] requires shl db ::; 6)
5. ratio of available tie force to New Zealand code [2] requirement of 116 longitudinal bar
force at 100 mm centres, applicable only for square sections
6. Unit 5 was re-tested with high axial compression
7.
f~ was measured at time of testing of column unitsTable 2.2: Comparison of Experimental Results and Theoretical Predictions for Column Units Tested by Previous Researchers at University of Canterbury
Resea.rcher Uml <pv(rad m AtI ( mm MACI.(kNm) Mmax M It7T fPmax rad/m tpma:r <Pv
1 2 1 2 3 1 25 4 1 2 1 2
Gill el .. 1. (7) 1 0.007 0.0085 5.7 5.0 691 1.25 1.04 1.19 0.B70 0.120 21.0 14.1 2 0.007 0.0083 •. 2 •. 5 905 1.12 1.03 1.16 0.140 0.0913 20.0 11.0 3 0.007 0.0072 3.6 3.6 646 1.30 1.20 1.37 0.0980 0.0893 14.0 9.4
•
0.006 0.005 2.5 2.4 598 1.52 1.42 1.72 0.0960 0.0720 16.0 8.5 Po'anga.roa. 1 · 0.0061 5.2 5.6 723 1.23 1.10 1.17 0.13U 25.4 21.7 el a!. [8) 3 · O.OOH 3.5 2.8 672 1.44 1.36 1.59 · 0.0352 8.5 8.0 4 0.0052 4.0 3.9 803 1.30 1.20 1.32 · 0.0887 16.3 17.0 5 · 0.0061 3.5 3.1 807 1.34 1.21 1.28 · 0.0878 16.1 14'{ 5b(6) 0.0034 3.5 1.8 564 2.26 1.90 1.98 · 0.0507 14.9 Ang el aI. (9) Ocl.l 0.008~(7) 0.0093 7.5 9.6 216 1.23 1.04 1.15 0.2112 0.1776 24.~(8) 19.1 Ocl.2 0.0076 0.0064 6.5 5.3 215 1.44 1.32 1.63 0.0380 0.1286 50.0 15.8 Sq.3 0.0077 0.0102 6.6 7.1 269 1.24 1.16 1.31 0.1463 0.1540 19.0 15.1 Sq.4 0.0109 0.0113 9.3 8.8 258 1.17 1.05 1.16 0.2398 0.1413 22.0 12.5 Zahn el al. (4) Ocl.5 0.0094 0.0092 11.4 10.3 219 1.09 1.04 1.13 0.1555 · 16.9 Ocl.6 0.0083 0.0053 9.8 4.5 180 1.51 1.52 1.89 · 0.1002 · 18.9 Sq.7 0.0105 0.0118 11.8 9.0 291 1.19 1.07 1.17 · 0.1758 · 14.9 ~q.8 0.0086 0.0087 9.5 6.4 358 1.15 1.24 1.37 0.1296 · 14.9Notes:
1. <py) fly) Mmax and <pmax from experiment
2. <py) fly) Mmax and <pmax from cyclic moment-curvature theory
3. From code theoretical approach [2] using measured j~ and jy, and assuming <p=1.0
4. From empirical equation [14]
5. Maximum moment from experiment measured at the first cycle of J1, = 2 6. Re-tested with Pe = O. 7 j~Ag
7. <py was calculated theoretically
2.3.2
Basic Principles Concerning the Role of Confining
Rein-forcement
In early studies in 1928, Richart, Brandtzaeg, and Brown [15] found that the strength and ductility of concrete were significantly increased during triaxial compression loading, compared with uniaxial loading, because the lateral pressure confined the concrete and reduced the tendency for internal cracking and volume increase just prior to failure.
In practice, concrete is generally confined by transverse reinforcement in the form of spirals or hoops. Richart et aI. [16] found that the enhancement of strength and ductility of concrete confined by fluid pressure, was similar to that observed for concrete confined by transverse reinforcement.
ACI Committee 103 in 1933 [17] reported that the ultimate strength of concentrically loaded reinforced concrete columns confined by spirals could be expressed by a single formula as follows:
C
f~(l - Pee)+
fyPt+
kfyhPs (2.1)where P=ultimate concentric load on column, Ae=cross-sectional area of core concrete, C=a constant, found to be 0.85, f~=compressive strength of concrete cylinders, Pee=ratio of area of longitudinal reinforcement to A e, fy and fyh=yield strengths of longitudinal reinforcement and spirals, respectively, k= a constant, ranged between 1.5 to 2.5 with an average of 2.0, and ps=volumetric ratio of spirals to core concrete. Eq. 2.1 indicates that when spiral steel is used, transverse reinforcement is twice as efficient as longitudinal steel as far as increasing the load carrying capacity of the columns is concerned.
To achieve considerable enhancement of strength in columns, sufficient quantities of trans-verse reinforcement have to be provided. The increase in strength of concentrically loaded columns due to confining reinforcement should exceed the strength of cover concrete. This requirement is based on the assumption that the strength of confined columns after the spalling of concrete should be at least equal to the strength of unconfined columns before the concrete spalling, in order to prevent a sudden loss in load carrying capacity. If the strength ,of cover concrete is assumed to be 0.85f~, the minimum required spiral reinforce-ment is then given by:
2.3.3
ACI Building Code Requirements
Based on the above principle of maintaining the strength of concentrically loaded columns, the American Concrete Institute Building Code ACI 318-71 [18] recommended the quantities for spiral reinforcement in the potential plastic hinge regions of columns in seismic design as follows:
For columns with Pe
>
Oo4Pb,(2.3)
but not less than O.12f~/ fy. Tests indicated that considerable toughness and ductility was achieved in columns containing spirals as required by Eq. 2.3. The lower bound O.12f~/ fy
was applied to large columns with small cover thickness.
When Pe
<
Oo4Pb, columns were designed as flexural members.These requirements were maintained in ACI 318-77 [19] and ACI 318-83
[20].
Except that the limitation of axial load of Oo4Pb was replaced by O.lf~Ag in ACI 318-83. The following requirements for confining reinforcement in forms of rectangular hoops or cross ties were also specified:(204)
or
(2.5)
whichever is greater.
Also, since 1971, the ACI 318 requirements for the length of the confined potential plastic hinge regions have been the greater of the overall thickness h, where h is the larger sectional dimension for rectangular columns or the diameter of circular columns, one-sixth of the clear height of column, or 18 in. (457 mm). However, the requirements for the spacings of confining reinforcement have been changed. In addition to the requirement of a spacing not exceeding 4 in. (102 mm), the ACI 318-83 also specified that the transverse reinforcement shall be spaced at distances not exceeding one quarter of the minimum member dimension.
2.3.4
CEB Model Code Requirements for Seismic Design of
Con-crete Structures
General
The Comite Euro-International du Beton CEB Bulletin d'Information N° 165, 1985 [22] specifies a set of seismic design provisions, which is known as the Model Code for Seismic Design of Concrete Structures.
According to the code [22], structural systems may possess different ductility levels as follows: • Ductility Level I (DL I). This level of ductility is associated with relatively large design lateral forces, so that only a little inelastic response occurs even during the largest earthquake. Structures with ductility level I may be considered as elastic responding structures.
• Ductility Level II (DL II). This level of ductility will enable the structures to enter inelastic range under repeated cyclic loading, without premature brittle-type failure. Structures DL II may be considered as structures of limited ductility.
• Ductility Level III (DL III). For this level of ductility, special procedures for the evalu-ation of design actions, and for the proportioning and detailing of structural elements are to be adopted to ensure the development of selected mechanisms with large energy-dissipation capacities. Structures DL III may be considered as ductile structures.
With regard to the detailing of columns of structures DL II and DL III, the code specifies the following requirements. When the axial compression load Pe ~ O.lf~Ag, the columns
are considered as flexural members. When Pe
>
O.lf~Ag, the requirements described in thefollowing sections are applied.
Column Critical Regions
The critical regions of a column, which are denoted as potential plastic hinge regions in the New Zealand code [2], are considered to be the regions at each end of a column above and below connections over a length from the faces of the connection of not less than the larger of the longer column cross-section dimension in the case of a rectangular column, or the diameter of the section in the case of a circular column, one-sixth of the clear height of column, or 450 mm.
Quantities of Confining Reinforcement in the Column Critical Regions
minimum diameter of longitudinal bars, one half the least cross-sectional dimension of the section, or 200 mm. These quantities shall be continued throughout the length of the beam-column joint.
For structures DL III, the volumetric ratio of transverse reinforcement (spirals or hoops) shall not be less than the greater of:
Po (2.6)
Po (2.7)
The values of
Al
andA2
are given in Table 2.3, as a function of the axial compression loads.Table 2.3: Values of
Al
andA2
Pel
f~Ag 0.10 0.20 0.30 0040 0.50Al
0.05 0.06 0.07 0.08 0.09A2
0.18 0.22 0.26 0.30 0.34It is obvious, that the values of
Al
andA2
increase with the axial load levels, indicating that the higher the axial load, the more confinement is needed to confine the compressed concrete.For rectangular sections, the volumetric ratio ps is defined as
po (2.8)
The minimum diameter of spirals or hoops shall be 8 mm. However, more stringent re-quirements for the hoop spacings are given for structures of DL III. That is, the maximum spacings' shall not exceed the smaller of six times the minimum diameter of longitudinal bars, a quarter of the least cross-sectional dimension of section, or 150 mm.
2.3.5
New Zealand Concrete Design Code NZS3101 Seismic
De-sign Provisions
However, based on theoretical moment-curvature studies conducted by Park et al. [24] for rectangular columns, using the stress-strain model for confined concrete derived by Kent and Park [25], and by Park et al. [26] for circular columns, the quantities of confining re-inforcement in the potential plastic hinge regions specified by the ACI and SEAOC codes, were modified to account for the effect of axial compression in the columns.
For circular columns, it was required that
ps -
qff~
(0.375+
1.25f~
)yh c 9
(2.9)
where q = 0.12 or q - 0.45(Ag/ Ac - 1), whichever is greater, Pe
>
O.lf~Ag, and ps -4Ab/(Sh~The diameter of spiral or circular hoop bar was to be at least 10 mm, and the maximum centre-to-centre spacing of spirals or hoops was not to exceed the smaller of one-fifth of column diameter, six times the minimum diameter of longitudinal bars, or 125 mm.
For rectangular columns, it was required that
f~
(
Pe )ps - q-f 0.33
+
1.67 flAyh c 9
(2.10)
where q
=
0.12 or qAsh/(Shh")
0.3(Ag/ Ac - 1), whichever is greater, Pe
>
O.lf~Ag, and psThe minimum diameter and spacing of hoops was similar to that for spiral or circular hoop steel, except that the spacing of 125 mm was increased to 150 mm.
Comparing Eqs. 2.9 and 2.10, it is obvious that in a rectangular column, the required quantities of transverse reinforcement were more dependent on the axial load level than in a circular column. Due to their shape, spirals or circular hoops are capable of providing uniform confining pressure to concrete. This is not the case for rectangular hoops or cross-ties which because of their shape, can only apply confining pressure near the corners of the hoops arid the ends of the cross-ties, therefore the concrete is only confined effectively in those areas, resulting in smaller area of effectively confined concrete. When the axial load is high, the strength of columns is more dependent on the strength of confined concrete. The smaller area of effectively confined concrete results in less strength and ductility of such columns, and therefore larger quantities of confining reinforcement are required for rectangular columns.
achieved in square and circular columns, respectively. Moreover, at the end of the tests, the maximum inelastic deformation capacity of the columns was not fully reached, and the strength was still maintained, indicating that the columns could have reached much higher ductility factors than those available.
As a result of the above test results, the requirements for the quantities of confining rein-forcement were modified to give the same level of dependency on the axial compression for both circular and rectangular columns. Also, the length of the confined potential plastic hinge regions was modified according to the axial load levels, since when the axial load level increased, failure could possibly occur outside the confined region unless the confined region was long enough.
The volumetric ratio for spirals or circular hoops, and for rectangular hoops, in the potential plastic hinge region was then given in the second draft of the code [11] as
ps -
qff~
(0.5+
1.25f
:-
A e)
yh c 9
(2.11)
where q = 0.12 or q = 0.30k(Ag/Ac -1), whichever is greater, ps = 4Ab/(Sh4), and k = 1.5
for circular hoop arrangement, and ps = Ash/(Shh"), and k = 1.0 for rectangular hoop arrangement.
It is also required that Pe
<
<pO. 7 f~Ag or Pe<
<pO. 7 Po, where Po=ideal axial load compressive strength when the load is applied with zero eccentricity.The centre-to-centre spacing of both spirals and circular and rectangular hoops should not exceed the smaller of one-fifth of the least lateral dimension of the cross section, six longi-tudinal bar diameters, or 200 mm.
It is expected that columns with the quantities of confining reinforcement as given by Eq. 2.11 will be capable of reaching a curvature ductility factor
<Pu/
<py of at least 20, which should allow typical bridge piers or building columns in a storey to achieve a displacement ductility factor of at least 8 [21].The length of potential plastic hinge region is recommended as follows. When Pe
:s;
0.3f~Ag,not less than the larger column section, or where the moment exceeds 0.8 of the maximum moment at that end of the member. When Pe
>
0.3f~Ag, the length is increased by 50%.2.4
Comparison of the Code Provisions for Quantities
of Confining Reinforcement in the Potential
Plas-tic Hinge Regions of Columns
The code provisions discussed above indicated the necessity for confining reinforcement to provide adequate ductility in columns. They were initiated by the ACI building code, and followed by the New Zealand and CEB codes with some modifications, particularly with regards to the effects of axial compression in columns on the available ductility (see Ref. [27]).
Although the modifications made by the CEB code were not as obvious as those made by the New Zealand code, both provisions indicate that more confining reinforcement is necessary to maintain the strength and ductility of columns with large axial compression. Fig. 2.1 compares the quantities of confining reinforcement required by the codes for a typical column section.
0.15
0.10
0.05
S'~Y
~'L:Y
. / ACI-a3
o--~--~~~~--~~--~~
__
o
0.2
0.4
0.6
Pe
{l1
fcAg
Figure 2.1: Comparison of Code Quantities of Confining Reinforcement for a Column
The step change in the ACI requirements which occurs at Pe = O.lf~Ag, does not give a
rational amount of confining reinforcement needed when the axial load ratio is slightly less than O.lf~Ag.
Fig. 2.1 shows clearly that there is still considerable disagreement between the codes. The basic difference between the ACI and New Zealand codes arise because the ACI code pro-visions are based on preserving the concentric load capacity of columns whereas the New Zealand code provisions are based on attaining adequate curvature ductility capacity.
Chapter 3
EXPERIME TAL
INVESTIGATION OF THE
BEHAVIOUR OF SQUARE AND
OCTAGONAL COLUMNS UNDER
COMBINED FLEXURE AND
AXIAL LOADS
3.1
Introduction
The current New Zealand concrete design code [2] specifies the following equation for the quantity of confining reinforcement required in potential plastic hinge regions of reinforced concrete columns of ductile structures:
f~
(
5 Pe )Ps
=
q-j O.+
1.25 flAyh c 9
(3.1)
where q
=
0.12 or q=
0.30k(Ag/Ac -1), whichever is greater.For spirals or circular hoops, ps
=
4Ab/(Shd~ and k=
1.5, and for rectangular hoop rein-forcement with or without supplementary cross ties, ps = Ash/(Shh") and k = 1.0, whereSh is the centre-to-centre spacing of hoop sets, h" or d is the dimension of concrete core of section measured to the outside of perimeter hoop or spiral, Ag is the gross area of column cross section, Ac is the area of concrete core of section measured to outside of peripheral hoop or spiral, f~ is the concrete compressive strength, fyh is the yield strength of transverse
hoops, Pe is the axial compression load due to design gravity and seismic loading and ifJ is
the strength reduction factor.
As mentioned in Chapter 2, the equation was based on the ACI [19] and SEAOC [23] equation, with an additional term to include the axial compression as a variable. This mod-ification was resulted from theoretical and experimental studies carried out at the University of Canterbury [14], which showed that the level of axial compression in columns did affect the available ductility of the columns. Recent analytical studies [4] however, indicated that the above code equation might not be able to provide adequate ductility when the axial compression level is high, and therefore the equation may need to be made more dependent on the level of axial compression.
On the other hand, an experimental study carried out by Soesianawati
et aI.
[5] showed that only one-half of the quantity of confining reinforcement recommended by the code [2] is sufficient to provide adequate ductility in columns with low axial compression levels.In addition, significant tests have also been conducted in the United States. Johal
et ai. [31]
examined the effect of axial load, and the amount, type and details of transverse reinforce-ment, on the strength and ductility of columns subjected to simulated seismic loading. Ten units with axial compression loads of 0.2 to O.4f~Ag were tested. The results indicated that the flexural overstrength of columns, above the code calculated strengths increases with ax-ialload level, but that the ductility decreases substantially. Also, a reduction in the amount of transverse reinforcement results in a lower available ductility.
Fafitis and Shah [32] investigated the behaviour of confined columns subjected to monotonic flexure and constant axial compression. The confining reinforcement was designed to the ACI 318-77 [19] requirements. The axial load levels were varied from 0.25 to 0.8f~Ag. It was found that the degree of flexural overstrength depends on the axial load levels, the amount of confinement, the compressive strength of concrete and the shape of columns. It was also shown that the square columns exhibited higher flexural overstrength than the circular sections. However, the available ductility in the columns was not indicated.
Sheikh, Yeh and Menzies [33], and Yeh and Sheikh [34] tested fifteen column specimens sub-jected to concentric compressive loads, and sixteen column specimens subsub-jected to combined flexure and constant axial compression. One of the aims of this study was to investigate the effects of distribution and quantities of transverse reinforcement on the strength and ductility of columns. As expected, an increase in the amount of confining reinforcement significantly enhanced the strength and ductility of the columns. The effect of axial load levels on the behaviour of columns was also examined. Surprisingly, it was found that for some columns with high axial compression, the flexural strength of the columns did not even reach the theoretical strength calculated using the code approach for unconfined concrete.
It is evident, although several experimental investigations of the behaviour of columns un-der simulated seismic loading have been conducted in New Zealand and overseas, there is still insufficient information regarding the available ductility of columns with large axial compression. More experimental work is required to examine the behaviour of this type of column in order to verify the analytical prediction [4], concerning with the dependency of quantities of confining reinforcement on the level of axial compression.
construction and instrumentation of the column units, material properties used, and a brief explanation of the testing procedure. The experimental results are reported in the following form: General Performance, Hysteretic Behaviour, Measured Curvature Distribution, Avail-able Curvature Ductility Factor, Equivalent Plastic Hinge Length and Plastic Rotation, and Measured Strain Profile. A comparison with theoretical predictions is also made.
3.2
Design of Column Units
3.2.1
Background
In 1985, four square reinforced concrete columns with low axial compression, which contained smaller quantities of confining reinforcement than recommended by the code [2] were tested [28], under constant axial compression and cyclic flexure to simulate earthquake loading. The details of these units are listed in Table 3.1, and the cross sections and dimensions are shown in Figs. 3.1a and b.
Table 3.1: Properties of Column Units with Low Axial Compression
Transverse Reinforcement for Unit ~ <pf~Ag f~ dia.-sh fyh Confinement Antibuckling Shear
(MPa) (mm) (MPa) 1 2 3 4 5 6
1 0.1 46.5 R7-85 364 0.43 - 0.21 5.3 2.08 1.0
2 0.3 44 R8-78 360 0.46 1.12 0.20 4.9 2.93 2.01 3 0.3 44 R7-91 364 0.30 0.74 0.23 5.7 1.94 1.65 4 0.3 40 R6-94 255 0.17 0.41 0.24 5.9 0.97 1.34
Notes:
1. ratio of actual ps to ps required by code [2]
2. ratio of actual ps to ps required by design charts [4] for CPu/ cPy
=
20 3. ratio of Sh to b4. ratio of Sh to db
5. ratio of tie force to
l6
longitudinal bar force at 100 mm centres6. ratio of shear strength to design shear force
7.
f~ was measured at time of testing of column unitsThe results of these column tests are summarized as follows: Units 1 and 2, which contained 43% and 46% of the code [2] recommended quantity of confining reinforcement, and with axial load levels of 0.1 or 0.3f~Ag, respectively, achieved a displacement ductility factor of at least 8 without significant strength degradation. The longitudinal bars at the extreme fibre eventually fractured. Units 3 and 4, with 30% and 17% of the code recommended quantity of confining reinforcement, and with an axial load level of 0.3f~Ag, achieved displacement ductility factors of at least 6 and 4, respectively. Fracture of an octagonal hoop was ob-served at the end of testing Unit 3, and a failure of hoop anchorage followed by buckling of longitudinal bars terminated the test of Unit 4.
The current experimental work is a continuation of the above study [28]. In this project, the flexural strength and ductility of columns with moderate to high axial compression loads are investigated, so that the behaviour of columns over a greater range of axial load levels can be explored in more detail.
3.2.2
Description of the Additional Column Units
Seven column units 3.9 m high were designed and constructed. Five of the units (Units 5 to 9) were of square cross section, and the other two (Units 10 and 11) were of octagonal cross section. The cross sections and the dimensions of the columns, and the arrangement of longitudinal and transverse reinforcement in the columns are shown in Fig. 3.1. Because the specimens were approximately one half scale, the concrete cover to the transverse rein-forcement was made 13 mm whereas the New Zealand code [2] requires a minimum cover thickness of 25 mm for cast in situ beams and columns .
.E_--.
fH~~
POfentiol plastic hinge regions Pin E E8
!e8
'<:rE E
8
~ E E8
0),.,
fH
-L~_Pin
'-400mm Elevation,
(a)
wver= 13mm Cover = 13mm
-t=
G
EB
E
0 0
'-: " , I
~,,::I
I
371.mmI
1.00mm 1.00mm
Units 5 to 9 Units 10 & 11
(b)
Sections (c)
E E
0 0
[image:34.595.81.532.457.721.2]The critical plastic hinge regions of the columns where maximum moment occurs, and there-fore damage is expected, are the regions above and below the central stub (see Fig. 3.1).
For Units 5 and 6 with square cross section, the axial load level was 0.5f~Ag, and the transverse reinforcement was designed to be 4/9 and 2/9 times the quantities given by the code [2]. For Unit 10 with octagonal cross section, the axial load level was 0.5f~Ag, and the transverse reinforcement was designed to be one-half of the code quantity. For Units 7 and 8 with square cross section, the axial load level was 0.7f~Ag, and the transverse reinforcement was designed to be 2/3 and 4/9 of the code recommended quantity. Also, with an axial load level of 0.7f~Ag, Unit 9 of square cross section was designed in accordance with the design charts for ductility [4] to achieve a curvature ductility factor of 20. Testing of this unit was aimed to confirm the analytical prediction [4] that the current code [2] equation for confinement might be unconservative for columns with high axial compression. This prediction was also examined by testing Unit 11 with an octagonal cross section, which was designed according to the code recommended quantity of confinement for ductile detailing. Table 3.2 summarizes the details of all column units tested.
Table 3.2: Details of Column Units with Moderate and Large Axial Compression
Column ~ Transverse Reinforcement
Unit Cross Designf~ <pf~Ag diameter Sh fyh ~
Section (MPa) (mm) (mm) (MPa) Ps,code
5 square 35 0.5 8 81 372 0.45
6 square 35 0.5 6 96 388 0.22
7 square 30 0.7 12 96 308 0.67
8 square 30 0.7 8 77 372 0.45
9 square 30 0.7 12 52 308 1.24
10 octagonal 35 0.5 8 84 372 0.50
11 octagonal 30 0.7 10 57 338 1.01
In order to keep the quantities of transverse reinforcement to the expected percentages of the code quantities as mentioned previously, different compressive strengths of concrete were used in design. Units 5, 6 and 10, which had an axial load level of 0.5f~Ag, were designed using a compressive strength of 35 MPa. For Units 7, 8, 9 and 11 which had an axial load level of O. 7 f~Ag, a compressive strength of 30 MPa was used. The actual yield strengths of transverse reinforcing steel was used in the design calculations for transverse reinforcement.
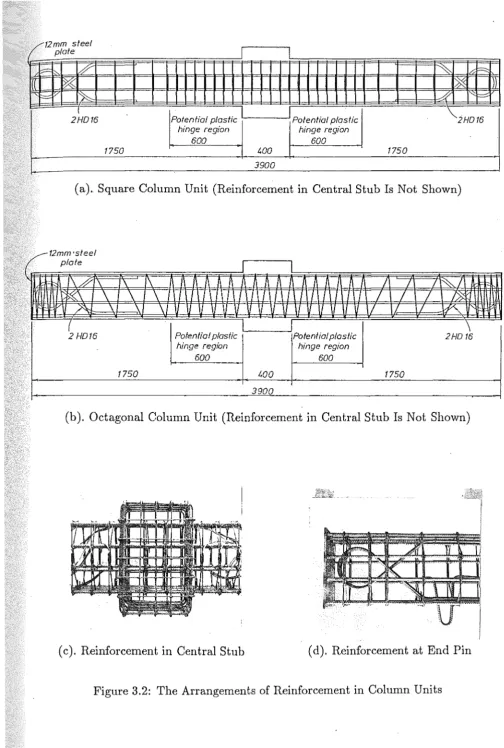
The arrangements of reinforcement in typical square and octagonal column units, including close up views of the reinforcement in the central stub and at the end of the column, are shown in Fig. 3.2. It can be seen that outside plastic hinge regions, the spacings of trans-verse reinforcement was taken as twice those provided in the potential plastic hinge regions. Around the loading pins at the column ends, closer spacings of transverse reinforcement Were placed to resist bursting stresses due to the concentration of high axial compression.
In designing the transverse reinforcement of the column units, the code [2] limitation of 6db
t I 12mm see
plate
p ~ ~ ~R
K
~ ~Ii)
'I'=~ "»- A' I'" F:::::
2H016 Potential plastic
I
I
Potential plastic \.2H016hinge region hinge region
600 600
1750 /'00 1750
3900
(a). Square Column Unit (Reinforce~ent in Central Stub Is Not Shown)
12 m'steel m
plate
I\~ \ \
1\
1\ J\ J\A A A A A A
J\ ~ A II A 11 jI / / ,~/~
\
\
\
JI
1\ I\I \
I I I I I
II I
II
L
/
/
/
I>J
2\j \ \
\/
V
VV
~\/
V V V
V
\I \I V II II V 1/ / / ~~H016
I
I
Potential plastic Potential plastic 2HO 16
hinge region hinge region
600 600
1750 /'00 1750
3900
(b). Octagonal Column Unit (Reinforcement in Central Stub Is Not Shown)
[image:36.598.59.564.29.778.2](c). Reinforcement in Central Stub ( d). Reinforcement at End Pin
and 12db outside plastic hinge regions, was satisfied. The maximum permitted spacing in
the plastic hinge r~gions was then 96 mm as used in Units 6 and 7. Smaller spacings were used in the other units.
3.3
Construction of Column Units
The reinforcing cage was first fabricated by tying the transverse bars to the longitudinal bars. The steel end plates of 12 mm thickness were welded to the longitudinal bars at each end of the cage. The reinforcing steel to form the central stub, was also placed. The stub was expected to behave elastically during the test .. As shown in Fig. 3.2d, two ex:
shaped reinforcing bars surrounding each end pin were also located to control any cracking of concrete in this region. Fig. 3.3 shows the reinforcing cage of a typical column unit.
Figure 3.3: Reinforcing Cage of a Typical Column Unit
The cage was then placed in a plywood mould which had been painted and oiled to facilitate the removal of the unit after curing. The 55 mm diameter steel tubes were located at the position of the pins, and the 10 mm diameter steel rods for holding the potentiometers were also positioned and screwed to prevent any movement. These rods had polystyrene tips at both ends to ensure that the crushing of cover concrete during testing would not affect the measurements. Four 16 mm diameter anchor bars, to be used for lifting the unit into the DARTEC machine, and four 32 mm diameter plastic tubes to be used for the bolts of the laterallo1}d jack assembly were placed. A complete reinforcing cage in the mould, ready for placing the concrete in a horizontal position, is shown in Fig. 3.4.
Figure 3.4: Reinforcing Cage in a Plywood Mould
kg/m
3, respectively. A graded aggregate with a maximum size of 12 mm was used. The concrete had a slump of 100 mm.From the first batch of concrete, with a target strength of 35 MPa, three column units, namely Units 5, 6 and 10 were cast. Twelve 200 X 100 mm diameter concrete cylinders and
three 120 mm square beams 400 mm long were also cast. From the second batch, with a target strength of 30 MPa, four column units, namely Units 7, 8, 9 and 11 were cast together with fifteen cylinders and three beams with the same dimensions as above.
The specimens were compacted by mechanical vibrators. The suface of the specimens was then trowelled smooth, covered with damp sacks and polythene, and kept moist for seven days. The cylinders and the beams were vibrated on a vibrating table and left to cure in a fog room at 20°C and 100% relative humidity until tested.
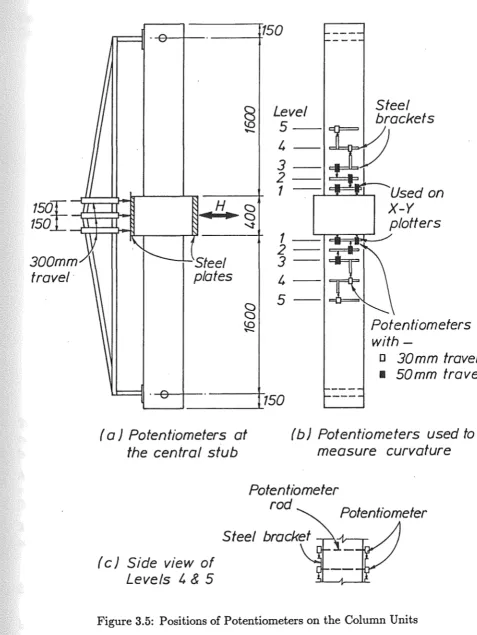
3.4 Instrumentation of Column Units
The instrumentation for measuring displacements is shown in Fig. 3.5. Three 300 mm travel SAKAE linear potentiometers were installed on the side of the stub to measure the horizontal displacement and to calculate the rotation of the stub. Ten pairs of linear potentiometers of either 50 mm travel or 30 mm travel, aligned vertically at five levels above and below the stub, were used to calculate the column curvatures and compressive strains in the core concrete. This calculation was carried out assuming that plane sections remain plane after bending.
The potentiometers measuring vertical deformations were mounted on the steel rods which passed horizontally through the columns and were cast in the columns. To ensure that these potentiometer measurements would not be effected by the deformations of the transverse and longitudinal reinforcing bars, different gauge lengths were used, depending on the spacings of the transverse reinforcement. Table 3.3 shows the distance of the potentiometer rods from the face of the stub for each column unit.
To measure the strains in the plastic hinge regions, SHOWA N11-FA-5-120-115 mm electrical resistance strain gauges with a gauge factor of 2.11 were attached on the hoops and spirals (see Fig. 3.6). For each position, the gauges were placed in pairs so that the axial stress could be obtained with effect of bar bending eliminated.
For the square columns, the electrical resistance strain gauges were placed on both the octagona'.l and square hoops and on the four sets of hoops above and below the central stub, except for Unit 9 where because of the small hoop spacing of 52 mm the gauges were placed on every second hoop at four levels above and below the stub. For the octagonal columns, they were placed on the five spiral turns above and below the central stub, except for Unit
150f
150
300mm
travel·
-f4--+-- _ _ _
-1-1.50
§
-H a
II
..
a
...,.
Steel
plates
a
a
(Q
,...,
Level
5
4
3
2
-1 -
Used on
X-Y
plotters
~~~
1
2
3
4
5
-Potentiometers
with
-o
30mm travel
I
50mm travel
1...-_....J _ _ _ _ ---I..
150
( a) Potentiometers at
the central stub
( c)
Side view of
Levels
48 5
(b) Potentiometers used to
measure curvature
[image:39.597.66.544.101.737.2]Potentiometer
rod
Table 3.3: The Distance of Potentiometer Rods from the Face of the Central Stub for Each Column Unit, in mm
Unit 1st level
5 80
6 80
7 80
8 80
9 100
10 80
11 80
2nd level 3rd level 4th level 160
160 180 160 200 160 160
310 310 280 310 350 320 320
III
III"Direction of
Loading
470 470 460 470 510 500 500
5th level 630 630 640 630 710 680 680
Figure 3.6: Positions of Electrical Resistance Strain Gauges on the Hoops and Spirals
The electrical resistance strain gauges in the square columns were placed prior to