Diffusion Anisotropy: Correlation with Structural Alteration in
Gliomas of the Cerebral Hemispheres
James A. Brunberg, Thomas L. Chenevert, P. E. McKeever, Donald A. Ross, Larry R. Junck, Karin M. Muraszko, Robert Dauser, James G. Pipe, and A. T. Betley
PURPOSE: To determine whether a relationship exists between water diffusion coefficients or diffusion anisotropy and MR-defined regions of normal or abnormal brain parenchyma in patients with cerebral gliomas. METHODS: In 40 patients with cerebral gliomas, diffusion was characterized in a single column of interest using a motion-insensitive spin-echo sequence that was applied sequentially at two gradient strength settings in three orthogonal directions. Apparent diffusion coefficients (ADCs) were derived for the three orthogonal axes at 128 points along the column. An average ADC and an index of diffusion anisotropy (IDA5diffusion coefficientmax-min/diffusionmean) was then calculated for any of nine MR-determined regions of interest within the tumor or adjacent parenchyma. RESULTS: In cerebral edema, mean ADC (all ADCs as 1027cm2/s) was 138624 (versus 8366 for normal white matter) with mean IDA of 0.2660.14 (versus 0.4560.17 for normal white matter). Solid enhancing central tumor mean ADC was 131625 with mean IDA of 0.1560.10. Solid enhancing tumor margin mean ADC was 131625, with IDA of 0.2560.20. Cyst or necrosis mean ADC was 235635 with IDA of 0.0760.04. CONCLUSION: In cerebral gliomas ADC and IDA determinations provide information not available from routine MR imaging. ADC and IDA determinations allow distinction between normal white matter, areas of necrosis or cyst formation, regions of edema, and solid enhancing tumor. ADCs can be quickly and reliably characterized within a motion-insensitive column of interest with standard MR hardware.
Index terms: Glioma; Brain neoplasms, magnetic resonance; Magnetic resonance, diffusion-weighted scanning; Magnetic resonance, tissue characterization
AJNR Am J Neuroradiol16:361–371, February 1995
Tissue water diffusion is an intracellular and extracellular phenomenon. The magnitude and directional preponderance of diffusion is vari-ably restricted by cell membranes and tissue macromolecules (1). The clinical importance of diffusion characterization in the central nervous system is that the magnitude and direction of this tissue property can be used to reflect
nor-mal or developmental tissue properties and to characterize gross and microscopic structural alterations associated with tissue disease. Al-though derived with magnetic resonance (MR) techniques, diffusion phenomena are largely separate from the T1 and T2 relaxation proper-ties characterized by routine MR imaging. Initial studies in human subjects have demonstrated the utility of characterizing the apparent diffu-sion coefficient (ADC) of water in tissue for the evaluation of early stroke (2–5), for the demon-stration of normal white matter fiber orientation as diffusion anisotropy (6 –11), for the evalua-tion of intracranial tumors (12–15), and for the characterization of white matter lesions in both multiple sclerosis (14, 16) and pseudotumor cerebri (4, 17).
Techniques for the quantitative MR charac-terization of tissue water ADCs as incoherent
Received February 2, 1994; accepted after revision June 15. This work was supported in part by a grant from General Electric Medical Systems.
From the Departments of Radiology (J.A.B., T.L.C., J.G.P., A.T.B.), Neurology (J.A.B., L.R.J.), Neurosurgery (J.A.B., D.A.R., K.M.M., R.D.), and Pathology (P.E.M.), University of Michigan Hospitals, Ann Arbor.
Address reprint requests to James A. Brunberg, MD, Department of Radiology, B2B 311, Box 0030, University of Michigan Medical Center, Ann Arbor, MI 48109-0030.
AJNR 16:361–371, Feb 1995 0195-6108/95/1602–0361
qAmerican Society of Neuroradiology
intravoxel displacement over time and for the construction of diffusion-weighted images have been described (4, 8, 11–15, 18 –24). Two fac-tors have limited extensive clinical use of such characterization as an adjunct to MR imaging. The first has been the sensitivity of diffusion-weighted MR images and of quantitative deter-minations of ADCs to involuntary and physio-logic patient movement (13, 21, 22, 24, 25). Such movement is associated with the produc-tion of phase-related artifact or with compro-mised voxel registration, either of which inter-feres with accurate ADC characterization. The second factor has been the expense and relative unavailability of MR gradient hardware neces-sary for echo-planar sequences, which, be-cause of rapid image acquisition, are relatively motion insensitive.
In response to these technical limitations a motion-insensitive pulse sequence that uses standard MR hardware has been developed at our institution for the rapid quantitative deter-mination of water ADCs in three orthogonal di-rections (6, 25). The purpose of this study was to determine whether water ADCs derived with a modified version of this sequence could provide useful information supplemental to that ob-tained from routine MR imaging in patients with cerebral gliomas. We wished to determine whether a correlation exists between MR-located regions of structurally normal or abnor-mal brain parenchyma and quantitative
deter-minations of water ADCs and diffusion
anisotropy, and to determine whether these techniques would allow distinction between tis-sue types not otherwise evident on MR imaging.
Materials and Methods
In vivo quantitative determinations of water ADCs were obtained on 40 patients with supratentorial gliomas of
varying grade and type, as follows.
Astrocytoma II 6
Astrocytoma III 9
Glioblastoma 15
Giant cell astrocytoma 3
Oligodendroglioma II 3
Pilocytic astrocytoma 1
Ganglioglioma 3
Patients were from two to 74 years of age. No patients had clinical or routine MR evidence of neurologic disorders other than the primary neoplasms. Tumor diagnosis was established in all cases by stereotactic or excisional bi-opsy. Use of the pulse sequence for ADC characterization was approved by our institutional review board, and in-formed patient or parental consent was obtained.
MR imaging and ADC characterization were accom-plished with a 1.5-T system with standard clinical gradient coil strength (1.0 G/cm) and a transmit-receive quadra-ture head coil. No head immobilization device was used. ADC was routinely characterized after the completion of routine clinical imaging including the administration of gadopentetate dimeglumine. Preliminary studies at this institution (unpublished) have demonstrated no alteration in ADC values in normal tissue or in abnormally enhancing tissue after contrast administration.
ADCs were determined in at least one 8-mm38-mm3 20-cm columnar region of interest. This column was lo-cated on the basis of coordinates derived from the MR image series. The pulse sequence used for ADC charac-terization was a modified Stejskal-Tanner spin-echo se-quence at 1500/125 (repetition time/echo time) (Fig 1). The column of interest was established by the orthogonal placement of the planes of the 908and 1808pulses of the pulse sequence so that only tissue at the intersection of these planes was interrogated for diffusion characteriza-tion. Two diffusion-gradient amplitudes (0.4 and 0.9 G/cm) were applied iteratively in three orthogonal direc-tions for each column of interest, using timing as indicated in Figure 1. Gradient b factors were numerically calculated independently for each of the three orthogonal gradient wave forms; nominal b factors were 7940 and 40 140 s/cm2.
[image:2.612.215.550.103.246.2]Cardiac or peripheral gating was not used. Such gating would have lengthened each study and induced possible Fig 1. Pulse sequence diagram.
error from variable impulse time. Column location and phase-insensitive averaging were designed specifically not to include a phase-encoding gradient and thereby to re-duce pulsatility phase shift so that cardiac gating was not necessary. Variable T1 saturation effects during the initial pulses were avoided by excluding the first six diffusion-sensitizing echoes from data averaging.
Gradient wave forms were designed to minimize cross-terms in b factors. Cross-cross-terms are contributions to diffu-sion sensitization that are induced by interactions between gradient pulses, which are applied specifically for a given
[image:3.612.56.557.96.511.2]directional diffusion characterization, and other gradient pulses, which are applied in the same direction for section selection or frequency encoding. Interaction between per-pendicular gradient pulses can similarly affect diffusion sensitivity. In this study, gradient wave forms were de-signed to minimize these cross-terms and interactions be-tween gradients. This was done by applying diffusion-sensitizing gradient pulses independently along the three orthogonal directions. It was also done by having the 908 radio frequency pulse and the frequency-encoding wave forms temporally integrated to zero when diffusion pulses Fig 2. Twenty-year-old patient with grade III astrocytoma.
A, Diffusion sequence pilot image.
T1-weighted images before (B) and after (C) gadopentetate dimeglumine administration demonstrate a well-demarcated nonen-hancing lesion, which is bright on T2-weighted images (D).
were applied (Fig 1). The orthogonal 1808gradient pulse did contribute a cross-term, but its effect was negligible because the gradient pulse was short in duration.
Data from like gradient conditions were combined “in magnitude” to improve signal-to-noise ratio without risk of phase cancellation from gross motion phase shifts. At least 20 single excitations were combined for each diffu-sion gradient condition to improve signal-to-noise ratio and to reduce the random error in ADC values to approx-imately 10%. Each excitation represented a single incor-poration of the pulse sequence (Fig 1), because phase-encoding steps were not used. A pilot image (Fig 2A) was interleaved with the diffusion data acquisition to assure proper positioning of the column of interest and to assure that there was no gross motion during the acquisition of diffusion data. Because the pilot image was interleaved with the ADC characterizing sequence, the prescribed col-umn of interest was annotated on the image as a band of saturation. The entire acquisition time for three orthogonal directional ADC characterizations and for derivation of the pilot image was 6.5 minutes.
Time-domain data were transferred to a SPARC10 work station (Sun Microsystems, Mountain View, Calif) for processing with Advanced Visual Systems software (AVS, Waltham, Mass). Echoes were individually Fourier trans-formed. Quantitative accuracy of the sequence was deter-mined to be within 5% using water and acetone phantoms. Frequency encoding along the 20-cm length of the column (128 steps) provided a resolution of 1.56 mm. Low band-width reception (8 kHz) was used to enhance the signal-to-noise ratio.
ADC values were calculated for each of the three axes of the column of interest (ADCA-P, ADCR-L, and ADCS-I) using signal intensity (Sb1 and Sb2) at each of 128 seg-ments along the length of the column of interest as: 1) ADCi5In~Sb1i/Sb2i!~b22bli)
where i is R-L, A-P, and S-I, and b1 and b2 are the two diffusion gradient settings. The data for each direction were independently portrayed in graphic form (Fig 2E). From these data a mean ADC (ADCmean5ADC(R-L)1
(A-P)1(S-I)/3) and an index of diffusion anisotropy (IDA 5 ADCmax2min/ADCmean) were calculated on a pixel-by-pixel basis. These data were than summarized for each chosen region of interest. ADCs were expressed as 1 3 1027cm2/s. ADC
maxand ADCminwere the ADCs for the maximal and the minimal diffusion values in the three orthogonal directions for each voxel. ADCmean was the mean ADC for each voxel or region of interest.
To correlate ADCs with anatomic regions of interest, both the margins of the column in which the ADC was characterized and a locating grid were superimposed on routine T2-weighted images and on T1-weighted images obtained before and after gadopentetate dimeglumine ad-ministration (0.1 mmol/kg) (Fig 2B). In this manner ADCs were located independently from the nine specific regions of interest, as follows.
1. Nonenhancing solid tumor, no adjacent enhancement 2. Nonenhancing solid tumor surrounded by enhancing tumor 3. Enhancing solid tumor without a central nonenhancing
component
4. Enhancing margins of tumor surrounding nonenhancing tumor, cyst, or necrosis
5. Central cyst or necrosis
6. White matter edema distal to margins of enhancement 7. Normal-appearing white matter adjacent to mass effect 8. Normal white matter, opposite hemisphere
9. Normal gray matter, opposite hemisphere
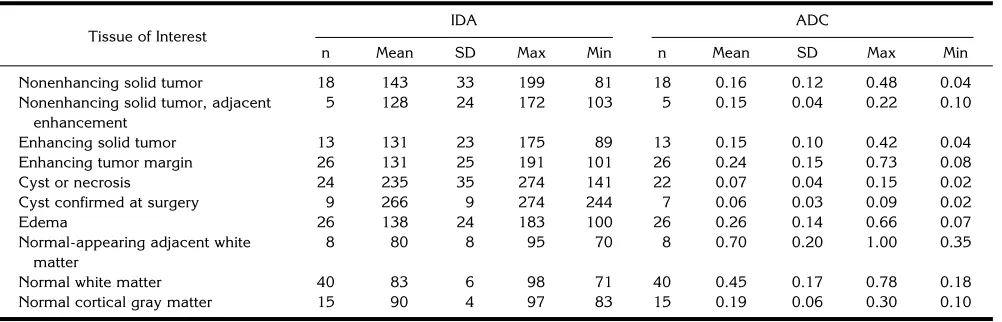
[image:4.612.58.559.114.275.2]Each region of interest was defined by MR characteris-tics on T2-weighted images and on T1-weighted images without and with gadopentetate dimeglumine administra-tion. Histologic correlation was available only from the central portion of each tumor and from areas of cystic alteration or necrosis. Biopsies were not done on regions of edema and areas of normal tissue. Not all such areas could be identified in each patient. In some patients the same tissue type was sampled more than once, but always at a different location. Each region was sampled for its ADCs only if partial volume effects could be avoided. Values for ADCmeanand IDAmeanwere compared for each of the nine MR located regions of interest using Pvalues calculated from Student’s two-tailedttests for unpaired groups. TABLE 1. ADC and IDA for each region of interest
Tissue of Interest
IDA ADC
n Mean SD Max Min n Mean SD Max Min
Nonenhancing solid tumor 18 143 33 199 81 18 0.16 0.12 0.48 0.04
Nonenhancing solid tumor, adjacent enhancement
5 128 24 172 103 5 0.15 0.04 0.22 0.10
Enhancing solid tumor 13 131 23 175 89 13 0.15 0.10 0.42 0.04
Enhancing tumor margin 26 131 25 191 101 26 0.24 0.15 0.73 0.08
Cyst or necrosis 24 235 35 274 141 22 0.07 0.04 0.15 0.02
Cyst confirmed at surgery 9 266 9 274 244 7 0.06 0.03 0.09 0.02
Edema 26 138 24 183 100 26 0.26 0.14 0.66 0.07
Normal-appearing adjacent white matter
8 80 8 95 70 8 0.70 0.20 1.00 0.35
Normal white matter 40 83 6 98 71 40 0.45 0.17 0.78 0.18
Results
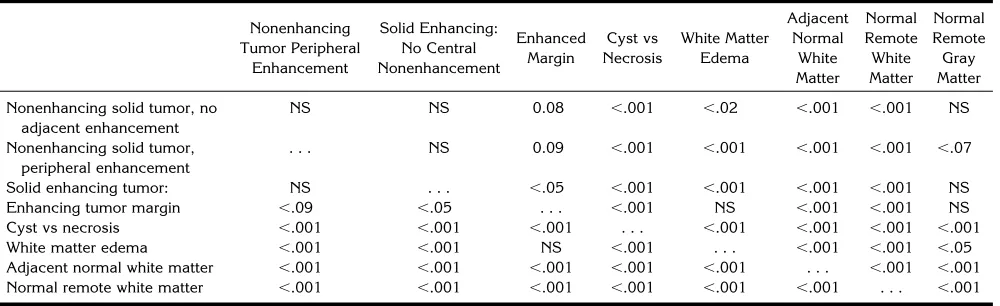
Statistical data regarding mean ADC coeffi-cients and calculated index of diffusion ansiot-ropy (IDA) for each of the nine regions of in-terest are listed in Table 1. ADC and IDA determinations were not significantly related to histologic type or grade for the nine selected regions of interest (data not shown). There were, however, statistically significant differ-ences in mean ADCs and in IDAs between several of the nine regions of interest (Tables 2 and 3).
Three patients demonstrated mass lesions characterized by MR imaging as sharply demar-cated solitary regions of unenhancing low signal intensity on T1-weighted images and as regions of high signal intensity on T2-weighted images (Fig 2). It was not possible in these patients to determine from MR imaging whether the le-sions were cystic or solid. ADC
characteriza-tion in each instance showed mean ADCs of 164, 199, and 109 3 1027 cm2/s. At surgery each of the lesions was demonstrated to be solid and firm.
[image:5.612.59.558.116.267.2]In 18 patients MR imaging demonstrated al-terations consistent with one or more regions of necrosis or cyst formation (Table 1). In 8 of these 18 patients stereotactic or open biopsies demonstrated at least one large distinct fluid collection (Fig 3). In 1 patient there was surgical confirmation of the presence of tumor necrosis unassociated with fluid collection (Fig 4). In this patient the mean ADC was 204 6 14 3 1027 cm2/s, and the IDA was 0.14 6 0.01. In the remaining 9 patients histologic findings or clin-ical appearance indicated the presence of small cysts intermixed with necrosis. None of these 18 patients were separated from the larger group designated as “cyst versus necrosis” on the basis of MR findings alone.
TABLE 2. Mean ADC comparisons:Pvalues
Nonenhancing Tumor Peripheral Enhancement Solid Enhancement: No Central Nonenhancement Enhanced Margin Cyst vs Necrosis White Matter Edema Adjacent Normal White Matter Normal Remote White Matter Normal Remote Gray Matter
Nonenhancing solid tumor, no adjacent enhancement
,.07 NS NS ,.001 0.09 ,.001 ,.001 ,.001
Nonenhancing solid tumor, peripheral enhancement
. . . NS NS ,.001 0.09 ,.001 ,.001 ,.001
Solid enhancing tumor NS . . . NS ,.001 NS ,.001 ,.001 ,.001
Enhancing tumor margin NS NS . . . ,.001 NS ,.001 ,.001 ,.001
Cyst vs necrosis ,.001 ,.001 ,.001 . . . ,.001 ,.001 ,.001 ,.001
White matter edema ,.001 NS NS ,.001 . . . ,.001 ,.001 ,.001
Adjacent normal white matter ,.001 ,.001 ,.001 ,.001 ,.001 . . . ,.05 ,.001 Normal remote white matter ,.001 ,.001 ,.001 ,.001 ,.001 ,.05 . . . ,.001
Note.—NS indicates not significant (P..10).
TABLE 3. Mean diffusion anisotropy comparisons:Pvalues
Nonenhancing Tumor Peripheral Enhancement Solid Enhancing: No Central Nonenhancement Enhanced Margin Cyst vs Necrosis White Matter Edema Adjacent Normal White Matter Normal Remote White Matter Normal Remote Gray Matter
Nonenhancing solid tumor, no adjacent enhancement
NS NS 0.08 ,.001 ,.02 ,.001 ,.001 NS
Nonenhancing solid tumor, peripheral enhancement
. . . NS 0.09 ,.001 ,.001 ,.001 ,.001 ,.07
Solid enhancing tumor: NS . . . ,.05 ,.001 ,.001 ,.001 ,.001 NS
Enhancing tumor margin ,.09 ,.05 . . . ,.001 NS ,.001 ,.001 NS
Cyst vs necrosis ,.001 ,.001 ,.001 . . . ,.001 ,.001 ,.001 ,.001
White matter edema ,.001 ,.001 NS ,.001 . . . ,.001 ,.001 ,.05
Adjacent normal white matter ,.001 ,.001 ,.001 ,.001 ,.001 . . . ,.001 ,.001 Normal remote white matter ,.001 ,.001 ,.001 ,.001 ,.001 ,.001 . . . ,.001
[image:5.612.58.558.582.735.2]Discussion
Techniques for the MR characterization and display of tissue water diffusion, both as inco-herent intravoxel displacement over time and as diffusion-weighted images, have been de-scribed (4, 8, 11, 18, 20, 21, 24). With each of these techniques the occurrence of intravoxel water-proton diffusion in the presence of a strong intravoxel magnetic gradient causes sig-nal loss relative to what would be observed from nondiffusing protons. This signal alteration is caused by loss in phase coherence as diffusing protons of water move within the voxel, which has a steep imposed intravoxel magnetic gradi-ent applied in positive and negative directions (Fig 1). Nondiffusing protons do not alter their net phase in response to this symmetric
bidirec-tional gradient imposition. Ratios of intravoxel signal intensity derived from at least two inde-pendent sequences with gradients of differing but known strength can then be used to calcu-late quantitative ADCs (equation 1).
[image:6.612.231.557.101.512.2]Tissue water diffusion is complex to charac-terize. Its magnitude and direction depend on the permeability and spacing of diffusion barri-ers, viscosity of the suspending medium, and duration of diffusion observation (1). Character-ization is also complicated by bulk flow within capillaries and by tissue water active transport processes. Protons characterized in the brain are contained in water, whereas protons within macromolecules and membranes themselves make no contribution to diffusion characteriza-tion because they are relatively immobile and
Fig 3. Thirty-eight-year-old patient with glioblastoma.
A, T1-weighted image after gado-pentetate dimeglumine administration dem-onstrates mass with contrast-enhancing margins and two separate nonenhancing re-gions of differing signal intensity.
B, On T2-weighted images two areas of central high signal intensity are identified.
have extremely short T2 values. Although cel-lular membranes are permeable to water, the movement of water molecules through such membranes is restricted. To express diffusion anisotropy as a single value within a voxel or region of interest we used the calculated rela-tionship IDA5ADCmax-min/ADCmean(see “Ma-terials and Methods”). The mean IDA in regions of interest varied from 0.06 in regions of cyst confirmed at surgery, in which there would be no internal structural diffusion barriers, to 0.70 in normal appearing white matter immediately adjacent to an area of mass effect, in which internal preservation of white matter myelin ori-entation would be preserved (Table 1).
Diffusion data reported in this study have been characterized as ADCs, which were de-rived in each of three orthogonal directions. From these data a mean ADC and an IDA have been derived. It is recognized that diffu-sion in an anisotropic system is described as a
tensor quantity that may be represented as a diffusion ellipsoid. The lengths and orienta-tions of the principal axes of the ellipsoid in-clude magnitude and direction of maximal and minimal diffusitivities. From these axes an ex-pression of anisotropy may be derived. The IDA used in this study is analogous but is lim-ited by the derivation of diffusion coefficients from the x-, y-, and z-axes of the scanner. The mean ADC determined in this study is propor-tional to the trace of the diffusion tensor, which as a scaler invariant of the tensor is not limited by the three-directional measurement scheme of this study.
Although water-diffusion phenomena are quantified by MR techniques, and MR relaxation rates have diffusion dependencies, diffusion is largely separate from T1 and T2 properties that determine contrast in conventional MR imaging. Characterization of diffusion is not a significant component of routine MR imaging. The
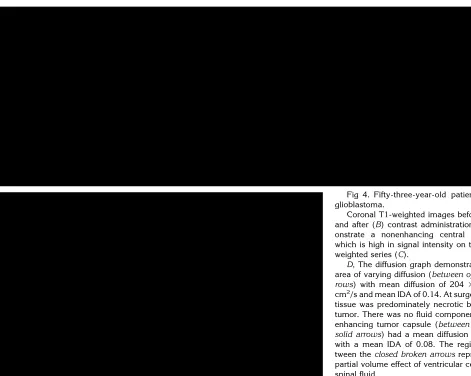
quanti-Fig 4. Fifty-three-year-old patient with glioblastoma.
Coronal T1-weighted images before (A) and after (B) contrast administration dem-onstrate a nonenhancing central region, which is high in signal intensity on the T2-weighted series (C).
[image:7.612.58.529.96.472.2]fication of ADCs relies instead on the charac-terization of intravoxel alteration in signal inten-sity in response to imposed bipolar gradients as described above. The independence of T1 and T2 properties from ADC characterization is il-lustrated by the occurrence of high signal on T2 images within lesions that do not enhance after gadopentetate dimeglumide administra-tion and that by ADC characterizaadministra-tion and surgical observation may be solid (Fig 2) or cystic (Fig 3).
Phase-related artifact from patient movement and from physiologic brain pulsation has limited the utility of ADC characterization with routine imaging hardware. In the current study the elim-ination of phase-encoding localization and the use of phase-insensitive processing permitted the acquisition of a one-dimensional image that could be used for ADC characterization in a specific region of interest. Phase-insensitive processing eliminated nearly all motion artifact that originates from bulk motion phase shifts. The incorporation of this column technique as a probe for the characterization of ADCs within a region of interest has provided rapid and repro-ducible data that are relatively free of artifact without the use of head-immobilization devices. The absence of a diffusion “image” has not pre-vented the incorporation of ADC data into clin-ical patient treatment.
Published data regarding the characterization of ADCs in the intracranial tumors are limited. Low qualitative diffusion in epidermoids relative to cerebrospinal fluid has been recognized (13). Quantitative characterization of ADCs in a pa-tient with cerebral astrocytomas has indicated an ADC of less than 15031027cm2/s (12). In a patient with oligodendroglioma ADC, values were less than 190 to 20031027cm2/s (26). In a review of imaging of anisotropically restricted diffusion of water in the nervous system, Hajnal et al (14) made reference to additional unre-ported patients who had glioma with elevated qualitative ADCs within tumor tissue and to el-evated quantitative ADCs in surrounding edema (179 and 249 3 1027cm2/s) and regions of
tumor necrosis (23831027cm2/s) or cyst (257
and 265 3 1027cm2/s) formation (14). These
ADC determinations were all obtained with dif-fering hardware, with varying pulse sequences, and with varying motion-suppressing tech-niques. In general, the findings have been within the range of the values demonstrated in the current study (Table 1).
In the current series of 40 patients with cere-bral gliomas, statistically different mean values for quantitative ADCs and for calculated values of diffusion anisotropy were detected between MR-located regions of interest at the site of the tumor and normal gray and white matter of the opposite hemisphere. Normal white matter was consistently associated with diffusion anisot-ropy, as previously reported (6). This direc-tional preponderance of diffusion most likely arises as the result of relative restriction of transverse diffusion by longitudinal myelinated fiber orientation. Because water diffusion in white matter is restricted (1), ADC values are in part determined by the relative orientation of the magnetic field gradient and the predominate direction within each voxel. This diffusion an-isotropy provides information not otherwise available from MR imaging regarding relative myelin fiber orientation within each voxel and regarding the integrity and state of development of the myelin sheath. ADC values are lower perpendicular to the axis of the axon because the myelin sheath is less permeable to water then is the axonal cytoplasm, because water within myelin has a short T2 and is not charac-terized by the sequence used for ADC determi-nation, and because the longitudinal configura-tion of the axonal cytoplasm promotes the diffusion or transport of water in a longitudinal rather than transverse direction.
disruption of myelinated fiber orientation by the tumor process.
Adjacent to areas of mass effect, the pres-ence of displaced and distorted white matter is frequently demonstrated with MR imaging. This white matter may be normal or low in signal intensity on T2-weighted images. In eight pa-tients with displaced or distorted white matter, mean ADCs and diffusion anisotropy in these regions differed significantly from each of the other eight areas characterized. The slightly lower mean ADC values and higher diffusion anisotropy in these regions relative to normal white matter in the opposite hemisphere may relate to mechanical compression of myelin with diminished extracellular water content or may relate to relative ischemia from compres-sion of the capillary bed. Previous studies have established the occurrence of diminished ADCs in the presence of ischemia, possibly because of
the shift of water to a more intracellular envi-ronment in which diffusion is more restricted by intracellular organelles and macromolecules.
[image:9.612.56.527.93.482.2]Regions of white matter edema distal to en-hancing tumor margins demonstrated mean ADC values that were significantly different from normal remote cortical gray matter and white matter, from adjacent normal-appearing white matter, and from areas of tumor cyst or necrosis (Fig 3). There was no difference be-tween ADCs derived from regions of edema and those derived from regions of enhancing or non-enhancing tumor. This lack of distinction most likely relates to increased intercellular water within edematous white matter and within tu-mor at the site of replacement of normal brain parenchyma. However, a significant difference in mean diffusion anisotropy was demonstrated between regions of white matter edema and re-gions of enhancing or nonenhancing tumor.
Fig 5. Eighteen-year-old patient with grade II astrocytoma.
Coronal T1-weighted images before (A) and after (B) contrast administration show a densely enhancing cortical lesion, which is high in signal on T2-weighted images (C). There is a region of apparent edema medial to the enhancing lesion (C).
This difference in anisotropy most likely reflects the presence of intact myelin membranes within white matter edema and the loss of this diffusion-restricting boundary in areas of contiguous tu-mor cell proliferation.
In regions of cyst formation or necrosis there was diminished or absent diffusion anisotropy relative to other tissue types sampled, and ADC values were markedly elevated (Tables 1 and 2). Regions suspected to be cystic or necrotic on the basis of MR imaging could be reliably distinguished as a group from the eight other tissue types on the basis of either ADC charac-teristic (P , .001). Eight patients had large cysts, the fluid contents of which were con-firmed at the time of surgery or biopsy. Four were in glioblastomas, and four were in other tumor types. ADCs for this subgroup had a nar-row range of 244 to 274 3 1027cm2/s with a
mean of 26631027cm2/s and SD of 931027
cm2/s. Mean diffusion anisotropy was 0.06 with
a range of 0.02 to 0.09 and an SD of 0.03. These findings are consistent with our previous findings of an absence of diffusion anisotropy in cystic lesions of origins other than tumor that involve the brain or spinal cord (unpublished data). With cystic lesions from causes other than tumor, ADCs may approach that of cere-brospinal fluid (30031027cm2/s), most likely because of lower concentration of protein or other macromolecules within such fluid. ADCs of low-molecular-weight solvents such as water are lowered by factors of two to the three times when added polymer concentrations reach 30% (1). Among patients with suspected cyst forma-tion or regions of tumor necrosis a mean ADC of greater than 250 and a mean IDA of less than 0.05 has consistently been associated with the presence of fluid as demonstrated at surgery or with aspiration at the time of stereotactic biopsy.
The ability to distinguish cystic or necrotic areas from regions of solid or extremely viscous tissue before surgery is of significant clinical use in designing the surgical approach to a lesion. Routine MR imaging does not consistently dis-tinguish cystic from solid gliotic nonenhancing alterations. ADC characterization is now rou-tinely accomplished at this institution as a com-ponent of preoperative MR evaluation. The abil-ity to distinguish tissue consistency with ADC characterization is also used in establishing the utility of percutaneous aspiration for the treat-ment of rapidly increasing intracranial pressure
in patients with glioblastomas or cystic astrocy-tomas.
A significant difference between mean ADCs of nonenhancing and enhancing tumor tissue was not demonstrated. Evaluations of diffusion anisotropy did, however, indicate greater per-sistence of anisotropic diffusion in enhancing tumor margins than in central enhancing or nonenhancing tumor. This finding may relate to persisting structural organization at the en-hancing tumor margin, possibly caused by persisting although abnormal myelinated white matter, as tumor spreads peripherally. The lower values for diffusion anisotropy in central, more-established regions of tumor growth may reflect the loss of native myelinated path-ways and their influence on diffusion anistropy as the tumor matures. A difference in ADCs or diffusion anisotropy between glioma types or grades within each of the nine regions of inter-est was not demonstrated.
Although ADCs alone did not distinguish be-tween enhancing central tumor and surrounding edema, there was a significant difference in dif-fusion anisotropy between these two regions. Higher diffusion anisotropy was also demon-strated at the enhancing margin of a tumor than in an enhancing central lesion. These findings may again be consistent with greater disruption of diffusion-restricting myelin membranes in the more established central tumor mass. Enhanc-ing lesions localized to the cerebral cortex were noted to have lower diffusion anisotropy than lesions centered in deep white matter.
of myelinated pathways in regions of adjacent tumor necrosis, enhancement, and edema.
References
1. Tanner JE. Intracellular diffusion of water.Arch Biochem Biophys 1983;224:416 – 428
2. de Crespigny AJ, Tsuura M, Moseley ME, Kucharczyk J. Perfusion and diffusion MR imaging of thromboembolic stroke. J Magn Reson Imaging1993;3:746 –754
3. Warach S, Chien D, Li W, Ronthal M, Edelman RR. Fast magnetic resonance diffusion-weighted imaging of acute human stroke. Neurology1992;42:1717–1723
4. Thomsen C, Henriksen O, Ring P. In vivo measurement of water self diffusion in the human brain by magnetic resonance imaging. Acta Radiol1987;28:353–361
5. Chien D, Kwong KK, Gress DR, Buonanno FS, Buxton RB, Rosen BR. MR diffusion imaging of cerebral infarction in humans.AJNR Am J Neuroradiol1992;13:1097–1102
6. Chenevert TL, Brunberg JA, Pipe JG. Anisotropic diffusion in human white matter: demonstration with MR techniques in vivo. Radiology1990;177:401– 405
7. Rutherford MA, Cowan FM, Manzur AY, et al. MR imaging of anisotropically restricted diffusion in the brain of neonates and infants.J Comput Assist Tomogr1991;15:188 –198
8. Chien D, Buxton RB, Kwong KK, Brady TJ, Rosen BR. MR diffu-sion imaging of the human brain.J Comput Assist Tomogr1990; 14:514 –520
9. Doran M, Hajnal JV, Van Bruggen N, King MD, Young IR, Bydder GM. Normal and abnormal white matter tracts shown by MR imaging using directional diffusion weighted sequences.J Comput Assist Tomogr1990;14:865– 873
10. Sakuma H, Nomura Y, Takeda K, et al. Adult and neonatal human brain: diffusional anisotropy and myelination with diffusion-weighted MR imaging.Radiology1991;180:229 –233
11. Douek P, Turner R, Pekar J, Patronas N, Le Bihan D. MR color mapping of myeling fiber orientation.J Comput Assist Tomogr 1991;15:923–929
12. Le Bihan D, Breton E, Lallemand D, Grenier P, Cabanis E, Laval-Jeantet M. MR imaging of intravoxel incoherent motions: appli-cation to diffusion and perfusion in neurologic disorders. Radiol-ogy1986;161:401– 407
13. Tsuruda JS, Chew WM, Moseley ME, Norman D. Diffusion-weighted MR imaging of the brain: value of differentiating between extraaxial cysts and epidermoid tumors.AJNR Am J Neuroradiol 1990;11:925–931
14. Hajnal JV, Doran M, Hall AS, et al. MR imaging of anisotropically restricted diffusion of water in the nervous system: technical, anatomic, and pathologic considerations. J Comput Assist Tomogr1991;15:1–18
15. Le Bihan D, Breton E, Lallemand D, Aubin M-L, Vignaud J, Laval-Jeantet M. Separation of diffusion and perfusion in intravoxel incoherent motion MR imaging.Radiology1988;168:497–505 16. Larsson HBW, Thomsen C, Frederiksen J, Stubgaard M,
Henrik-sen O. In vivo magnetic resonance diffusion measurement in the brain of patients with multiple sclerosis.Magn Reson Imaging 1992;10:7–12
17. Sørensen PS, Thomsen C, Gjerris F, Henriksen O. Brain water accumulation in pseudotumour cerebri demonstrated by MR-imaging of brain water self-diffusion. Acta Neurochir [Supp] (Wien)1990;51:363–365
18. Le Bihan D, Breton E, Lallemand D, Aubin M-L, Vignaud J, Laval-Jeantet M. Separation of diffusion and perfusion in intravoxel incoherent motion MR imaging.Radiology. 1988;168:497–505 19. Harada K, Fujita N, Sakurai K, Akai Y, Fujii K, Kozuka T. Diffusion
Imaging of the human brain: a new pulse sequence application for a 1.5-T standard MR system.AJNR Am J Neuroradiol1991;12: 1143–1148
20. Sotak CH, Li L. MR imaging of anisotropic and restricted diffusion by simultaneous use of spin and stimulated echoes.Magn Reson Med1992;26:174 –183
21. Prasad PV, Nalcioglu O. A modified pulse sequence forin vivo diffusion imaging with reduced motion artifacts.Magn Reson Med 1991;18:116 –131
22. Turner R, Le Bihan D, Maier J, Vavrek R, Hedges LK, Pekar J. Echo-planar imaging of intravoxel incoherent motion.Radiology 1990;177:407– 414
23. Moseley ME, Sevick R, Wendland MF, et al. Ultrafast magnetic resonance imaging: diffusion and perfusion.Can Assoc Radiol J 1991;42:31–38
24. Johnson GA, Maki JH. In vivo measurement of proton diffusion in the presence of coherent motion.Invest Radiol1991;26:540 –545 25. Chenevert TL, Pipe JG, Williams DM, Brunberg JA. Quantitative measurement of tissue perfusion and diffusion in vivo. Magn Reson Med1991;17:197–212