Cerebral Blood Flow Response Pattern during Balloon Test Occlusion
of the Internal Carotid Artery
Jens-Peter Witt, Howard Yonas, and Charles Jungreis
PURPOSE: To evaluate the risk of temporary or permanent internal carotid artery occlusion.
METHODS: In 156 patients intraarterial balloon test occlusion in combination with a stable
xenon-enhanced CT cerebral blood flow study was performed before radiologic or surgical treatment. All 156 patients passed the clinical balloon test occlusion and underwent a xenon study in combination
with a second balloon test. Quantitative flow data were analyzed for absolute changes as well as changes in symmetry. RESULTS: Fourteen patients exhibited reduced flow values between 20
and 30 mL/ 100 g per minute, an absolute decrease in flow, and significant asymmetry in the middle cerebral artery territory during balloon test occlusion. These patients would be considered
at high risk for cerebral infarction if internal carotid artery occlusion were to be performed. With one exception they belonged to a group (class I) of 61 patients who showed bilateral or ipsilateral flow decrease and significant asymmetry with lower flow on the side of occlusion. The other 95 patients, who showed a variety of cerebral blood flow response patterns including ipsilateral or
bilateral flow increase, were at moderate (class II) or low (class Ill) stroke risk. In contrast to these
findings, exclusively qualitative flow analysis failed to identify the patients at high risk: a threshold with an asymmetry index of 10% revealed only 16% specificity whereas an asymmetry index of 45% showed only 61% sensitivity for detection of low flow areas (<30 mL/100 g per minute).
CONCLUSION: For achieving a minimal hemodynamic related-stroke rate associated with per-manent clinical internal carotid artery occlusion we suggest integration of a thorough analysis of quantitative cerebral blood flow data before and during balloon test occlusion.
Index terms: Arteries, carotid (internal); Catheters and catheterization, balloons; lnterventional neuroradiology, provocative testing; Xenon
AJNR Am J Neuroradio/15:847-857, May 1994
Surgery for extensive skull-base tumors, un-clippable intracavernous aneurysms, and arterio-venous fistulas often requires temporary and sometimes permanent occlusion of one of the internal carotid arteries (ICAs) (1-14). Because each ICA provides one-third of the brain's blood supply, acute occlusion must result in dramatic cerebral blood flow (CBF) redistribution if neu-ronal function is to be maintained. Many tests have been introduced to assess this capability (9, 15-24).
Received June 7, 1993; accepted for publication September 27.
From Hannover University, Hannover, Germany (J.-P.W.), and the Departments of Neurological Surgery (H.Y.) and Radiology (H.Y., C.J.),
University of Pittsburgh Medical Center.
Address reprint requests to Howard Yonas, MD, Department of Neu-rosurgery, Montefiore University Hospital, 3459 Fifth Ave, Pittsburgh, PA
15213.
AJNR 15:847-857, May 1994 0195-6108/94/1505-0847
© American Society of Neuroradiology
847
At our institution, stroke risk is assessed using temporary ICA balloon test occlusion (BTO) in patients who may require a permanent ICA oc-clusion (25-29). This test includes careful, contin-uous neurologic examination during a 15-minute BTO which, for those who clinically pass the first BTO, is followed by two xenon-enhanced com-puted tomographic (CT) CBF studies (30-32), one with the balloon deflated and the other during a second 5-minute BTO. The xenon CT CBF stud -ies were performed to discriminate patients at increased hemodynamic risk for subsequent stroke if the ICA was therapeutically occluded.
Recent papers have proposed the use of qual-itative CBF studies with
technitium-99m-hexa-methyl-propyleneamine oxime single-photon
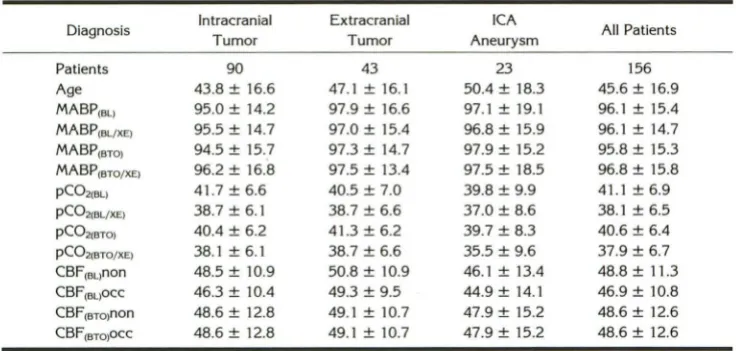
TABLE 1: Mean arterial blood pressure, end-tidal carbon dioxide, cerebral blood flow, and age in 156 BTO patients grouped into diagnostic subgroups
Diagnosis Intracranial Extracranial ICA All Patients
Tumor Tumor Aneurysm
Patients 90 43 23 156
Age 43.8 ± 16.6 47.1 ± 16.1 50.4 ± 18.3 45.6 ± 16.9 MABP(BL) 95.0 ± 14.2 97.9 ± 16.6 97.1 ± 19.1 96.1 ± 15.4 MABP(BL/XE) 95.5 ± 14.7 97.0 ± 15.4 96.8 ± 15.9 96.1 ± 14.7 MABP(BTO) 94.5 ± 15.7 97.3 ± 14.7 97.9 ± 15.2 95.8 ± 15.3 MABP(BTO/XE) 96.2 ± 16.8 97.5 ± 13.4 97.5 ± 18.5 96.8 ± 15.8 pC02iBL> 41.7 ± 6.6 40.5 ± 7.0 39.8 ± 9.9 41.1±6.9 p(02(BL/XE) 38.7 ± 6.1 38.7 ± 6.6 37.0 ± 8.6 38.1 ± 6.5 p(021BT0) 40.4 ± 6.2 41.3 ± 6.2 39.7 ± 8.3 40.6 ± 6.4 p(021BTO/XE) 38.1 ± 6.1 38.7 ± 6.6 35.5 ± 9.6 37.9 ± 6.7 CBF16L>non 48.5 ± 10.9 50.8 ± 10.9 46.1 ± 13.4 48.8 ± 11.3 CBF(BL)OCC 46.3 ± 10.4 49.3 ± 9.5 44.9 ± 14.1 46.9 ± 10.8 CBF16To>non 48.6 ± 12.8 49.1 ± 10.7 47.9 ± 15.2 48.6 ± 12.6 CBF(BTQ)OCC 48.6 ± 12.8 49.1 ± 10.7 47.9 ± 15.2 48.6 ± 12.6
Note.- MABP indicates mean arterial blood pressure (mm Hg); pC02, end-tidal carbon dioxide partial pressure (mm Hg); baseline, balloon deflated; BL/XE, stable xenon CT CBF study during baseline; BTO/XE, stable xenon CT CBF study during BTO; non, nonoccluded side; and occ, occluded side.
and demonstrated evidence for the high sensitiv-ity of this criterion in detecting patients at hemo-dynamic risk for permanent ICA occlusion. Con-cerns have been raised about the low specificity of this method (33, 36).
This study explores the range of CBF re-sponses to clinical BTO. Unlike the qualitative character of most single-photon emission CT re-ports using hexamethyl-propyleneamine oxime
or iodoamphetamine, stable xenon CT provides
quantitative CBF measurements (37). With this method we are able to analyze not only changes in symmetry, but also absolute CBF alterations including a fall to below the normal CBF range (51
±
10 mL/100 g per minute) (37) during BTO. We believe this provides a valuable predictor of a patient's possible cerebrovascular decompen-sation after permanent ICA occlusion.Materials and Methods
Within the last 10 years more than 450 BTOs have been performed at our institution. More than 400 of these ex-aminations were done in combination with xenon CT CBF measurements.
Patients
Of the 400 patients, 156 (89 female, 67 male) were randomly selected by alphabetical order. Only complete
xenon CT CBF studies that included both occluded and nonoccluded measurements of high technical quality were included. Ninety patients presented with intracranial tumors (more than 80% meningioma), 43 patients showed extra-cranial tumors (more than 70% squamous cell carcinoma),
and 23 patients presented with ICA aneurysms (more than 65% cavernous sinus aneurysm).
The average age of these patients was 46 ± 17 years (range, 7 to 79). Mean arterial blood pressure and end-tidal
carbon dioxide are recorded in Table 1. Measurements were acquired before, during, and after each xenon CT CBF study.
BTOMethod
As described previously, a complete BTO examination consists of the following steps. After a baseline neurologic examination a four-vessel angiogram is performed, then a double-lumen catheter is introduced (Swan-Ganz, Edwards Laboratories, Annasco, Puerto Rico) into the femoral artery. The catheter is then advanced within the ICA to the level of the first or second cervical vertebral body. The patient
is given 5000 to 7000 U of heparin intravenously durin the procedure. While continuously measuring blood pres··
sure in the distallCA and intermittently measuring systemic blood pressure by an automatic cuff (Critikon Dynamap, Tampa, Fla), the intraarterial balloon is inflated until distal pressure falls and balloon deformation consistent with the vessel is observed. The patient undergoes a continuou.
neurologic examination for the initial 5 minutes and sub
-sequently at 4- to 5-minute intervals. The balloon remains
inflated over a 15-minute period but may be immediately deflated if the patient shows consistent neurologic altera-
-tion. If no neurologic alterations are observed during the BTO, the patient is transferred to the CT suite with the balloon deflated but still in place. Xenon CT CBF studies
are performed both with the balloon deflated and during a second 5-minute period of balloon reinflation.
Xenon CT CBF Measurement
CBF studies were performed using the xenon CT CBF
[image:2.613.125.493.103.278.2]AJNR: 15, May 1994
9800 scanner (General Electric Medical Systems, Milwau-kee, Wis). During the CBF studies the patients inhaled a gas mixture of 33% xenon/67% oxygen (Xe SCAN, Linde Medical Gases, Danbury, Conn). After two baseline scans the xenon enhancement was monitored with six scans during a 5-minute gas inhalation period (37). The radiod-ensity enhancement of brain tissue caused by the inhalation of stable xenon is used in a modified Kety equation (38) to calculate CBF.
Because each of our patients underwent both baseline (balloon deflated) and BTO (balloon inflated) studies, 312 xenon CT CBF studies were entered into the analysis. Each xenon CT CBF study included CBF calculations of two levels. Level 1 included the basal ganglia and paralleled the frontal skull base near the orbitomeatal line. Level 2 was a cut 2 to 3 em above the first level. In this study we concentrated on level 1. By focusing on mixed cortical flow values CBF data were analyzed by placing 22 to 24 contig-uous 2-cm regions of interest (each :::::314 pixels) within the cortical mantel (37) (Fig 1 ).
CBF Analysis
CBF was analyzed for both absolute and relative changes with BTO. To measure CBF corresponding to the three major vascular territories, the 2-cm regions of interest were grouped into three sets: anterior cerebral artery territory, middle cerebral artery territory (MCA), and posterior cere-bral artery (Fig 1 ).
Absolute Xenon CT CBF Changes
BTO-induced CBF changes in each region of interest were calculated using the absolute differences between
Level #2
--Baseline
CBF [cc/lOOml/min] 70
non occluded 60
50
40
ACA MCA
occluded
PCA PCA MCA ACA
- BTO 30 ...J..._ _ _ _ _ _ _ - + - - -
-Level #1
Baseline
70
60
50
40
1 2 J 4 S 6 7 8 9 10 II 12 13 14 IS 16 17 18 19 20 21 22
non occluded
. I
-
.
-occluded
. .
.
.
.
. .
..
.,.....
.
,
\.
.
t ,·:\::
.
~--~
ACA MCA PCA PCA MCA
--BTO 30~-- ---1 2 3 4 S 6 7 8 9 10 II 12 13 14 IS 16 17 18 19 20 21 22 23 24
CEREBRAL BLOOD FLOW 849
identical regions of interest in the baseline xenon CT CBF
study and the xenon CT CBF study during BTO. Values
were calculated for each 2-cm region of interest and the major vascular territories (39, 40).
MCA
Relative Xenon CT CBF Symmetry Changes in the MCA Territory
Degree of side-to-side asymmetry in the MCA territory
was calculated by the following equation:
I = (Cnon - Cocci) X
1 OO = (Cnon - Cocci X
asym (Csvg) (Cnon
+
Cocci) 100,[ 2 l
where lasym is index of side-to-side asymmetry in percent; Cnon is xenon CT CBF value (mL/1 00 g per minute) on the nonoccluded side; Cocci is xenon CT CBF value (mL/1 00 g per minute) on the occluded side; and Cavg is xenon CT CBF value (mL/ 1 00 g per minute) averaged between ipsi-lateral and contraipsi-lateral to BTO.
The index of side-to-side asymmetry (lasym) is positive if xenon CT CBF values are lower on the side of occlusion and negative if xenon CT CBF values are lower on the contralateral side. Xenon CT CBF studies revealing lasym values in the range of ± 10% are regarded as having symmetrical CBF referring to a control group of age-matched healthy volunteers (37). Group differences were tested for significance using the nonparametric Wilcoxon-Mann-Whitney test.
ACA
PCA
ACA
PCA
Fig. 1. Averaged CBF values (n = 156)
(+) in each 2-cm-circle region of interest on
two levels during baseline and BTO study.
Note significant CBF differences between baseline and BTO xenon CT CBF study(***,
[image:3.617.60.376.463.732.2]Classification
Quantitative and qualitative CBF responses to BTO were combined in an arbitrarily chosen classification. This clas-sification was based on the clinical significance of the CBF responses to BTO and resulted in three main classes (1, II, and Ill, and certain subclasses). Class I included patients
who showed both qualitative and quantitative signs of CBF compromise caused by BTO. Class II described patients who showed quantitative CBF compromise in combination with symmetrical CBF values or asymmetrical lower CBF on the contralateral side, and class Ill contained the rest of the patients who showed no clinically significant reduction of CBF during BTO. For the purpose of integrating the absolute (quantitative) and relative (qualitative) CBF changes, the CBF information was simplified in the follow-ing manner.
Absolute Xenon CT CBF Changes
The absolute change of CBF caused by BTO is catego-rized in increase (j) and decrease (1) on the side of occlusion and the contralateral side. The combination of side and change results in four different CBF response patterns: H.
jj,
l
j, jl
(occluded side/nonoccluded side).Relative Xenon CT CBF Symmetry Changes in the ,-\1CA Territory
lasym during the baseline xenon CT CBF study and BTO xenon CT CBF is described by two capital letters: the first for the baseline and the second for BTO: A indicates asymmetry of CBF with lower values on side of occlusion; B, balanced or symmetrical CBF; and C, contralateral lower values resulting in asymmetrical CBF. If CBF is asymmetric during both baseline and BTO and the lower value stays on the same side, that patient is labeled AA or CC. An indexed "1" indicates asymmetry increase caused by BTO, and an indexed "2" stands for decreased BTO asymmetry (A1A, A2A, C1C, and C2C). There are 11 possible types of CBF symmetry designations.
The combination of four absolute and 11 relative CBF response types theoretically results in 44 CBF response types. However, 10 types had to be excluded because they were physiologically not reasonable: AzAl j, ABl j, Aq j, BClj, C1qj, A1Ajl, BAjl, CAjl, CBjl, and CzCjl.
Patients with bilateral CBF decrease resulting in asym-metry with lower CBF values on the side of occlusion ( ...
AH) were gathered in class I, subclass Ia. Patients with only ipsilateral CBF decrease who also showed CBF asym-metry during BTO ( . . .
Al
j) were gathered in class I,subclass lb.
Class II consists of patients in whom CBF decrease did not result in asymmetry with lower flow on the ipsilateral side. Subclass lla consists of patients with bilateral CBF decrease; subclass lib includes patients with ipsilateral de-crease; and subclass lie with contralateral decrease.
Class Ill includes patients with bilateral CBF increase ( .. jj), patients with diminishing asymmetry (A2Aj
1
.
C2q j),and patients in which ipsilateral CBF increase resulted in CBF symmetry.
We used the CBF threshold of 30 mL/100 g per minute as a validation test for this arbitrary classification because this value designates the break point at which CBF in the MCA region is significantly less than normal CBF in a group of healthy volunteers (P < .05) (37). We summed up the patients in each class who showed CBF less than 30 mL/ 100 g per minute only because of BTO and the patients who showed CBF values below this threshold during base-line and during BTO.
Results
Absolute Hemispherical Xenon CT CBF Changes
The overall mean xenon CT CBF changes in the two levels of both hemispheres were moder-ate (Fig 1), -6 mL/100 g per minute on the side of occlusion and +2 mL/100 g per minute on the contralateral side. Individual CBF response within a region of interest to BTO is, however, more unpredictable and of greater magnitude. Ninety-five percent of CBF responses ranged between -29 and +21 mL/100 g per minute. On the side of occlusion, CBF decrease caused by BTO on both levels was highly significant in all 2-cm regions of interest of the MCA-supplied area. However, on level 1 of the side of occlusion, changes in the regions of interest of the anterior and posterior cerebral arteries were not as marked as changes observed within regions of interest supplied by the MCA (Fig 1). The more dramatic effect of BTO on the MCA territory led us to concentrate on these regions of interest during the following analysis.
Sixty-one of 156 (39%) patients showed a CBF drop on both sides caused by BTO. In 34 patients the bihemispherical decrease resulted in asym-metrical xenon CT CBF during BTO with lower flow on occluded side. Of the remaining 27 pa-tients, 20 were symmetric and 7 had lower CBF values on the contralateral side during BTO.
Thirty-seven of 156 (24%) patients demon-strated decreased xenon CT CBF values on the side of occlusion during BTO and increased flow on the contralateral side. In 27 of these patients lower ipsilateral CBF values were measured dur-ing BTO, and in 10 symmetric MCA CBF values were measured.
In 42 of 156 (27%) patients, we measured increased xenon CT CBF values in both
hemi-spheres during BTO (Fig 2). In 18 patients, the
bilateral increase resulted in asymmetrical CBF
with less flow on the occluded side. In 20 patients,
AJNR: 15, May 1994 CEREBRAL BLOOD FLOW 851
Fig. 2. Patient 122, 24-year-old woman, rhabdomyosarcoma right cavernous sinus. Xenon CT CBF study: baseline CT scan (left),
CBF before (middle) and during BTO (right). CBF showed symmetrical values greater than 30 mL/1 00 g per minute for the vascular territories before BTO and showed symmetry during BTO, with CBF increased bilaterally in response to BTO. CBF response type is
BBif.
Xe/CT CBF
tn
MCA territory
baseline BTO
non occl.
patients
(n)
occluded side
non occl. side
occluded
side side (n)
13 15 42 11
16 29 13
3 10 2 2
81
58
17
in four patients lower CBF values were observed on the contralateral side.
In 16 of 156 (10%) patients, MCA CBF in-creased on the side of occlusion and dein-creased on the contralateral side because of BTO.
Relative Xenon CT CBF Symmetry Changes jn the MCA TerrUory
Considering the entire group of patients (n =
156), there was a tight correlation (r = .79, P
<
type CBF < 30
cell OOg/min
A2A 2/13
A1A 2/15 B A 6/42 C A 4/11
AB
BB
CB
AC
BC
CIC
C2C 1/2
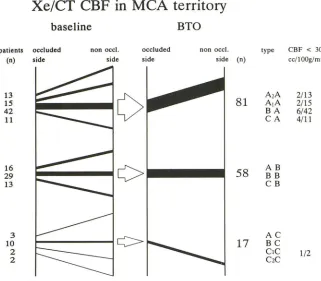
Fig. 3. CBF response pattern to BTO. Note number of CBF values less than 30
mL/1 00 g per minute associated especially
with .. . A CBF response type. The width of
line correlates with the number of patients.
Response types are described in text.
.001, b = .8) between observed BTO asymmetry values and recorded changes of asymmetry; this emphasizes that the asymmetry during BTO is caused not by preexisting CBF pattern but by the occlusion of the ICA.
[image:5.612.49.563.77.269.2] [image:5.612.57.378.326.607.2]patients had symmetric CBF defined by limits of lasym of ±10% (B . . . ), and 28 of 156 (18%) patients had lower CBF on the contralateral side to occlusion (C . . . ).
During BTO more than the half of all patients, 81 of 156 (52%), showed asymmetry with lower CBF on side of occlusion( ... A), 58 of 156 (37%) patients revealed symmetric CBF ( ... B), and 17 of 156 ( 11%) patients presented with asymmetric CBF showing lower values on the contralateral side( .. . C). By combining the BTO results with those of the baseline study, we classified 11 different types of CBF response to BTO.
Looking for the most common CBF response to BTO, we found 42 of 156 (27%) patients represented the "BA" group: no asymmetry dur-ing baseline xenon CT CBF study and CBF asym-metry during BTO with lower CBF values on the side of occlusion. Twenty-eight of 156 (18%) patients with asymmetrically lower CBF on the side of occlusion had asymmetrical C8F during baseline. Of these, 13 patients had a larger (A2A) and 15 had a smaller (A1A) degree of asymmetry. Twenty-nine of 156 (19%) patients showed no asymmetry at all, either during baseline or during 8TO, and were classified as type 88. Ten of 156 (6%) patients who revealed baseline C8F sym-metry, group 8C, showed contralateral lower C8F values during 8TO.
Twenty-eight of 156 ( 18%) patients started with significantly lower flow on the contralateral side to the later occlusion (CA, C8, and C,,2C), and only 4 of 28 continued to show asymmetry on the contralateral side during 8TO (C,,2C). C8F in most of these patients (24 of 28) became balanced (13 of 28, C8), or the side with lower flow values switched to the occluded side (11 of 28: CA).
Sixteen of 156 (10%) patients who started with significantly lower C8F values on the side to be occluded during the baseline xenon CT C8F study presented with symmetric C8F during 8TO (A8). Finally, in 3 of 156 (2%) patients, we found a switched asymmetry from lower CBF on the side of occlusion during baseline to contralateral lower C8F during 8TO (AC).
C/assifica tion
See Table 2 for final classification. Assessing the clinical significance of this arbitrary classifi-cation by enumerating the occurrence of C8F less than 30 mL/100 g per minute, 13 patients were found in class I (Fig 4). Ten of these patients
TABLE 2: Clinical classification in response to BTO
Class
Ia
lb
II a
lib
lie
Ill
Type
AtAH
A2AH
BAH CAH A1A!f
BA!j CA!j ABH BBH CB!! Aq! Bq!
c1q!
C2CH
BB!f CB!f ACf! BCf! CtCf!
allii
A2Ai!
ABi! BBi!
c2qr
Patients
34
27
27
10
6
52
CBF < 30,
BTO
6 (18%)
4(15%)
1 (4%)
CBF < 30,
BL andBTO
2(6%)
1 (4%)
1 (2%)"
Note.-BL indicates baseline; A, CBF lower on occluded side; B,
symmetrical CBF; C, CBF lower on contralateral side; 1o asymmetry
increased because of BTO; 2, asymmetry decreased because of BTO; and
!f, absolute CBF change (eg, decrease occluded side/increase nonoc
-cluded side).
• This patient tolerated BTO despite low flow resulting from subarach
-noid hemorrhage.
showed C8F less than 30 mL/100 g per minute only during 8TO, the other 3 patients showed C8F less than 30 mL/100 g per minute during baseline and during 8TO.
In class lla only one patient presented with C8F less than 30 mL/ 1 00 g per minute during 8TO on the side contralateral to occlusion.
Class Ill as well, only had one patient, who had recovered from a severe subarachnoid hemor-rhage after aneurysm rupture, with flow values less than 30 mL/ 100 g per minute before and during 8TO. Despite these low C8F values this patient tolerated the 8TO procedure without any clinical signs of additional neurologic deteriora-tion. 8TO revealed a slight C8F increase during BTO, and the preexisting asymmetry on the side of occlusion was reduced (A2A
jj).
Three addi-tional patients showed C8F less than 30 mL/100 g per minute on the contralateral side exclusively before 8TO. [image:6.612.315.559.91.370.2]AJNR: 15, May 1994
of occlusion, 14 (17%) patients showed CBF less than 30 mL/100 g per minute. We found that in
all patients (8 of 8) in whom more than 45% CBF
asymmetry with lower flow on the side of occlu-sion developed, CBF became less than 30 mL/ 100 g per minute in the MCA territory (Fig 5).
Discussion
Unilateral lCA occlusion has an abrupt and profound impact on the entire cerebral
circula-CEREBRAL BLOOD FLOW 853
tion. The distallCA pressure commonly falls from approximately 100 mm Hg to about 60 mm Hg with proximal vessel occlusion (29). Cerebral per-fusion pressure in one territory may drop even more precipitously if collaterals are not able to replace the supply of blood lost with lCA occlu-sion. Causes for CBF alteration are most likely found in preexisting extracranial occlusive vas-cular disease (41, 42), inherent morphologic in-sufficiencies of the circle of Willis (43, 44),
alter-Fig. 4. Patient 107, 61-year-old man, left maxilla squamous cell tumor with intracranial extension. Xenon CT CBF study: baseline CT scan (left), CBF before (middle) and during BTO (right). This patient showed symmetrical CBF greater than 30 mL/100 g per minute before BTO and dropped CBF on both sides resulting in asymmetry with flow values less than 30 mL/100 g per minute on the side of occlusion during BTO. CBF response type is BAH.
'i:i'
90-•
: > 10% > 30%: > 45%Fig. 5. lnterhemispherical asymmetry and MCA CBF on the occluded side during BTO. Note high sensitivity but low specific-ity when asymmetry threshold is 10% .
~
0
0
...
U'
~
II) "0 ·;;;
60-30
•
•
• •
•
•
-40
•
•
•
.
.
•
. .
..
..
..
.;
:
.•.
• •
.
• .. .1! •..\.
.
.
....
,
. ~....
•
•
•
•
•.
~.\.
.
.
•:.
••
I• • •
:
•
.-
~~...
:.
. • _ ... -:• • I .. : • I
. .
·~· :.. ..
..
.
.
..
..
·-
-
.
:fl57 v'V
-20 0 20 40
Asymmetry during BTO [%]
[image:7.615.47.562.224.413.2] [image:7.615.48.374.471.736.2]ation of the autonomic vascular innervation partly induced by ICA manipulation (45-48), or com-promised vasodilatory capacity most likely
re-lated to small vessel disease (42, 49). In addition,
large and small vessel narrowing induced by vaso-spasm caused by ruptured aneurysms (50), local brain edema, and mass effect caused by intracra-nial tumors may also result in flow alteration.
A series of mechanisms function to prevent ischemic brain tissue damage. First, in a phase of hemodynamic compensation (positron emis-sion tomography stage 1) (51), CBF is maintained by decreasing the peripheral cerebrovascular re-sistance. This slows down the mean transit time and increases cerebral blood volume (51-53). Second, if the vasodilatative capacity has been
exceeded (ie, cerebrovascular resistance has ·
reached its lowest value) and cerebral blood vol-ume expansion has peaked, CBF will drop pas-sively with a further fall in cerebral perfusion pressure as oxygen extraction fraction increases (54-56). This is referred to as positron emission tomography stage 2 (51). With an oxygen extrac-tion fracextrac-tion of approximately 60% and a minimal cerebrovascular resistance (55), any further drop in cerebral perfusion pressure, CBF, or cerebral blood volume will cause the cerebral metabolic rate of oxygen to decrease, resulting in neurologic deficits and subsequently in neuronal damage (57). In the past decades, reliable CBF thresholds have been established. At CBF values less than 18 to 23 mL/ 1 00 g per minute neuronal function gradually decreases ( 41, 58-60) and neurologic deficits occur. CBF values less than 8 to 15 mL/ 100 g per minute in mixed gray and white matter are tolerated for a very short period before irre-versible infarction occurs (15, 50, 61-63). Our results are consistent with these earlier clinical and experimental studies, because no patient who passed the clinical examination during BTO with-out developing neurologic deficit had CBF values in the MCA territory less than 20 mL/100 g per minute.
In our studies we are most concerned about 15
of our 156 (10%) patients who passed the
neu-rologic examination during BTO but showed xe-non CT CBF values between 20 and 30 mL/ 100 g per minute. CBF values less than 30 mL/100 g per minute are not only more than 2 SD below the mean CBF shown in normal studies (37), but they also describe the maximal deterioration of CBF possible without neurologic deficits. These individuals have, therefore, entered a state of hemodynamic decompensation consistent with
positron em1ss1on tomography stage 2 (51). In this state cerebral perfusion pressure is insuffi-cient, cerebral vascular resistance is minimized, and cerebral blood volume maximized, CBF drops, and an increasing oxygen extraction frac-tion is the only protecfrac-tion to prevent ischemic damage. These criteria should identify a group in whom cerebral perfusion depends on blood pres-sure. Such patients should benefit from bypass surgery and intraoperative brain protection, in-cluding pharmacologic and hypothermic proce-dures (12, 28) if temporary or permanent ICA occlusion should become necessary.
However, in cases in which CBF is below the threshold of 30 mL/ 100 g per minute before BTO and does not change with it, ICA occlusion with-out extracranial/intracranial bypass, in our eyes, should be tolerable. In these patients cerebrovas-cular vasodilatative reserve capacity was main-tained, although the absolute CBF level was re-duced presumably as a result of decreased met-abolic demand. Guided by this concept and clinical appearance, one elderly patient who suf-fered subarachnoid hemorrhage and had CBF less than 30 mL/100 g per minute before and during BTO (class Ill), underwent ICA sacrifice without subsequently developing cerebral ischemia.
Recent studies (33-35) concentrating on the assessment of qualitative CBF changes during BTO have recommended CBF asymmetry eval-uation as a measure for stroke risk after perma-nent ICA occlusion. Because CBF in healthy con-trol subjects is symmetrically distributed between
both hemispheres in a range of
±
10% variation,larger deviations with BTO are believed to indi-cate CBF maldistribution between both hemi-spheres (64-68). The shortcomings of solely qual-itative CBF evaluation are the increased number of false-positive and false-negative decisions re-garding the inability to proceed directly to ICA
occlusion. It would be oversensitive to consider
all patients who showed significant asymmetrical CBF during BTO as being at an elevated stroke risk after ICA occlusion, because it withholds
from 81 (52%) patients the option of a relatively
safe direct ICA sacrifice, whereas only 14 patients
in this group had CBF less than 30 mL/ 100 g per
minute. Raising the asymmetry threshold in-creases the specificity as the sensitivity
de-creases. Above 45% asymmetry, we found that
all patients (n
=
8) had CBF values less than 30Com-AJNR: 15, May 1994
bining a baseline CBF study with the BTO CBF study and considering only qualitative CBF changes as predictive for CBF compromise after straight ICA sacrifice, 53 (34%) of our patients would have been identified to be at high risk. In this group, however, CBF in only 10 patients fell below 30 mL/100 g per minute.
Our current protocol, which divides patients into high-, moderate-, and low-risk groups, com-bines neurologic assessment during BTO with identification of new regions with absolute low CBF values (<30 mL/1 00 g per minute) (28). In applying these criteria in the surgical decision-making process, the rate of flow-related strokes that cause persistent neurologic deficits after
per-manent ICA occlusion dropped to 3% (1 of 30).
Conclusion
An exclusively qualitative assessment of CBF either during BTO alone or before and during BTO has not enough efficacy to guide individual case management properly. We are convinced that a quantitative CBF study before and during BTO followed by a detailed analysis of absolute CBF changes and symmetry changes identi-fies the different types of CBF response, and determines patients' location within their specific CBF -cerebral perfusion pressure autoregulation curves.
Acknowledgments
We thank Laligam Sekhar, MD, Donald Wright, MD
(Department of Neurosurgery), and lvo Janecka, MD
(De-partment of Otorhinolaryngology) for allowing their pa-tients to be included in this study. We also thank Mark Linskey, MD (Department of Neurosurgery), Joseph Hor-ton, MD, David Johnson, MD, William Hirsch, MD, Jeffery Hogg, MD, and Susan Kemp, MD (Department of Radiol-ogy) for collaborative and technical support in performing BTO studies. We are grateful for the editorial assistance of Pat Fritz.
References
1. Andrews JC, Valavanis A, Fisch U. Management of the internal carotid artery in surgery of the skull base. Laryngoscope 1989;99: 1224-1229
2. Berenstein A, Ransohoff J, Kupersmith M, Flamm E, Graeb D.
Transvascular treatment of giant aneurysm of the cavernous carotid
and vertebral arteries. Surg Neuro/1984;21 :3-12
3. Dandy WE. Results following ligation of the internal carotid artery. Arch Surg 1942;45:521-533
4. Debrun G, Fox AJ, Drake C, Peerless S, Girvin J, Ferguson G. Giant
unclippable aneurysms: treatment with detachable balloons. AJNR Am J Neuroradio/1981;2:167-173
CEREBRAL BLOOD FLOW 855
5. Dorrance GM. Ligation of the great vessels of the neck. Ann Surg
1934;99:721-742
6. Fox AJ, Viiiuela F, Pelz DM, et al. Use of detachable balloons for
proximal artery occlusion in the treatment of unclippable cerebral aneurysms. J Neurosurg 1987;66:40-46
7. Gelber BR, Sundt TM Jr. Treatment of intracavernous aneurysms by combined internal carotid ligation and extra- to intracranial bypass.
J Neurosurg 1980;52: 1-10
8. Landoldt AM, Millikan CH. Pathogenesis of cerebral infarction
sec-ondary to mechanical carotid artery occlusion. Stroke 1970; 1:52-62
9. Leech PJ, Miller JD, Fitch W, Barker J. Cerebral blood flow, internal
carotid artery pressure, and the EEG as a guide to the safety of carotid ligation. J Neural Neurosurg Psychiatry 1974;37:854-862
I 0. Nishioka H. Report on the cooperative study of intracranial aneurysms and subarachnoid hemorrhage. Section VIII, Part 1. Results of treat
-ment of intracranial aneurysms by occlusion of the carotid artery in the neck. J Neurosurg 1966;25:660-682
11. Schorstein J. Carotid ligation in saccular intracranial aneurysm. Br J
Surg 1940;28:50-70
12. Sen C, Sekhar LN. Direct vein graft reconstruction of the cavernous,
petrous and upper cervical internal carotid artery: lessons learned
from 30 cases. Neurosurgery 1992;30:732-743
13. Serbinenko FA. Balloon catheterization and occlusion of major cer
e-bral vessels. J Neurosurg 197 4;41: 125-145
14. Sundt TM Jr, Piepgras DG. Surgical approach to giant intracranial
aneurysms. Operative experience with 80 cases. J Neurosurg
1979;51 :731-742
15. Beatty RA, Richardson AE. Predicting intolerance to common artery
ligation by carotid angiography. J Neurosurg 1968;28:9-13
16. Ehrenfeld WK, Stoney RJ, Wylie EJ. Relation of carotid stump pressure to safety of carotid ligation. Surgery 1983;93:299-305
17. Gurdjian ES, Webster JE, Martin FA. Carotid compression in the
neck. Results and significance in carotid ligation. JAMA
1957;163:1030-1036
18. Hacke W, Zeumer H, Berg-Dammer E. Monitoring of hemispheric or brainstem functions with neurophysiologic methods during interv
en-tional neuroradiology. AJNR Am J Neuroradio/1983;4:382-384
19. Kwaan JH, Peterson GJ, Connolly JE. Stump pressure. An unreliable
guide for shunting during carotid endarterectomy. Arch Surg
1985;115:1083-1085
20. Matas R. Testing the efficiency of the collateral circulation as a
preliminary to the occlusion of the great surgical arteries. JAMA
1914;63:1441-1447
21. Meinig G, Gunther P, Ulrich P. Reduced risk of internal carotid artery
ligation after balloon occlusion test. Neurosurg Rev 1982;5:95-98 22. Morioka M, Matsushima T, Fujii K, Fukui M, Hasuo K, Hisashi K.
Balloon test occlusion of the internal carotid artery with monitoring of compressed spectral arrays (CSAs) of electroencephalogram. Acta Neurochir (Wien) 1989; 101:29-34
23. Sundt TM Jr, Sharbrough FW, Anderson RE, Michenfelder JD. Cerebral blood flow measurements and electroencephalograms during carotidendarterectomy. J Neurosurg 1974;41 :310-320
24. Wilkinson HA, Wright RL, Sweet WH. Correlation of reduction in pressure and angiographic cross-filling with tolerance of carotid artery
occlusion. J Neurosurg 1965;22:241-245
25. DeVries EJ, Sekhar LN, Horton JA, et al. A new method to predict safe resection of the internal carotid artery. Laryngoscope
1990; 100:583-588
26. Erba SM, Horton JA, Latchaw RE, et al. Balloon test occlusion of the internal carotid artery with stable xenon/CT cerebral blood flow imaging. AJNR Am J Neuroradiol 1988;9:533-538
27. Johnson DW, Stringer WA, Marks MP, Yonas H, Good WF, Gur D. Stable xenon CT cerebral blood flow imaging: rationale for and role
in clinical decision making. AJNR Am J Neuroradio/1991;12:201 -213
28. Linskey ME, Sekhar LN, Horton JA, Hirsch WL, Yonas H. Aneurysms of the intracavernous carotid artery: a multidisciplinary approach to
29. Steed DL, Webster MW, deVries EJ, et al. Clinical observations on
the effect of carotid artery occlusion on cerebral blood flow mapped
by xenon computed tomography and its correlation with carotid
artery back pressure. J Vase Surg 1990; 11 :38-44
30. Gur D, Good WF, Wolfson SK Jr, Yonas H, Shabason L. In-vivo
mapping of local cerebral blood flow by xenon-enhanced computed tomography. Science 1982;215:267-268
31. Yonas H, Good WF, Gur D, et al. Mapping cerebral blood flow by
xenon-enhanced computed tomography. Radiology 1984; 152:425-442
32. Yonas H, Gur D, Latchaw RE, Wolfson SK. Xenon computed tom
o-graphic blood flow mapping. In Wood JH, ed. Cerebral blood flow:
physiologic and clinical aspects. New York: McGraw Hill,
1987:220-242
33. Monsein LH, Jeffrey PJ, van Heerden BB, et al. Assessing adequacy
of collateral circulation during balloon test occlusion of the internal
carotid artery with 99
mTc-HMPAO SPECT. AJNR Am J Neuroradiol
1991;12:1045-1051
34. Moody EB, Dawson RC, Sandler MP. 99
mTc-HMPAO SPECT imaging in interventional neuroradiology: Validation of balloon test occlusion.
AJNR Am J Neuroradiol 1991; 12:1043-1044
35. Peterman SB, Taylor A, Hoffman JC. Improved detection of cerebral
hypoperfusion with internal carotid balloon test occlusion and 99
m Tc-HMPAO cerebral perfusion SPECT imaging. AJNR Am J Neuroradiol
1991 ;12: 1035-1041
36. Yonas H, Linskey M, Johnson DW, et al. Internal carotid balloon test
occlusion does require quantitative CBF. AJNR Am J Neuroradiol
1992;13:1147-1148
37. Yonas H, Darby JM, Marks EC, Durham SR, Maxwell C. CBF
measured by Xe-CT: approach to analysis and normal values. J Cereb Blood Flow />letab 1991 ;11 :716-725
38. Kety SS. The theory and applications of the exchange of inert gas at the lung and tissue. Pharmacal Rev 1951 ;3: 1-41
39. Berman SA, Hayman LA, Hinck VC. Correlation of CT cerebral
vascular territories with function: 3. Middle cerebral artery. AJNR Am J Neuroradiol1984;5: 161-166
40. Kretschmann HJ, Weinrich W. Neuroanatomy and cranial computed
tomography. New York: Thieme, 1986:60-74
41. Boysen G. Cerebral hemodynamics in carotid surgery. Acta Neural
Scand 1973;52(suppl): 1-84
42. Vorstrup S, Paulson OB, Lassen NA. How to identify hemodynamic
cases. In Spetzler RF, ed. Cerebral revascularization. New York:
Thieme-Stratton, 1985:120-127
43. Day AL. Arterial distributions and variants. In Wood JH, ed. Cerebral
blood flow: physiologic and clinical aspects. New York: McGraw Hill,
1987:19-36
44. Lang J, Bushe KA, Buschmann W, Linnert D. Kopf, Teil B, Gehirn-und augenschiidel. In Lanz T, Wachsmuth W, eds. Praktische anato
-mie. Ein Lehr-und hilfsbuch der anatomischen grundlagen arztlichen
handelns. Berlin: Springer, 1979:245-269
45. Fitch W, MacKenzie ET, Harper AM. Effects of decreasing arterial blood pressure on cerebral blood flow in the baboon. Circ Res
1975;37:550-557
46. Kobayashi A, Waltz AG, Rhoton AL Jr. Effects of stimulation of
cervical sympathetic nerves on cortical blood flow and vascular
reactivity. Neurology 1971 ;21 :297-302
47. Suzuki N, Hardebo JE. Anatomical basis for a parasympathetic and sensory innervation of the intracranial segment of the internal carotid artery in man. J Neural Sci 1991;104:19-31
48. von Overbeeke JJ, Dujovny M, Dragovic L, Ausman JJ. Anatomy of the sympathetic pathways in the carotid canal. Neurosurgery
1991 ;29:838-844
49. Holl K, Nemati N, Heissler H, et al. Chronic cerebrovascular
insuffi-ciency on the xenon CT scan. Neurosurg Rev 1989;12:205-210
50. Fukui MB, Johnson DW, Yonas H, Sekhar L, Latchaw RE, Pentheny
S. Xe/CT cerebral blood flow evaluation of delayed symptomatic
cerebral ischemia after subarachnoid hemorrhage. AJNR Am J
Neu-roradiol1992; 13:265-270
51. Powers WJ, Grubb RL, Baker RP, Mintun MA, Raichle ME. Regional
cerebral blood flow and metabolism in reversible ischemia due to vasospasm: determination by positron emission tomography. J
Neu-rosurg 1985;62:539-546
52. Weiller C, Ringelstein B, Reiche W, Bull U. Clinical and hemodynamic aspects of low-flow infarcts. Stroke 1991;22:1117-1123
53. Yamauchi H, Fukuyama H, Kimura J, Junji K, Kameyama M. Hemo-dynamics in internal carotid artery occlusion examined by positron
emission tomography. Stroke 1990;21:1400-1406
54. Herold S, Brown MM, Frackowiak RSJ, Mansfield AO, Thomas DJ,
Marshall J. Assessment of cerebral hemodynamic reserve: correlation
between PET parameters and C02 reactivity measured by intravenous
133
xenon injection technique. J Neural Neurosurg Psychiatry
1988;51: 1045-1050
55. Kanno I, Uemura K, Higano S, et al. Oxygen extraction fraction at
maximally vasodilated tissue in the ischemic brain estimated from the regional C02 responsiveness measured by positron emission
tomography. J Cereb Blood Flow />letab 1988;8:227-235
56. Yamauchi H, Fukuyama H, Fujimoto N, Nabatame H, Kimura J. Significance of low perfusion with increased oxygen extraction frac
-tion in a case of internal carotid artery stenosis. Stroke
1992;23:431-432
57. Powers WJ. Cerebral hemodynamics in ischemic cerebrovascular
disease. Ann Neuro11991;29:231-240
58. Alexander SC, Smith TC, Strobel G, Stephan GW, Wollman H.
Cerebral carbohydrate metabolism of man during respiratory and metabolic alkalosis. J Appl Physiol1968;24:66-72
59. Olsen TS. Regional cerebral blood flow after occlusion of the middle
cerebral artery. Acta Neural Scand 1986;73:321-337
60. Yonas H, Sekhar LN, Johnson DW, Gur D. Determination of irrevers-ible ischemia by xenon-enhanced computed tomographic monitoring of cerebral blood flow in patients with symptomatic vasospasm.
Neurosurgery 1989;24:368-372
61. Astrup J, Symon L, Branston NM, Lassen NA. Cortical evoked potential and extracellular K+ and H+ at critical levels of brain
ischemia. Stroke 1977;8:51-57
62. Yonas H, Gur D, Claasen D, Wolfson SK, Moossy J. Stable xenon
enhanced computed tomography in the study of clinical and
patho-logic correlates of focal ischemia in baboons. Stroke 1988; 19:228-238
63. Morawetz RB, Marcoux FW, Crowell RM, DeGirolami U, Halsey JH. Identical thresholds for cerebral ischemia in white and grey matter.
Acta Neural Scand 1979;60(suppl):282-283
64. De Weerd AW, Veering MM, Mosmans PCM, van Huffelen AC,
Tulleken C:AF, Jonkman EJ. Effect of the extra-intracranial (STA-MCA) arterial anastomosis on EEG and cerebral blood flow. A
controlled study of patients with unilateral cerebral ischemia. Stroke
1982;13:674-679
65. Gratz) 0, Rem J, Muller HR, Radue EW, Muller-Brand J. Cerebral blood flow and common carotid flow in neurologically asymptomatic carotid endarterectomy patients. Neural Res 1990;12:26-28
66. Mosmans PCM, Veering MM, Jonkman EJ. lSI values and interhem-ispheric differences in patients with ischemic cerebrovascular disease:
Correlations with clinical and angiographic findings. Stroke
1986;17:58-64
67. Risberg J, Halsey JH, Wills EL, Wilson EM. Hemispheric specialization
in normal man studied by bilateral measurements of the regional
cerebral blood flow. Brain 1975;98:511-524
68. Robertson WM, Welch KM, Tilley BC, Ewing JR. Cerebral blood flow
asymmetry in the detection of extracranial cerebrovascular disease.