Dynamic Perfusion CT: Optimizing the
Temporal Resolution and Contrast Volume for
Calculation of Perfusion CT Parameters in
Stroke Patients
Max Wintermark, Wade S. Smith, Nerissa U. Ko, Marcel Quist, Pierre Schnyder, and William P. Dillon
BACKGROUND AND PURPOSE:Numerous parameters are involved in dynamic perfusion CT (PCT). We assessed the influence of the temporal sampling rate and the volume of contrast material.
METHODS: Sixty patients with ischemic hemispheric stroke lasting>12 hours underwent PCT. Groups of 15 patients each received 30, 40, 50, or 60 mL of contrast agent. Regional cerebral blood volume (rCBV), regional cerebral blood flow (rCBF), mean transit time (MTT), and time-to-peak (TTP) maps were calculated for temporal sampling intervals of 0.5, 1, 2, 3, 4, 5, and 6 seconds. Results were statistically compared. Signal-to-noise ratios (SNRs), duration of arterial entrance to venous exit, and radiation dose were also assessed.
RESULTS: Increasing temporal sampling intervals lead to significant overestimation of rCBV, rCBF, and TTP and significant underestimation of MTT compared with values for an interval of 1 second. Maximal allowable intervals to avoid these effects were 2, 3, 3, and 4 seconds for 30, 40, 50, and 60-mL boluses, respectively. Venous exit of contrast material occurred in 97.5% of patients after 36, 42, 42, and 48 seconds, respectively, for the four volumes. SNRs did not differ with volume. The effective radiation dose varied between 0.852 and 1.867 mSv, depending on the protocol. The cine mode with two 40-mL boluses and the toggling-table technique with one 60-mL bolus had the lowest doses.
CONCLUSION: Temporal sampling intervals greater than 1 second can be used without altering the quantitative accuracy of PCT. Increased sampling intervals reduce the radiation dose and may allow for increased spatial coverage.
The advent of multidetector-row CT (MDCT) has recently afforded a renewal of perfusion CT (PCT) techniques in the detection of stroke. Combined with CT angiography (CTA), PCT provides a comprehen-sive and accurate noninvacomprehen-sive survey of the site of arterial occlusion and its hemodynamic and
patho-physiologic repercussions in the brain parenchyma of patients with symptoms of acute stroke (1, 2).
PCT relies on the extraction of functional rather than morphologic information from the CT data. Two PCT techniques are currently in practice: whole-brain PCT and dynamic PCT. Whole-brain PCT provides in-formation related to cerebral blood volume (CBV), and thus about the infarct core, but not about the ischemic penumbra, which is the target of acute stroke treatment (3–5). Dynamic PCT involves the dynamic acquisition of sequential CT sections in cine mode during the intravenous administration of iodinated contrast ma-terial. Dynamic PCT data analyzed according to the central volume principle has the major advantage of allowing the assessment of both cerebral blood flow (CBF) and CBV in a robust and reproducible quan-titative way (6–9). Thus, the technique provides in-sight into cerebral vascular autoregulation and isch-emic penumbra (10, 11). However, this technique is currently limited by the volume of contrast material
Received July 21, 2003; accepted after revision October 10. Dr Wintermark’s fellowship at UCSF was supported by generous grants from the Swiss Society of Radiology, the Socie´te´ Aca-de´mique Vaudoise and the SICPA Foundation.
From the Department of Radiology, Neuroradiology Section (M.W., W.P.D.), and the Department of Neurology, Neurovascular Service (W.S.S., N.U.K.), University of California, San Francisco; the Department of Diagnostic and Interventional Radiology, Uni-versity Hospital Center, Lausanne, Switzerland (M.W., P.S.); and the Medical IT–Advanced Development, Philips Medical Systems, Best, the Netherlands (M.Q.).
Address reprint requests to Max Wintermark, MD, Department of Diagnostic and Interventional Radiology, University Hospital Center, CHUV - BH07, CH - 1011 Lausanne, Switzerland.
©American Society of Neuroradiology
and the radiation dose in the evaluation of selected portions of the brain, which are typically 40 mm thick. The desire for increased spatial coverage and re-duced radiation dose has resulted in various dynamic PCT protocols (10–13). However, the effect of the acquisition parameters on the accuracy of PCT results has not been systematically evaluated. The purpose of our study was to assess the impact of varying the temporal sampling rate and the volume of contrast material on the accuracy of calculated regional CBF (rCBF), regional CBV (rCBV), mean transit time (MTT), and time to peak (TTP).
Methods Study Design
Under the auspices of our institutional review board, we reviewed imaging data from patient studies obtained as part of standard clinical care for stroke. In our institution, patients with suspected acute or subacute stroke undergo routine non-enhanced cerebral PCT at two cross-sectional positions, CTA of the cervical and intracranial vessels, and a contrast-enhanced cerebral CT. Informed consent was not required.
Between January and May 2003, 147 patients presented to the emergency room with strokelike symptoms and underwent our standard-of-care stroke CT protocol. Their data were in-cluded in this analysis if the patient presented to the emergency department with findings suggestive of hemispheric stroke of 12-hour duration or longer, if there was no evidence of intra-cerebral hemorrhage, and if a follow-up CT or MR image confirmed the final diagnosis of ischemic hemispheric stroke. Particular attention was devoted to the bolus volume used for the PCT examination. We identified 60 patients who fulfilled the inclusion criteria and whose PCT examinations varied only in the volume of contrast material. They included 33 men and 27 women aged 68⫾12 years. The mean time of presentation was 18 ⫾ 5 hours. The occluded arterial territory was the middle cerebral artery in 42, the anterior cerebral artery in 10, and the posterior cerebral artery in eight.
Imaging Protocol
Two successive PCT series were performed between the nonenhanced study and the CTA, separated by 5 minutes. PCT consisted of a 45-second series, with 45 gantry rotations per-formed in cine mode during the intravenous administration of iodinated contrast material. The temporal sampling rate was one rotation of the gantry per second on acquisition. Images were reconstructed at a temporal sampling rate of one image per second, resulting in a series of 45 images for each assessed section. Images were also reconstructed at a temporal sampling rate of two images per second, resulting in a series of 89 images for each assessed section location.
MDCT technology permitted the assessment of two adja-cent, 10-mm-thick sections for each series. Two 10-mm-thick sections were preferred to four adjacent, 5-mm-thick sections per location to maximize the signal-to-noise ratio with the same acquisition parameters. The two sections of the first PCT series were at the level of the third ventricle and the basal ganglia; these were positioned above the orbits to protect the lenses. The second PCT series was selected at a level 3.5 cm rostral to the first section of the first series.
For each series of PCT, a bolus of iohexol (Omnipaque, 300 mg/mL of iodine; Amersham Health, Princeton, NJ) was ad-ministered into an antecubital vein by using a power injector at an injection rate of 4 mL/s. The acquisition parameters for both PCT studies included 80 kVp and 120 mAs. CT scanning was initiated 7 seconds after the injection. The time delay before
contrast material reached the brain parenchyma allowed the acquisition of baseline images without contrast enhancement. In all patients, the PCT examinations varied only in the volume of contrast material used for the bolus. The patients were assigned to four groups of 15 each based on the volume of contrast material: group 1, 30 mL; group 2, 40 mL; group 3, 50 mL; and group 4, 60 mL.
Data Processing
PCT data were analyzed by using PCT prototype software (Philips Medical Systems, Best, the Netherlands). This software relies on the central volume principle, which is the most accu-rate method for low injection accu-rates of iodinated contrast material (14). After correcting for motion and reducing noise with an anisotropic, edge-preserving spatial filter, the software applies least-mean-squares fitting to obtain mathematic de-scriptions of the time-attenuation curves. Then, it applies a closed-form (noniterative) deconvolution to calculate the MTT map (15–17). This operation requires a reference arterial input function, which the software selects in a region of interest (ROI) that the user draws around the anterior cerebral artery. The rCBV map is calculated from the area under the time-enhancement curves. It relies on a quantitative measurement of the partial volume averaging effect, taking into account the lack of partial-averaging effect at the center of the large superior sagittal venous sinus (18, 19). Finally, a simple equation com-bining rCBV and MTT values allows the calculation of rCBF, as follows: rCBF ⫽ rCBV/MTT (15–17). The rCBF results afforded by the mathematic method of the software have been validated as being quantitatively accurate, as compared with comparison with stable xenon CT results (6). TTP maps were also measured.
For each group of patients, perfusion parameters were cal-culated by analyzing PCT data with seven temporal sampling intervals at 1 second (the criterion standard); at 0.5 second; and at 2, 3, 4, 5, and 6 seconds. From the 45 images acquired at one image per second, images were selected to calculate the pa-rameter maps as follows: 1) For the sampling interval of 0.5 second, 89 PCT images were reconstructed. 2) For 2 seconds, one image was selected from every two in the raw PCT series of 45 images, resulting in a total of 23 images. 3) For 3 seconds, one image was selected from every three in the raw series, for a total of 15 images. 4) For 4 seconds, one image was selected from every four in the raw series, for a total of 12 images. 5) For 5 seconds, one image was selected from every five in the raw series, for a total of nine images. 6) For 6 seconds, one image was selected from every six in the raw series, for a total of eight images.
Data Analysis
The principal endpoint was the PCT result. Secondary end-points included the signal-to-noise ratio, the duration of the PCT, and the radiation dose.
rCBV, MTT, rCBF and TTP maps were calculated for each data set. For each patient, similar ROIs of approximately 200 mm2were positioned on each of the seven temporal sampling
interval datasets over the same anatomic features: 1) normal cortical gray matter (four ROIs for each section in each pa-tient), 2) normal white matter (four ROIs for each section in each patient), 3) head of the caudate nucleus for each side (two ROIs in each patient), 4) lentiform nuclei for each side (two ROIs in each patient). An ROI was drawn to include the hypoattenuating ischemic area shown on the conventional non-enhanced CT scan in the volume of ischemic stroke. A large ROI was drawn to sample the asymptomatic hemisphere op-posite that of the ischemic stroke.
arterial pixel, and in the reference venous pixels. The time of entrance of the contrast material in the brain was designated as the moment when contrast enhancement in the arterial ROI was 10% above baseline precontrast values.
Venous and ischemic times of exit of the contrast material were designated when the attenuation value in the sagittal sinus ROI and ischemic ROI, respectively, decreased by one third of the total attenuation difference between baseline and peak values in the venous or infarction ROIs. This threshold was selected for accurate curve fitting of the raw data with the software.
After contrast enhancement, X-ray interaction with soft tis-sues at 80 kVp is related to the photoelectric effect due to the 33-keV k-edge of the iodine in the contrast material. Before contrast enhancement, X-ray interaction is mainly due to the Compton effect. Thus, the use of various bolus volumes may theoretically influence the relative enhancement with respect to background noise (20). To evaluate the effect of volume on the degree of enhancement and on background noise, we se-lected a baseline image and the peak image in the PCT series for the seven temporal sampling intervals for each patient. For each section, we determined the X-ray attenuation (mean and standard deviation [SD] in Hounsfield units) in an ROI that included the whole asymptomatic hemisphere opposite the ischemic stroke. For each temporal sampling intervals, an im-age-quality ratio was defined as follows: imim-age-quality ratio⫽ (peak mean/peak SD)/(baseline mean/baseline SD).
A high image-quality ratio indicated a greater increase in con-trast enhancement compared with the noise increase after the administration of contrast material.
The evaluation of the radiation dose delivered by the differ-ent PCT protocols was calculated in conformity with the rules of the US Food and Drug Administration and the European Guidelines on Quality Criteria for Computed Tomography (21). The maximum absorbed dose to the brain was obtained by multiplying the total mAs locally delivered at the level of the perfusion images by the normalized and weighted CT dose index, which is 0.070 mGy/mAs at 80 kVp (22). To estimate the stochastic risks associated with the use of ionizing radiation, the effective radiation dose was calculated from the dose-length product of the acquisitions by using a conversion factor of 0.0030 mSv/(mGy⫻cm).
Statistical Analysis
PCT results and other parameters were compared among the four patient groups and the seven temporal sampling in-tervals by using Kruskal-Wallis tests. When results were signif-icant, each dataset was compared with the reference dataset (one image per second) by using Wilcoxon (Mann-Whitney) tests. The significance level was set at .01 to account for the multiple sampling (Bonferroni correction).
Results
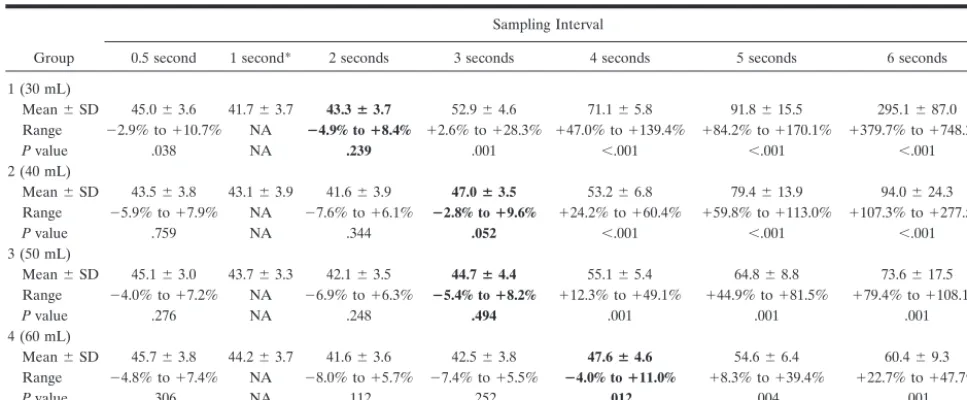
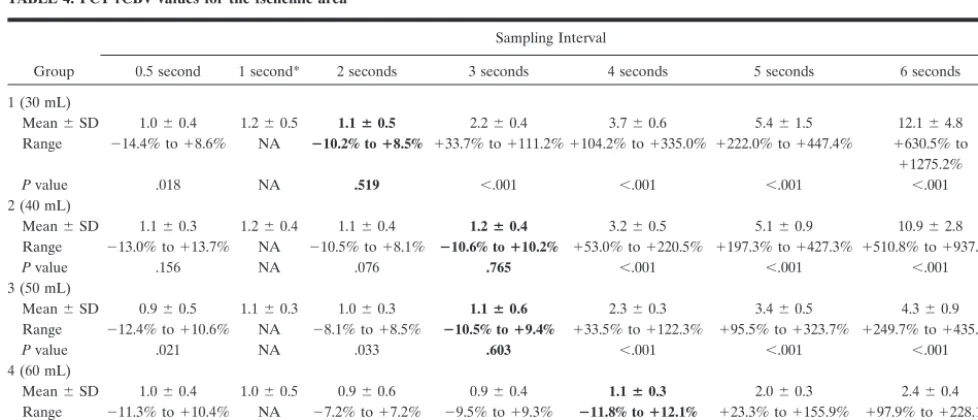
PCT Results and Temporal Sampling Intervals PCT rCBF values in the healthy hemisphere are reported in Table 1. rCBF values were significantly overestimated compared with reference values when temporal sampling interval was more than 2, 3, 3, and 4 seconds for the 30, 40, 50, and 60 mL bolus volumes, respectively. Similarly, PCT rCBF values in the isch-emic area are reported in Table 2. The thresholds beyond which rCBF values were overestimated were 2, 3, 3, and 4 seconds for the 30, 40, 50, and 60 mL volumes, respectively.
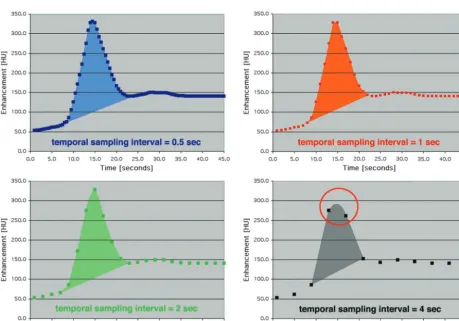
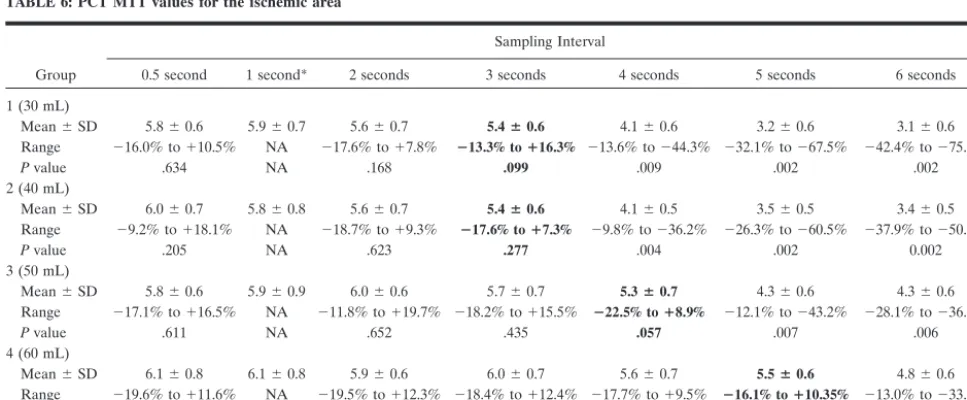
The overestimation of rCBF values with sparsing sampling resulted from both the overestimation of rCBV and the underestimation of MTT. As demon-strated in Figure 1, areas under the curves were un-derestimated for higher temporal sampling intervals. This underestimation was more pronounced in the reference venous pixel (denominator) than in paren-chymatous pixels (numerator), resulting in an overes-timation of the rCBV values (Tables 3 and 4). On the other hand, increasing the temporal sampling interval beyond a threshold led to an underestimation of MTT values (Tables 5 and 6) and an overestimation of TTP values.
[image:3.603.53.537.70.270.2]The absolute PCT results were similarly altered in the healthy hemisphere and in the ischemic area TABLE 1: PCT rCBF values for the healthy hemisphere
Group
Sampling Interval
0.5 second 1 second* 2 seconds 3 seconds 4 seconds 5 seconds 6 seconds
1 (30 mL)
Mean⫾SD 45.0⫾3.6 41.7⫾3.7 43.3ⴞ3.7 52.9⫾4.6 71.1⫾5.8 91.8⫾15.5 295.1⫾87.0
Range ⫺2.9% to⫹10.7% NA ⴚ4.9% toⴙ8.4% ⫹2.6% to⫹28.3% ⫹47.0% to⫹139.4% ⫹84.2% to⫹170.1% ⫹379.7% to⫹748.2%
Pvalue .038 NA .239 .001 ⬍.001 ⬍.001 ⬍.001
2 (40 mL)
Mean⫾SD 43.5⫾3.8 43.1⫾3.9 41.6⫾3.9 47.0ⴞ3.5 53.2⫾6.8 79.4⫾13.9 94.0⫾24.3
Range ⫺5.9% to⫹7.9% NA ⫺7.6% to⫹6.1% ⴚ2.8% toⴙ9.6% ⫹24.2% to⫹60.4% ⫹59.8% to⫹113.0% ⫹107.3% to⫹277.5%
Pvalue .759 NA .344 .052 ⬍.001 ⬍.001 ⬍.001
3 (50 mL)
Mean⫾SD 45.1⫾3.0 43.7⫾3.3 42.1⫾3.5 44.7ⴞ4.4 55.1⫾5.4 64.8⫾8.8 73.6⫾17.5
Range ⫺4.0% to⫹7.2% NA ⫺6.9% to⫹6.3% ⴚ5.4% toⴙ8.2% ⫹12.3% to⫹49.1% ⫹44.9% to⫹81.5% ⫹79.4% to⫹108.1%
Pvalue .276 NA .248 .494 .001 .001 .001
4 (60 mL)
Mean⫾SD 45.7⫾3.8 44.2⫾3.7 41.6⫾3.6 42.5⫾3.8 47.6ⴞ4.6 54.6⫾6.4 60.4⫾9.3
Range ⫺4.8% to⫹7.4% NA ⫺8.0% to⫹5.7% ⫺7.4% to⫹5.5% ⴚ4.0% toⴙ11.0% ⫹8.3% to⫹39.4% ⫹22.7% to⫹47.7%
Pvalue .306 NA .112 .252 .012 .004 .001
Note.—No significant difference (P⫽.886, Kruskal-Wallis) was identified among the four groups for rCBF values obtained with an interval of 1 second. Range indicates the overestimation or underestimation compared with the reference. Values in boldface indicate the temporal sampling interval thresholds beyond which rCBF values were significantly overestimated.
when temporal sampling intervals were increased; however, variances in the ischemic area were higher than those in the healthy hemisphere. The relative
values obtained by dividing PCT results in the isch-emic area by those in the healthy hemisphere were are also affected similarly, beyond thresholds
[image:4.603.53.535.70.270.2]re-FIG 1. Time-enhancement curves for four temporal sampling intervals: 0.5 second, 1 second, 2 seconds, and 4 seconds. The area under the curve is approximately the same for the first three sampling intervals. For the interval of 4 seconds, however, the peak points of the curve are undersampled (circle), resulting in a reduction in the area under the curve. This would result in significant errors in the calculation of rCBV.
TABLE 2: PCT rCBF values for the ischemic area
Group
Sampling Interval
0.5 second 1 second* 2 seconds 3 seconds 4 seconds 5 seconds 6 seconds
1 (30 mL)
Mean⫾SD 10.1⫾4.7 11.7⫾6.0 12.3ⴞ6.1 24.4⫾12.1 54.2⫾27.4 102.2⫾50.2 238.3⫾188.0 Range ⫺9.2% to⫹17.3% NA ⴚ10.0% toⴙ18.4% ⫹18.1% to⫹126.3% ⫹151.1% to⫹402.4% ⫹513.7% to⫹991.1% ⫹1183.9% to⫹2561.1%
Pvalue .450 NA .803 .004 ⬍.001 ⬍.001 ⬍.001
2 (40 mL)
Mean⫾SD 11.4⫾5.1 12.9⫾4.9 12.0⫾5.1 13.8ⴞ6.3 47.1⫾23.3 85.9⫾35.9 194.8⫾137.9 Range ⫺10.0% to⫹16.2% NA ⫺9.4% to⫹17.4% ⴚ8.9% toⴙ18.2% ⫹115.1% to⫹319.9% ⫹392.6% to⫹718.7% ⫹946.0% to⫹1945.8%
Pvalue .958 NA .653 .683 ⬍.001 ⬍.001 ⬍.001
3 (50 mL)
Mean⫾SD 9.8⫾4.9 11.3⫾4.5 9.6⫾4.1 11.4ⴞ5.3 25.6⫾12.2 47.1⫾20.7 60.3⫾31.8 Range ⫺10.6% to⫹18.1% NA ⫺10.0% to⫹18.8% ⴚ9.5% toⴙ19.8% ⫹55.8% to⫹171.1% ⫹251.6% to⫹439.4% ⫹380.4% to⫹795.1%
Pvalue .494 NA .393 .939 .001 ⬍.001 ⬍.001
4 (60 mL)
Mean⫾SD 9.6⫾4.4 9.7⫾4.4 9.3⫾4.0 9.2⫾4.3 10.6ⴞ5.7 23.4⫾12.0 29.6⫾19.0 Range ⫺9.7% to⫹19.8% NA ⫺9.6% to⫹19.2% ⫺10.0% to⫹17.3% ⴚ8.9% toⴙ18.6% ⫹118.9% to⫹286.7% ⫹136.9% to⫹324.7%
Pvalue .970 NA .777 .776 .216 .001 .001
Note.—No significant difference (P⫽.166, Kruskal-Wallis) was identified among the four groups for rCBF values obtained with an interval of 1 second. Range indicates the overestimation or underestimation compared with the reference. Values in boldface indicate the temporal sampling interval thresholds beyond which rCBF values were significantly overestimated.
[image:4.603.66.526.326.647.2]ported in Table 7. Figure 2 shows sample PCT data-sets in one patient from the 40-mL group.
No statistically significant difference was identified among the four groups for rCBF, rCBV, MTT, and TTP at a temporal sampling interval of 1 second. (P
values for the Kruskal-Wallis comparisons between groups at an interval of 1 second are reported in the Table notes.) P values for Kruskal-Wallis compari-sons between sampling intervals in each patient group were all ⬍ .01, which allowed us to compare each dataset to the reference dataset (one image per sec-ond) using Wilcoxon (Mann-Whitney) tests. (Pvalues of the tests are reported in the Tables.)
The final threshold for the global temporal sam-pling interval for each bolus volume was defined as the minimum threshold for any of the four parametric PCT results in any region of the brain. The global thresholds were 2 seconds for 30 mL, 3 seconds for 40 mL, 3 seconds for 50 mL, and 4 seconds for 60 mL.
[image:5.603.53.537.70.270.2]Entrance and Exit of Contrast Material Figure 3 shows the time to entrance of the contrast material into the arterial pixel and the time to exit in the venous and ischemic pixels. In all groups, the longer interval was that of the exit of the contrast TABLE 3: PCT rCBV values for the healthy hemisphere
Group
Sampling Interval
0.5 second 1 second* 2 seconds 3 seconds 4 seconds 5 seconds 6 seconds
1 (30 mL)
Mean⫾SD 3.0⫾0.4 2.8⫾0.5 2.9⫾0.4 3.0ⴞ0.5 3.9⫾0.7 4.8⫾1.3 14.9⫾4.8
Range ⫺6.5% to⫹8.0% NA ⫺7.5% to⫹6.8% ⴚ6.2% toⴙ9.2% ⫹16.8% to⫹59.4% ⫹52.5% to⫹99.1% ⫹136.0% to⫹628.3%
Pvalue .213 NA .700 .124 .004 .002 ⬍.001
2 (40 mL)
Mean⫾SD 3.1⫾0.5 3.0⫾0.4 2.8⫾0.4 3.2⫾0.5 3.2ⴞ0.6 4.3⫾0.7 4.9⫾1.2
Range ⫺5.8% to⫹7.1% NA ⫺8.3% to⫹4.9% ⫺5.8% to⫹7.4% ⴚ4.2% toⴙ9.6% ⫹18.0% to⫹69.3% ⫹42.0% to⫹278.2%
Pvalue .225 NA .595 .0196 .024 ⬍.001 ⬍.001
3 (50 mL)
Mean⫾SD 3.2⫾0.4 3.1⫾0.5 2.9⫾0.4 3.0⫾0.3 3.3ⴞ0.5 3.9⫾0.6 4.1⫾0.8
Range ⫺7.2% to⫹6.2% NA ⫺9.0% to⫹7.9% ⫺7.4% to⫹8.3% ⴚ5.3% toⴙ8.3% ⫹7.9% to⫹41.6% ⫹22.3% to⫹66.6%
Pvalue .708 NA .243 .494 .139 .008 .007
4 (60 mL)
Mean⫾SD 3.2⫾0.4 3.1⫾0.5 2.9⫾0.4 2.9⫾0.3 3.2⫾0.4 3.3ⴞ0.4 3.7⫾0.5
Range ⫺6.5% to⫹8.0% NA ⫺8.3% to⫹10.2% ⫺8.1% to⫹9.0% ⫺5.8% to⫹7.6% ⴚ4.8% toⴙ9.6% ⫹8.5% to⫹32.6%
Pvalue .230 NA .650 .420 .324 .038 .007
Note.—No significant difference (P⫽.908, Kruskal-Wallis) was identified among the four groups for rCBV values obtained with an interval of 1 second. Range indicates the overestimation or underestimation compared with the reference. Values in boldface indicate the temporal sampling interval thresholds beyond which rCBV values were significantly overestimated.
[image:5.603.52.541.331.541.2]* Reference for Wilcoxon (Mann-Whitney) tests performed in each group. NA indicates not applicable. TABLE 4: PCT rCBV values for the ischemic area
Group
Sampling Interval
0.5 second 1 second* 2 seconds 3 seconds 4 seconds 5 seconds 6 seconds
1 (30 mL)
Mean⫾SD 1.0⫾0.4 1.2⫾0.5 1.1ⴞ0.5 2.2⫾0.4 3.7⫾0.6 5.4⫾1.5 12.1⫾4.8
Range ⫺14.4% to⫹8.6% NA ⴚ10.2% toⴙ8.5% ⫹33.7% to⫹111.2%⫹104.2% to⫹335.0% ⫹222.0% to⫹447.4% ⫹630.5% to
⫹1275.2%
Pvalue .018 NA .519 ⬍.001 ⬍.001 ⬍.001 ⬍.001
2 (40 mL)
Mean⫾SD 1.1⫾0.3 1.2⫾0.4 1.1⫾0.4 1.2ⴞ0.4 3.2⫾0.5 5.1⫾0.9 10.9⫾2.8
Range ⫺13.0% to⫹13.7% NA ⫺10.5% to⫹8.1% ⴚ10.6% toⴙ10.2% ⫹53.0% to⫹220.5% ⫹197.3% to⫹427.3% ⫹510.8% to⫹937.3%
Pvalue .156 NA .076 .765 ⬍.001 ⬍.001 ⬍.001
3 (50 mL)
Mean⫾SD 0.9⫾0.5 1.1⫾0.3 1.0⫾0.3 1.1ⴞ0.6 2.3⫾0.3 3.4⫾0.5 4.3⫾0.9
Range ⫺12.4% to⫹10.6% NA ⫺8.1% to⫹8.5% ⴚ10.5% toⴙ9.4% ⫹33.5% to⫹122.3% ⫹95.5% to⫹323.7% ⫹249.7% to⫹435.4%
Pvalue .021 NA .033 .603 ⬍.001 ⬍.001 ⬍.001
4 (60 mL)
Mean⫾SD 1.0⫾0.4 1.0⫾0.5 0.9⫾0.6 0.9⫾0.4 1.1ⴞ0.3 2.0⫾0.3 2.4⫾0.4
Range ⫺11.3% to⫹10.4% NA ⫺7.2% to⫹7.2% ⫺9.5% to⫹9.3% ⴚ11.8% toⴙ12.1% ⫹23.3% to⫹155.9% ⫹97.9% to⫹228.1%
Pvalue .614 NA .164 .172 .014 ⬍.001 ⬍.001
Note.—No significant difference (P⫽.556, Kruskal-Wallis) was identified among the four groups for rCBV values obtained with an interval of 1 second. Range indicates the overestimation or underestimation compared with the reference. Values in boldface indicate the temporal sampling interval thresholds beyond which rCBV values were significantly overestimated.
material in the ischemic area. In two and three pa-tients from the 50 and 60 mL groups, respectively, the definition of exit time could not be applied in either the venous or ischemic pixel. In these patients, the exit times were set at 45 seconds. No statistically significant difference (P⫽.789) was observed among the four groups with respect to the arterial entrance of contrast material. On the other hand, there was a nonsignificant trend for increasing exit times from the venous (P⫽.516) and ischemic (P⫽.569) pixels with increasing bolus volume.
A time interval equal to mean ⫹ 2 SDs would permit adequate imaging of the patients (and the
ischemic area, if any) in 97.5% of the cases. When we took optimal temporal sampling interval into account, optimal PCT scanning times were 36, 42, 42, and 48 seconds for the 30-, 40-, 50-, and 60-mL groups, re-spectively.
Image-Quality Ratio
[image:6.603.53.536.70.270.2]We did not demonstrate a threshold for image-quality ratios below that which would have signifi-cantly altered PCT findings. The calculated ratios were 0.645⫾0.193 in group 1 (30 mL), 0.712⫾0.216 in group 2 (40 mL), 0.767⫾0.240 in group 3 (50 mL), TABLE 5: PCT MTT values for the healthy hemisphere
Group
Sampling Interval
0.5 second 1 second* 2 seconds 3 seconds 4 seconds 5 seconds 6 seconds
1 (30 mL)
Mean⫾SD 4.0⫾0.4 4.1⫾0.5 4.0⫾0.4 3.8ⴞ0.5 3.3⫾0.4 3.1⫾0.4 3.0⫾0.6
Range ⫺11.4% to⫹8.0% NA ⫺10.0% to⫹9.8% ⴚ11.1% toⴙ4.1% ⫺6.2% to⫺33.6% ⫺3.1% to⫺40.3% ⫺27.0% to⫺53.5%
Pvalue .789 NA .594 .016 .008 .006 .002
2 (40 mL)
Mean⫾SD 4.3⫾0.5 4.2⫾0.4 4.1⫾0.4 4.0⫾0.5 3.9ⴞ0.5 3.4⫾0.5 3.1⫾0.6
Range ⫺6.7% to⫹10.1% NA ⫺10.5% to⫹8.2% ⫺8.3% to⫹7.8% ⴚ10.6% toⴙ7.3% ⫺7.4% to⫺28.1% ⫺15.7% to⫺36.7%
Pvalue .202 NA .889 .803 .169 .007 .002
3 (50 mL)
Mean⫾SD 4.2⫾0.3 4.1⫾0.5 4.1⫾0.6 4.0⫾0.4 3.9⫾0.4 3.8ⴞ0.5 3.4⫾0.4
Range ⫺9.8% to⫹9.2% NA ⫺9.5% to⫹8.6% ⫺9.9% to⫹7.0% ⫺10.6% to⫹2.8% ⴚ11.1% toⴙ7.0% ⫺9.9% to⫺28.3%
Pvalue 0.783 NA .485 .256 .043 .013 .009
4 (60 mL)
Mean⫾SD 4.1⫾0.5 4.0⫾0.5 4.2⫾0.6 4.0⫾0.5 4.0⫾0.3 3.8⫾0.4 3.7ⴞ0.5
Range ⫺9.2% to⫹12.4% NA ⫺8.3% to⫹10.1% ⫺10.5% to⫹9.1% ⫺10.7% to⫹9.5% ⫺10.6% to⫹8.6% ⴚ10.5% toⴙ8.5%
Pvalue .487 NA .341 .873 .306 .129 .118
Note.—No significant difference (P⫽.556, Kruskal-Wallis) was identified among the four groups for MTT values obtained with an interval of 1 second. Range indicates the overestimation or underestimation compared with the reference. Values in boldface indicate the temporal sampling interval thresholds beyond which MTT values were significantly underestimated.
* Reference for Wilcoxon (Mann-Whitney) tests performed in each group. NA indicates not applicable.
TABLE 6: PCT MTT values for the ischemic area
Group
Sampling Interval
0.5 second 1 second* 2 seconds 3 seconds 4 seconds 5 seconds 6 seconds
1 (30 mL)
Mean⫾SD 5.8⫾0.6 5.9⫾0.7 5.6⫾0.7 5.4ⴞ0.6 4.1⫾0.6 3.2⫾0.6 3.1⫾0.6
Range ⫺16.0% to⫹10.5% NA ⫺17.6% to⫹7.8% ⴚ13.3% toⴙ16.3% ⫺13.6% to⫺44.3% ⫺32.1% to⫺67.5% ⫺42.4% to⫺75.2%
Pvalue .634 NA .168 .099 .009 .002 .002
2 (40 mL)
Mean⫾SD 6.0⫾0.7 5.8⫾0.8 5.6⫾0.7 5.4ⴞ0.6 4.1⫾0.5 3.5⫾0.5 3.4⫾0.5
Range ⫺9.2% to⫹18.1% NA ⫺18.7% to⫹9.3% ⴚ17.6% toⴙ7.3% ⫺9.8% to⫺36.2% ⫺26.3% to⫺60.5% ⫺37.9% to⫺50.5%
Pvalue .205 NA .623 .277 .004 .002 0.002
3 (50 mL)
Mean⫾SD 5.8⫾0.6 5.9⫾0.9 6.0⫾0.6 5.7⫾0.7 5.3ⴞ0.7 4.3⫾0.6 4.3⫾0.6
Range ⫺17.1% to⫹16.5% NA ⫺11.8% to⫹19.7% ⫺18.2% to⫹15.5% ⴚ22.5% toⴙ8.9% ⫺12.1% to⫺43.2% ⫺28.1% to⫺36.0%
Pvalue .611 NA .652 .435 .057 .007 .006
4 (60 mL)
Mean⫾SD 6.1⫾0.8 6.1⫾0.8 5.9⫾0.6 6.0⫾0.7 5.6⫾0.7 5.5ⴞ0.6 4.8⫾0.6
Range ⫺19.6% to⫹11.6% NA ⫺19.5% to⫹12.3% ⫺18.4% to⫹12.4% ⫺17.7% to⫹9.5% ⴚ16.1% toⴙ10.35% ⫺13.0% to⫺33.1%
Pvalue .677 NA .528 .649 .283 .017 .008
Note.—No significant difference (P⫽.108, Kruskal-Wallis) was identified among the four groups for MTT values obtained with an interval of 1 second. Range indicates the overestimation or underestimation compared with the reference. Values in boldface indicate the temporal sampling interval thresholds beyond which MTT values were significantly underestimated.
[image:6.603.53.537.337.537.2]and 0.850⫾ 0.166 in group 4 (60 mL). There was a trend toward higher image-quality ratios with increas-ing volume of contrast material; however, this trend was not statistically significant (P⫽.082). Moreover, for each PCT result (rCBF, rCBV, MTT, and TTP) obtained with a temporal sampling interval of 1 sec-ond, no significant difference was identified in the four patient groups.
Radiation Dose (Table 8)
In the first group of patients (30 mL), the cerebral effective radiation dose would be 1.245 mSv for cere-bral coverage of 4 cm and 1.867 mSv for spatial coverage of 6 cm, with an acquisition of 36 seconds at a temporal sampling interval of 2 seconds and with acquisition parameters of 80 kVp and 120 mAs. In the second (40-mL) and third (50-mL) groups, the effec-tive dose would be 0.983 mSv for coverage of 4 cm,
with an acquisition of 43 seconds at an interval of 3 seconds (80 kVp and 120 mAs). In the fourth group (60 mL), the effective dose would be 0.852 mSv for coverage of 4 cm, with an acquisition of 48 seconds at an interval of 4 seconds (80 kVp and 120 mAs). As a reference, the dose for a standard cerebral CT exam-ination is 2.5 mSv (21).
Discussion
The numerous parameters involved in the perfor-mance of PCT affect the accuracy of perfusion values, the radiation dose, and the spatial coverage. How-ever, only a few of these parameters have been as-sessed thoroughly. For instance, the use of 80 kVp instead of 120 kVp has been demonstrated to increase contrast enhancement and reduce the patient’s radi-ation dose (20). Other parameters are standard be-cause they cannot be modified or bebe-cause have been shown to be effective. A 300-mg/mL bolus of isosmo-lar iodinated contrast material is required, as this has been demonstrated to be safe in case of ischemic brain tissue (23). Similarly, the fastest possible injec-tion rate should be used to deliver the bolus, to verify the assumptions of the central volume principle that underlies dynamic PCT data analysis (14). However, patients do not safely tolerate injection rates above 4 or 5 mL/s in the antecubital veins; therefore, this is the maximum rate typically used in PCT protocols.
In the present study, we evaluated the influence of temporal sampling rate and contrast-agent bolus on PCT results. All other acquisition parameters were equivalent among the different groups of patients. We found that the allowable temporal sampling in-terval is greater than 1 second. A temporal sampling interval of 0.5 second, which some authors advocate (12), does not result in more accurate calculation of PCT parameters.
The allowable temporal sampling interval depends on the volume of the bolus. For each of four volumes, we could define a threshold of temporal sampling below that in which absolute PCT results became inaccurate. Because of an underestimation of the ar-eas under the time-concentration curves (predomi-nantly in the reference venous pixel), rCBV values were overestimated. This, combined with MTT un-derestimation, led to an overestimation of rCBF val-ues. MTT values do not simply depend on the differ-ence in width between the arterial input and parenchymatous curves; they result from a more com-plex deconvolution operation. Sampling sparsing in-fluences both the parenchymatous curves and the arterial input and thus has a complex influence on the deconvolution operation. The type of deconvolution, which varies for the commercially available deconvo-lution-based PCT software, is not likely to modify the influence of sparsing sampling on MTT results. These thresholds held true when the pathologic hemisphere is compared with the healthy contralateral hemi-sphere, as visually performed in clinical practice. In-deed, ratios obtained by dividing PCT results in the ischemic area by those in the healthy area were sig-TABLE 7: Thresholds beyond which PCT results were significantly
different from reference results
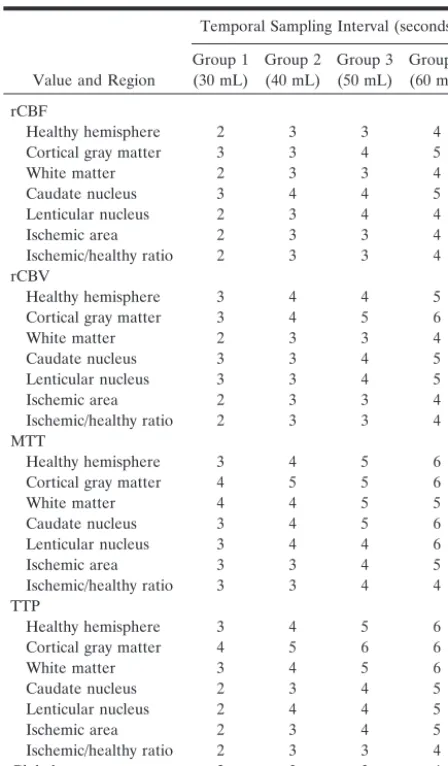
Value and Region
Temporal Sampling Interval (seconds)
Group 1 (30 mL) Group 2 (40 mL) Group 3 (50 mL) Group 4 (60 mL) rCBF
Healthy hemisphere 2 3 3 4 Cortical gray matter 3 3 4 5
White matter 2 3 3 4
Caudate nucleus 3 4 4 5 Lenticular nucleus 2 3 4 4 Ischemic area 2 3 3 4 Ischemic/healthy ratio 2 3 3 4 rCBV
Healthy hemisphere 3 4 4 5 Cortical gray matter 3 4 5 6
White matter 2 3 3 4
Caudate nucleus 3 3 4 5 Lenticular nucleus 3 3 4 5 Ischemic area 2 3 3 4 Ischemic/healthy ratio 2 3 3 4 MTT
Healthy hemisphere 3 4 5 6 Cortical gray matter 4 5 5 6
White matter 4 4 5 5
Caudate nucleus 3 4 5 6 Lenticular nucleus 3 4 4 6 Ischemic area 3 3 4 5 Ischemic/healthy ratio 3 3 4 4 TTP
Healthy hemisphere 3 4 5 6 Cortical gray matter 4 5 6 6
White matter 3 4 5 6
Caudate nucleus 2 3 4 5 Lenticular nucleus 2 4 4 5 Ischemic area 2 3 4 5 Ischemic/healthy ratio 2 3 3 4
Global 2 3 3 4
[image:7.603.54.278.79.462.2]nificantly affected when we used sampling intervals greater than the thresholds established in our study. The volume of contrast material did not affect
image quality or PCT results. Specifically, image-quality ratios were not significantly different among the four groups with various bolus volumes.
Addition-FIG 2. Sample PCT datasets in one patient from the 40-mL group. rCBF, rCBV, MTT, and TTP maps are displayed for six sampling intervals: 1, 2, 3, 4, 5, and 6 seconds. Sparsing sampling results in overestimation of rCBF, rCBV, and TTP values and in underestimation of MTT values.
ally, no significant difference was identified in the PCT results of the four groups.
Whereas the arterial entrance of contrast material in the section depends mainly on the injection rate and the patients’ cardiac output, the duration of con-trast enhancement is influenced by the volume of the bolus. The absence of significant differences in the venous and ischemic exit times of contrast material among different volumes was due to the relatively high variances in the duration of contrast enhance-ment. This was related to the differing hemodynamic status of our patients and, in several cases, to issues involving the venous catheter (gauge too small, bent elbows, etc). However, for each bolus volume, it is possible to define an optimal scanning duration that is suitable for most patients.
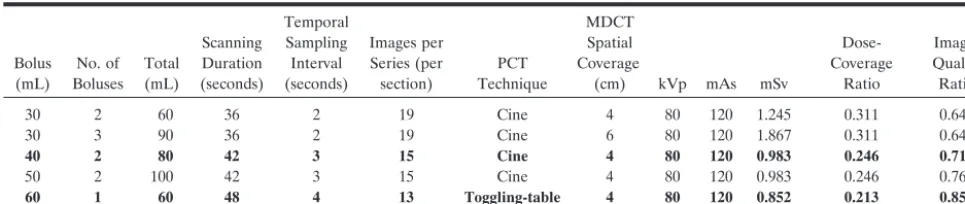
Once the required temporal sampling interval, op-timal scanning duration, and bolus volume are de-fined, it is possible to propose alternative PCT pro-tocols, characterized by bolus volume, scanning mode, spatial coverage, and radiation dose. These alternative protocols are summarized in Table 8. One limiting factor for all protocols is the total volume of contrast material, which should be 150 mL or less to protect the patient’s renal function. This dose has been proved safe in the emergency setting (24). Typ-ically, CTA studies require approximately 50–70 mL, leaving 80–100 mL available for PCT studies. Thus, two or three boluses of 30 mL, two boluses of 40 or 50 mL, and one bolus of 60 mL are the possible injection volumes if PCT is to be performed at the same sitting as CTA. However, if CTA is unnecessary, additional boluses could be used to expand the coverage for PCT studies.
To increase coverage with PCT during a single bolus of contrast material, Roberts et al (13) devel-oped a cine-mode technique, the toggling-table tech-nique, in which the table is moved between two loca-tions during the bolus. Because of restricloca-tions in table movement, however, the minimal temporal sampling interval for current commercial CT scanners is 4–5 seconds. According to our calculations, this technique is limited to only a bolus of 60 mL. At temporal sampling interval superior to 4 seconds and at bolus volumes less than 60 mL, the current toggling-table technique results in significant differences in the cal-culation of CBV and CBF compared with our refer-ence standard. This technique, however, is sensitive to large-vessel infarction and could conceivably be used
in situations in which the dose of contrast agent is an issue or in which spatial coverage is required, as long as the limitations are understood.
Selecting an optimal PCT protocol from among those summarized in Table 8 is a somewhat local issue and depends on the CT scanner available (eg, MDCT, number of detector-rows, pitch, volume of contrast material, requirement for CTA). The main decision requires a balance between spatial coverage and ra-diation dose. For instance, three boluses of 30 mL would afford coverage of 6 cm (assuming a detector width of 2 cm), but this would represent a radiation dose twice as high as that of the 40-, 50-, and 60-mL protocols. Therefore, we favor PCT protocols involv-ing 40- or 60-mL bolus volumes (Table 8), which provide the optimal ratio of coverage to radiation dose. If possible, manufacturers should adapt the technical requirements of their CT scanners to permit use of the toggling-table technique at a sampling resolution of one image per 3 seconds. If imple-mented, this would allow the use of two or three 40-mL boluses for a total coverage of 80–120 mm. In this way, PCT assessment of the entire brain volume could be accurately performed.
Conclusions
A temporal sampling interval of greater than 1 second can be used for PCT without altering the quantitative accuracy of the results. Increasing the sampling interval reduces the radiation dose to the patient and may allow for increased spatial coverage in the near future. Optimization of PCT protocols may result in accurate estimation of perfusion values at acceptable radiation doses.
Acknowledgment
The authors wish to acknowledge the skillful assistance of Mr B. Mow, chief technologist in our department.
References
1. Latchaw RE, Yonas H, Hunter GJ, et al.Guidelines and recom-mendations for perfusion imaging in cerebral ischemia: a scientific statement for healthcare professionals by the writing group on perfusion imaging, from the council on cardiovascular radiology of the American Heart Association.Stroke2003;34:1084–1104 2. Miles KA, Griffiths MR.Perfusion CT: a worthwhile
[image:9.603.54.537.71.173.2]enhance-ment?Br J Radiol2003;76:220–231 TABLE 8: Imaging protocols for acceptable PCT results
Bolus (mL) No. of Boluses Total (mL) Scanning Duration (seconds) Temporal Sampling Interval (seconds) Images per Series (per section) PCT Technique MDCT Spatial Coverage
(cm) kVp mAs mSv
Dose-Coverage Ratio Image-Quality Ratio
30 2 60 36 2 19 Cine 4 80 120 1.245 0.311 0.645
30 3 90 36 2 19 Cine 6 80 120 1.867 0.311 0.645
40 2 80 42 3 15 Cine 4 80 120 0.983 0.246 0.712
50 2 100 42 3 15 Cine 4 80 120 0.983 0.246 0.767
60 1 60 48 4 13 Toggling-table 4 80 120 0.852 0.213 0.850
3. Lev MH, Segal AZ, Farkas J, et al.Utility of perfusion-weighted CT imaging in acute middle cerebral artery stroke treated with intra-arterial thrombolysis – Prediction of final infarct volume and clinical outcome.Stroke2001;32:2021–2027
4. Hunter GJ, Hamberg LM, Ponzo JA, et al.Assessment of cerebral perfusion and arterial anatomy in hyperacute stroke with three-dimensional functional CT: early clinical results.AJNR Am J Neu-roradiol1998;19:29–37
5. Hamberg LM, Hunter GJ, Maynard KI, et al.Functional CT per-fusion imaging in predicting the extent of cerebral infarction from a 3-hour middle cerebral arterial occlusion in a primate stroke model.AJNR Am J Neuroradiol2002;23:1013–1021
6. Wintermark M, Maeder P, Thiran JPh, et al.Simultaneous mea-surements of regional cerebral blood flows by perfusion-CT and stable xenon-CT: a validation study.AJNR Am J Neuroradiol2001; 22:905–914
7. Furukawa M, Kashiwagi S, Matsunaga N, et al. Evaluation of cerebral perfusion parameters measured by perfusion CT in chronic cerebral ischemia: comparison with Xenon CT.J Comput Assist Tomogr2002;26:272–278
8. Kudo K, Terae S, Katoh C, et al.Quantitative cerebral blood flow measurement with dynamic perfusion CT using the vascular-pixel elimination method: comparison with H215O positron emission
tomography.AJNR Am J Neuroradiol2003;24:419–426
9. Gillard JH, Antoun NM, Burnet NG, Pickard JD.Reproducibility of quantitative CT perfusion imaging.Br J Radiol2001;74:552–555 10. Wintermark M, Reichhart M, Maeder P, et al.Comparison of admission perfusion computed tomography and qualitative diffu-sion- and perfudiffu-sion-weighted magnetic resonance imaging in acute stroke patients.Stroke2002;33:2025–2031
11. Wintermark M, Reichhart M, Thiran JPh, et al.Prognostic accu-racy of cerebral blood flow measurement by perfusion computed tomography, at the time of emergency room admission, in acute stroke patients.Ann Neurol2002;51:417–432
12. Eastwood JD, Lev MH, Provenzale JM.Perfusion CT with iodin-ated contrast material.AJR Am J Roentgenol2003;180:3–12 13. Roberts HC, Roberts TPL, Smith WS, et al.Multisection dynamic
CT perfusion for acute cerebral ischemia: the “toggling-table” technique.AJNR Am J Neuroradiol2001;22:1077–1080
14. Wintermark M, Maeder P, Thiran JP, Schnyder P, Meuli R. Quan-titative assessment of regional cerebral blood flows by perfusion CT studies at low injection rates: a critical review of the underlying theoretical modelsEur Radiol2001;11:1220–1230
15. Axel L.Cerebral blood flow determination by rapid-sequence com-puted tomography.Radiology1980;137:679–686
16. Axel L. A method of calculating brain blood flow with a CT dynamic scanner.Adv Neurol1981;30:67–71
17. Axel L.Tissue mean transit time from dynamic computed tomog-raphy by a simple deconvolution technique.Invest Radiol1983;8: 94–99
18. Ladurner G, Zilkha E, Iliff LD, et al.Measurement of regional cerebral blood volume by computerized axial tomography.J Neurol Neurosurg Psychiatry1976;39:152–155
19. Ladurner G, Zikha E, Sager WD, et al.Measurement of regional cerebral blood volume using the EMI 1010 scanner.Br J Radiol
1979;52:371–374
20. Wintermark M, Maeder P, Verdun FR, et al.Using 80 kVp versus 120 kVp in perfusion CT measurement of regional cerebral blood flows.AJNR Am J Neuroradiol2000;21:1881–1884
21. Commission of the European Communities.European Guidelines on Quality Criteria for Computed Tomography, EUR 16262 EN 1999.
Available at: http://www.drs.dk/guidelines/ct/quality/htmlindex. htm3/11/2004
22. Hidajat N, Ma¨urer J, Schro¨der RJ, et al.Relationships between physical dose quantities and patient dose in CT.Br J Radiol1999; 72:556–561
23. Doerfler A, Engelhorn T, von Kummer R, et al.Are iodinated contrast agents detrimental in acute cerebral ischemia? An exper-imental study in rats.Radiology1998;206:211–217