In rivers and lakes of tropical South America, gymnotiform fish lead a secretive, nocturnal life. During the day, they stay out of the way of visually oriented predators by hiding and moving little; they do not communicate using sound, which would be detected by predatory catfish, cichlids and piranhas. Knifefishes communicate using electric organ discharges (EODs) they sense with electroreceptor organs distributed all over their skin (for reviews, see Hagedorn, 1986; Kramer, 1990, 1994, 1996; Moller, 1995; for more detailed reviews on electric organs, see Bennett, 1971, Bass, 1986; on electroreceptor organs, Zakon, 1986, 1988). A second function of the electric system of the knifefishes is electrolocation of objects (for reviews, see Bastian, 1990, 1994), which is not dealt with here.
There are two phenotypes of EOD: pulse and wave. Pulses are brief all-or-none events of the order of 1 ms or a few milliseconds separated by much longer intervals. Fed into a loudspeaker, a buzzing sound or single clicks at very low discharge rates are heard. Wave EODs have no pauses between
them, so that they represent a continuous wave (like a sine wave) and are of a constant frequency that may be modulated when the fish is excited. Fed into a loudspeaker, wave EODs sound like a musical instrument playing a constant tone.
The African weakly electric fish, the Mormyriformes (elephantfish, snoutfish), consisting of approximately 200 freshwater species that are only distantly related to the Gymnotiformes, are all of the pulse type except for a single species that is of the wave type. This contrasts with South American freshwater electric fish (perhaps 120 species in all), most of which are of the wave type (families Sternopygidae and Apteronotidae sensu Mago-Leccia, 1994). The reason for this difference between the two major groups of electric freshwater fish that occupy, as far as we know, the same general niche in their respective continents is unknown.
An advantage of the pulse phenotype in communication is its relative immunity to cross-talk by conspecifics: the statistical probability of EOD coincidences (causing signal masking) is low because of a low duty cycle (the proportion of JEB2091
The electric organ discharge (EOD) of most species of the freshwater knifefishes (Gymnotiformes) of South America is of the wave, not the pulse, type. Wave EODs are usually of constant frequency and amplitude, and show a bewildering multitude of species-characteristic waveforms. The EOD of Eigenmannia is sexually dimorphic in waveform and in the intensity of its higher harmonics. In a go/no go paradigm, trained food-rewarded fish discriminated between these waveforms, and naive (untrained) fish showed a significant preference. To determine whether spectral or waveform (time) cues are used by the fish, artificial stimuli of identical amplitude spectrum were synthesized that differed only in phase relationship between their harmonics, i.e. waveform, and the fish discriminated even among these stimulus waveforms (i.e. spectral cues are not required). Our sensory model predicts that, for successful waveform detection, a minimum frequency difference is required between the stimulus and the EOD. As expected, trained fish confused test stimuli of different waveform that were
frequency-clamped and phase-locked to the EOD (frequency difference 0 Hz). Opening the electronic feedback loop immediately restored discrimination performance on an on/off basis, and a strong jamming avoidance response (JAR; a frequency shift away from the stimulus) accompanied every behavioural decision (to go for a food reward). The strong habituation of the JAR that occurs in response to stimuli of no behavioural consequence (the usual test situation) was not seen in the present experiments. The proposed sensory model (which is based on time-marking T electroreceptors) is supported by these experiments, and a biological function for the JAR – subserving EOD waveform discrimination is shown to be useful in a social context.
Key words: electric organ discharge, Gymnotiformes, signal waveform discrimination, amplitude spectrum, phase spectrum, frequency difference, jamming avoidance response, beat analysis, sensory mechanism, Eigenmannia.
Summary
Introduction
WAVEFORM DISCRIMINATION, PHASE SENSITIVITY AND JAMMING AVOIDANCE
IN A WAVE-TYPE ELECTRIC FISH
BERND KRAMER*
Zoological Institute, University of Regensburg, D-93040 Regensburg, Germany
*e-mail: [email protected]
the time that the signal is on to the time that it is off). Therefore, pulse fish follow a time-sharing strategy of communication, the efficiency of which is often enhanced by certain forms of phase-locking of the EOD pulse to that of another fish (‘echo’ or preferred latency responses, etc.; for a review, see Kramer, 1990). Compared with pulse fish, wave fish come off badly with respect to signal integrity because their wave EOD is always ‘on’ and, therefore, superimposed on (or masked by) that of nearby conspecifics. This is similar to what we experience when trying to communicate in a noisy crowd of people.
Therefore, we might expect wave knifefishes to be rather incompetent at electric communication (perhaps excelling in active electrolocation performance instead), but this is not borne out by the facts. The thresholds of wave fishes for frequency and intensity discrimination, a prerequisite for communication using ‘tone’ signals, are among the lowest for an octavolateral sense among all vertebrates (including the human). Within a certain frequency range, Eigenmannia, a gymnotiform wave fish, discriminates a change of stimulus frequency corresponding to 1 % of a musical tone interval (Kramer and Kaunzinger, 1991). The absolute threshold of wave fishes for an external stimulus is similar to that of pulse fish (for a review, see Kramer, 1996).
Wave fish analyse beats
The underlying reason for this unexpected sensory acuity became clear as a result of a paradoxical result: surgically abolishing the EOD of the wave fish Sternopygus macrurus caused the electrosensory threshold of trained fish to rise steeply (by approximately 30 dB; Fleishman et al., 1992). Clearly, this fish did not profit from the weak stimulus being no longer masked by its own strong EOD that had been abolished; on the contrary, this fish experienced a serious sensitivity loss. Apparently, beating of the stimulus frequency against that of the EOD is required for the fish to detect a stimulus.
This hypothesis was confirmed by a similar sensitivity loss when intact, electrically competent Sternopygus (Fleishman et al., 1992) and Eigenmannia (Kaunzinger and Kramer, 1995) were stimulated at a frequency exactly equal to their EOD frequency or, especially for Eigenmannia, also one of the higher harmonics of the EOD frequency. Such stimuli were detected only at greatly increased stimulus intensities. Surgically abolishing the EOD of a wave fish or stimulating it at one of the harmonics of its EOD frequency (the fundamental included) all have in common that there is no beating – the wave EOD and the stimulus mix according to their instantaneous phase relationship (which was kept stable throughout the experiment by an electronic device in the case of Eigenmannia; Kaunzinger and Kramer, 1995). However, even the slightest frequency mismatch immediately restored the sensory acuity of Eigenmannia, and the filter slope (a spectral line-reject filter, similar to a very sharp notch response in an electronic filter) of this response is one of the steepest for a sensory filter in the animal kingdom (up to 5000 dB per
octave; Kaunzinger and Kramer, 1995) and is not matched by technical filters. That is equivalent to stating that even very slow beats are detected and that the transition from the sensation ‘beat present’ to the sensation ‘beat not present’ is an abrupt one (like a switch).
Certain bats emit long echolocation calls of constant frequency that are terminated by a brief period of frequency modulation (Griffin, 1958). The calls of these CF-FM-type bats mask the faint echoes that are of slightly higher frequency because of the Doppler shift when approaching a target (for reviews, see Neuweiler, 1993; Popper and Fay, 1995). To detect the echoes in spite of the very small frequency difference from the bats’ own calls, the bats must use very sharp frequency filtering (up to 3500 dB per octave; Suga et al., 1976; Suga, 1990). Depending on how fast they approach their target, these bats lower the tone frequency of their calls such that the tone frequency of the echoes is kept at the optimum filter frequency of their highly specialised auditory system (Doppler compensation; Schnitzler, 1972).
In contrast, the sensitive T electroreceptors of wave knifefishes are only weakly V-tuned (filter slope, only 20 dB per octave even on the ‘high’ side of the ‘best’, the EOD frequency; for reviews, see Kramer, 1985; Zakon, 1988; Fleishman, 1992), and these fish use a totally different strategy of signal detection and assessment, analysis of the temporal properties of beats. The temporal properties of beats and the sensory coding, central nervous and motor responses have been studied extensively by Bullock et al. (1972a,b), Scheich and Bullock (1974), Scheich (1977a–c), Heiligenberg (1991) and others. However, exactly how these fish analyse beats has remained a matter of controversy to the present day. Our own results on how frequency and intensity are detected (Kaunzinger and Kramer, 1996) are summarised in a sensory model based on time-marking (T) electroreceptor afferences (Kramer and Kaunzinger in Kramer, 1996; for a review, see Kramer, 1999) and are not presented here.
Wave fish detect stimulus waveform
Wave fish can afford to avoid sharp signal filtering because of their ‘intelligent’ use of beat analysis and they enjoy considerable advantages: in spite of detecting a wide range of stimulus frequencies, their electrosensory threshold and their thresholds for frequency and intensity discrimination are exceedingly low (their electrosensory acuity is high). A cost (in the form of a sensitivity loss) of the wide working range of this system is apparent only for certain spectral lines, the EOD fundamental and its higher harmonics (a situation that, for useful echoes, does not occur in CF-FM bats because of the Doppler frequency shift). Another advantage of the system used by these fish is an undistorted stimulus waveform, because signal distortion is an unavoidable consequence of sharp filtering. Therefore, in addition to stimulus frequency and intensity, wave fish could, in theory, also assess stimulus waveform, which is the topic of the present article.
suitable communication channel. In contrast to sound and other mechanical forms of signal transmission, the waveform of a complex electrical signal remains unchanged with distance from the signal source (except for a gradual deterioration of the signal/noise ratio). The waveform of an electrical signal is also independent of the angle at which it is received, except for a polarity reversal that occurs with certain positional or rotational changes of the sending with respect to the receiving dipole. Therefore, the electrical communication channel does transmit potentially useful waveform information, and the electrosensory system of knifefishes may detect this information because it does not discard that information by sharp sensory filtering.
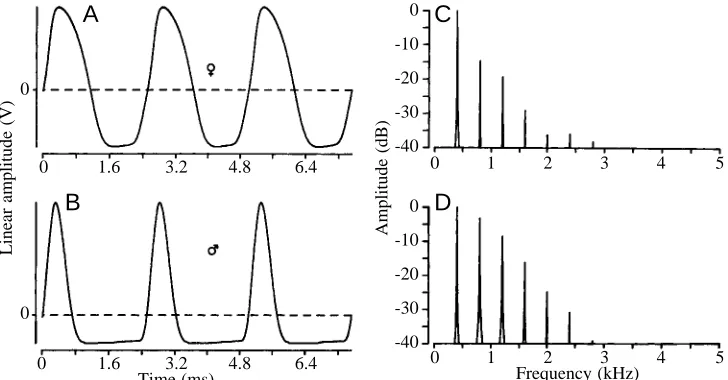
When studying the gymnotiforms of the Amazon near Manaus, I was astonished by the multitude of different waveforms of EOD in wave-type fish (Kramer et al., 1981). This diversity (Kramer, 1990, Figs 3.14–3.22) suggests that, in addition to EOD frequency, which varies from approximately 15 Hz to an exceptionally high 1800 Hz in different species, EOD waveform variation is also species-characteristic and, therefore, must be the product of selection. Mate recognition by EOD frequency, as envisaged by Hopkins and Heiligenberg (1978), seemed to be ineffective in our species-richer study area because of extensive overlap of EOD frequencies and the wide range of species-characteristic frequencies; for example, 260–650 Hz in Eigenmannia virescens at 27 °C (Hopkins, 1974). For so many wave species, as found near Manaus, the number of non-overlapping frequency ranges is insufficient in the available frequency space. In contrast, different species display characteristically different EOD waveforms at a similar frequency (e.g. Fig. 3.20 in Kramer, 1990), and even members of the same species, such as Eigenmannia lineata males and females, may differ in EOD waveform (Fig. 1) (Kramer, 1985;
Eigenmannia lineata is considered a synonym of E. virecens;
Planquette et al., 1996).
We tested whether Eigenmannia discriminates electronically generated functions, such as the sine from the
sawtooth wave, of identical frequency and peak-to-peak amplitude (or, alternatively, identical root mean square amplitude in case the ‘effective’ amplitude was the relevant cue). Trained, food-rewarded fish had no difficulty with this task, nor with discriminating digitally synthesized (Kramer and Weymann, 1987) female from male EODs (Kramer and Zupanc, 1986). The play-back of female rather than male EODs proved significantly more attractive to untrained fish of both sexes that were given neither reward nor punishment (Kramer and Otto, 1988).
From these observations, we concluded that Eigenmannia apparently discriminates any pair of waveforms that differ sufficiently in harmonic content, as seen in an amplitude spectrum. For example, the sine wave does not possess any overtones, but the sawtooth wave is extremely rich in overtones (which are integer multiples of the fundamental frequency). A similar difference, although much less pronounced, exists for Eigenmannia EODs, female EODs displaying overtones of weak intensity and male EODs displaying overtones of much stronger intensity (Fig. 1). Differences in overtone intensity are the physical basis for the sensation of timbre or sound quality that enables us to recognize the various musical instruments or individual human voices.
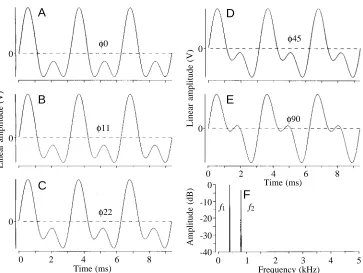
To exclude signal discrimination by spectral analysis, or an electrosensory equivalent of timbre assessment, we used computer-generated waveforms of identical amplitude spectrum (hence, timbre) but different waveform. Two harmonically related sine waves, one octave apart in frequency and of a weaker intensity by −3 dB for the higher harmonic, as is observed in a male Eigenmannia EOD, were added using two different phase relationships: one in which the peaks of the two waves coincided (Fig. 2A, arbitrarily called ‘0 °’), and another with a relative delay of the higher-frequency wave by one-quarter of a cycle, or 90 ° (Fig. 2E). This yielded two characteristically different waveforms of identical timbre; an audio playback of these is indistinguishable to the human ear.
A
B
C
D
00
0
-10
-20
-30
-40
0
-10
-20
-30
-40
Linear amplitude (V)
Amplitude (dB)
0
0
1.6
1.6
3.2
3.2 4.8
4.8 6.4
6.4
0
0
Frequency (kHz) Time (ms)
1
1 2
2 3
3 4
4 5
[image:3.609.202.566.548.738.2]5 Fig. 1. Waveforms (A,B) of electric
Eigenmannia, however, clearly discriminated between these
waveforms, again both in conditioned discrimination tests (Kramer and Otto, 1991; Kramer and Teubl, 1993) and when observing spontaneous preferences in naive fish. In the spontaneous preference tests, the more Eigenmannia-like 0 ° signal was preferred over the 90 ° signal that resembles an
Apteronotus albifrons EOD fairly well (A. albifrons is a
predator; some apteronotids prey on the tails of other knifefishes; Lundberg et al., 1996). The two artificial test waveforms need not be maximally different, as with the 0 ° and 90 ° signal pair; a much smaller waveform difference, such as that between Fig. 2A and Fig. 2C, is sufficient for discrimination (discrimination threshold, between 11 and 22 ° phase shift of the second relative to the first harmonic; Kramer and Teubl, 1993). Therefore, spectral cues, or differences in timbre for a sound signal, are not required for Eigenmannia to discriminate between two electrical stimuli of different waveform. A purely temporal sensory mechanism was called for.
The sensory mechanism of Fig. 3 is compatible with the above results in trained and naive fish, and the sensory physiology as established by Scheich, Bullock, Szabo and others (for a review, see Zakon, 1988). In this model, afferent responses from time-marking T electroreceptor organs, but not from amplitude-coding P receptors, are the relevant ones. At high sensitivity and temporal precision, afferences from T electroreceptors respond to a fish’s own EOD with one action potential per EOD cycle phase-locked to the zero-crossings of the EOD wave (it is not known whether to positive- or to negative-going zero-crossings). Any spontaneous EOD frequency shift or frequency modulation caused by an external EOD of different frequency mixing with a fish’s own EOD
(thus forming a beat) is faithfully reflected by the firing rate of T receptor afferences (which is modulated back and forth in the case of beats, following the modulation of intervals between zero-crossings; Scheich, 1977a–c).
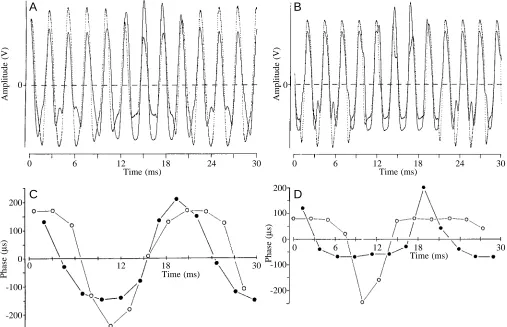
When an external EOD mixes with a fish’s own EOD, the adequate stimulus for T receptors is different for the left and right sides of the body (or head and tail region receptors, depending on the relative positions of the two fish). The external EOD adds onto a fish’s own EOD for the receptors of one body side (according to instantaneous amplitudes), whereas for the receptors on the opposite side, the superposition is subtractive because these receptors face the opposite polarity of the distant dipole generating the external EOD (that is, the external EOD is perceived as inverted, or 180 ° out of phase, by these receptors; see Fig. 9 in Kramer and Otto, 1991; Hopkins and Bass, 1981). Therefore, there are slight time disparities between zero-crossings of the combined signals for local T receptors on the two sides of the fish (Fig. 3). The magnitude of these disparities over time reflects the waveform of the external EOD at greatly reduced speed: one external EOD cycle (of the order of 0.0025 s) is represented by one beat cycle (of the order of 0.25 s), the duration of which the fish can control by adjusting its EOD frequency (Kramer and Otto, 1991). A suitable central nervous system circuit for detecting temporal disparities between the afferent input of T receptors originating from different body regions has been discovered (Carr et al., 1986a,b; Carr, 1990) that builds on the fast electrosensory pathway of Szabo (1967). Gymnotiform pulse fish also seem able to discriminate between the slight variations among conspecific EOD waveforms in an agonistic context (McGregor and Westby, 1992), although a conditioned discrimination test has not yet
A
B
C
D
E
F
Linear amplitude (V)
Linear amplitude (V)
Amplitude (dB)
Time (ms) Frequency (kHz)
Time (ms)
φ0 φ45
0 0
0
0
-10
-20
-30
-40 0
0 2 4 6 8
0 2 4 6 8
1
f2
f1
2 3 4 5
0
0
φ11 φ
90
[image:4.609.195.558.69.342.2]φ22 Fig. 2. Stimulus waveforms (A–E),
all of identical amplitude spectrum (F), as used in training experiments. Waveforms are composed of two harmonically related sine waves (a strong fundamental, f1, that is
superimposed by its harmonic, f2, of
twice that frequency and with an amplitude of −3 dB re f1). A–E differ
only in the phase (φ) difference between f1 and f2, where φ0
been accomplished. Hopkins and Westby (1986) suggest ‘scan sampling’ as a possible sensory mechanism in which regular sequences of EOD superpositions in fish with a small difference in discharge rate, separated by much longer sections without superpositions, would be the relevant cue. If confirmed, such a slow mode of signal analysis would contrast with signal analysis by trained mormyrids (Gnathonemus
petersii and Pollimyrus adspersus), which discriminate
between low-rate playbacks of pulse EODs (conspecific, heterospecific or synthetic) immediately and reliably, after receiving only a few (or even only one) stimulus pulses in which no such sequences of superpositions occur (Graff and Kramer, 1992; Paintner, 1998; Paintner and Kramer, 1998).
Waveform detection depends on beat analysis
Wave fish such as Eigenmannia apparently require beats for discriminating between different stimulus waveforms, and this
hypothesis can be tested. For example, in the sensory model of Fig. 3, fish should be unable to discriminate waveforms (at least those of identical amplitude spectra) when the stimulus and EOD frequency are identical (because no beats are present at frequency identity). This was tested in six fish that, in preparation for the critical experiments, were trained to discriminate between two stimuli of identical amplitude spectrum but markedly different waveform (Fig. 2A,E). These stimuli were played back in random sequence at a constant frequency difference of 50 Hz above the fish’s own EOD frequency (as determined immediately before stimulus onset). At such a large frequency difference, no jamming avoidance responses were evoked and, to avoid startle responses, a stimulus rise time of 500 ms was chosen.
Modifying the experimental arrangement of our earlier studies, the six fish (14.6–16.5 cm total length) were trained to go for a food reward 42 cm away from their daytime hiding shelter (a porous pot; Fig. 4A) when the rewarded stimulus,
Amplitude (V)
Phase (
µ
s)
Amplitude (V)
Phase (
µ
s)
Time (ms) Time (ms)
Time (ms)
Time (ms) 0
0
6 12
12
18
18
24 30 0
0
6
6
12
12
18
18
24 30
30
30
0 0
200
100
0
-100
-200 200
100
0
-100
-200
A
B
[image:5.609.55.562.309.636.2]C
D
S+, was presented. They were supposed to stay inside their shelter when the alternative stimulus, S−, was presented (for a period of up to 30 s). If necessary, fish were punished with a few air bubbles injected into their path when they responded in spite of an S−being played. Using a stopwatch, the progress of learning was monitored as the time interval from stimulus onset to a fish placing its mouth in the Petri dish that contained the reward. The observer was visually screened from the fish by a sheet of cloth.
When response times for S+ and S−began to separate (those for S+ shortening and those for S−lengthening), ‘test’ stimuli were included in the stimulus regimes (see below). The randomized blocks design (Cochran and Cox, 1957) of stimulus sequence for training stimuli was expanded to accommodate a test stimulus every fifth stimulation while carrying on with the training stimuli (at an inter-trial interval of at least 1 min). Test stimuli (the duration of which was a maximum of 60 s in case of no response) were followed by neither reward nor punishment; it is exclusively the responses to test stimuli that are reported in the present (and previous) papers.
Test stimuli were of four kinds, although only two stimulus waveforms, the same ones as for training stimuli, were used, and their sequence followed a randomized blocks design of
their own. Two test stimuli (S+ and S−) were identical with the two training stimuli, and the difference from the fish’s own EOD frequency was also 50 Hz (30 Hz for fish 6; see Table 1). In contrast, the other two test stimuli, S+φ and S−φ (see Table 1), consisted of presenting the same two waveforms at the fish’s own EOD frequency (∆f=0 Hz). To achieve
maintained, precise frequency identity even when the fish changed its own EOD frequency, the stimulus was frequency-clamped and phase-locked to the fish’s EOD (at a constant phase difference of 91 °; the definition of phase is based on zero-crossings times; see Fig. 1 in Kaunzinger and Kramer, 1996). Therefore, a fish was unable to ‘escape’ from the stimulus with a frequency change, since the computerised electronic device (which was triggered cycle-by-cycle by square-wave pulses derived from the fish’s EOD) followed its EOD frequency without delay. [For a description of the basic device, see Kramer and Weymann (1987); a version expanded for phase-locking of sine-wave stimuli was used by Kaunzinger and Kramer (1996); in the present article, a version capable of using ‘arbitrary’ waveforms that are phase-locked was used. The word ‘arbitrary’ is popular with electronics companies at present advertising certain stimulus generators, although phase-locking is not offered.]
By phase-locking the stimulus to the EOD at a selectable,
0 2 4 6 8 10 12 14 16 18 20 22 24 26 28 30
0 10 20 30 40 50 60 70
S+ S– S–φ S+φ
Trial number P
M
S
R R
A1 A2
F
A
B
Latency (s)
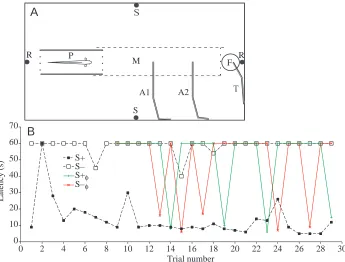
Fig. 4. (A) The test aquarium viewed from above (75 cm long, 40 cm wide, 45 cm deep). R, pair of recording electrodes, in line with a porous pot (P), a swimming channel formed from plastic mesh (M) and a feeder (F). T, glass tube that dispenses the food reward into the feeder. A1, A2, glass tubes that deliver ‘punishing’ air bubbles. S, pair of stimulation electrodes. Training and testing were carried out during daylight hours only, when the fish stayed inside the shelter (P). A stimulus delivered via electrodes S evoked the fish’s ‘go’ response. In training trials, a ‘go’ response to stimulus S+ was rewarded by food at F and to S− a ‘go’ response was punished with air bubbles (at A1; A2 was only used when the fish had habituated to A1). In testing trials (as shown in B), neither S+ nor S− was followed by reinforcement. The orthogonal electrode arrangement (R, S) and the limits to the fish’s swimming path (M) made possible continuous recording of electric organ discharge (EOD) frequency even during
[image:6.609.210.555.73.335.2]dynamically constant phase difference, relative frequency drift or jitter that might occur when using frequency-clamping without phase-locking, and hence undefined phase relationships, were prevented (see Discussion in Kaunzinger and Kramer, 1995). Further advantages were that the sensation level (which depends on the phase difference of a stimulus of constant amplitude; Kaunzinger and Kramer, 1996) and the waveform of the mixed signal (composed of the EOD and the added stimulus) were stable throughout the experiments. Therefore, in these experiments, there were not even small parts of a beat cycle present that might give a fish cues as to the signal waveform with which it was being stimulated.
To record the EOD uncontaminated from the stimulus, the classical electrode geometry for jamming avoidance response
(JAR) experiments (Watanabe and Takeda, 1963) had to be followed precisely, with the additional requirement of permitting the test fish to travel between the shelter and feeder (Fig. 4A). Therefore, the fish’s swimming path was strictly limited to a straight line connecting its shelter with the feeder and the recording electrodes, by a narrow channel made of plastic mesh (maximum diameter 9 cm, which allowed the extremely flexible fish to turn around). Stimulus intensity was 156µVpeak-to-peakcm−1at the fish’s head when facing the feeder
[image:7.609.49.566.271.646.2]inside its shelter. At that position, sensation level was 48 dB for a frequency-clamped stimulus close, but not identical, to the EOD frequency (based on thresholds determined by Kaunzinger and Kramer, 1995). For stimulation at frequency identity and 91 ° phase difference between EOD and stimulus,
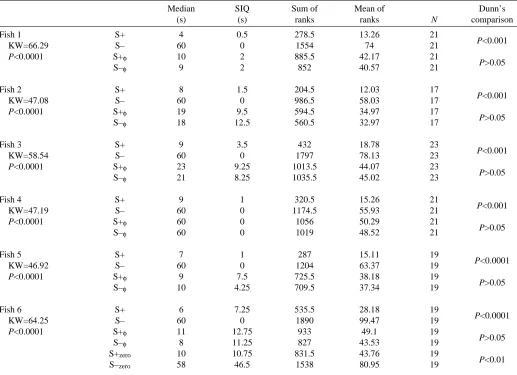
Table 1. Conditioned discrimination between two stimulus waveforms in Eigenmannia
Median SIQ Sum of Mean of Dunn’s
(s) (s) ranks ranks N comparison
Fish 1 S+ 4 0.5 278.5 13.26 21
P<0.001
KW=66.29 S– 60 0 1554 74 21
P<0.0001 S+φ 10 2 885.5 42.17 21
P>0.05
S–φ 9 2 852 40.57 21
Fish 2 S+ 8 1.5 204.5 12.03 17
P<0.001
KW=47.08 S– 60 0 986.5 58.03 17
P<0.0001 S+φ 19 9.5 594.5 34.97 17
P>0.05
S–φ 18 12.5 560.5 32.97 17
Fish 3 S+ 9 3.5 432 18.78 23
P<0.001
KW=58.54 S– 60 0 1797 78.13 23
P<0.0001 S+φ 23 9.25 1013.5 44.07 23
P>0.05
S–φ 21 8.25 1035.5 45.02 23
Fish 4 S+ 9 1 320.5 15.26 21
P<0.001
KW=47.19 S– 60 0 1174.5 55.93 21
P<0.0001 S+φ 60 0 1056 50.29 21
P>0.05
S–φ 60 0 1019 48.52 21
Fish 5 S+ 7 1 287 15.11 19
P<0.0001
KW=46.92 S– 60 0 1204 63.37 19
P<0.0001 S+φ 9 7.5 725.5 38.18 19
P>0.05
S–φ 10 4.25 709.5 37.34 19
Fish 6 S+ 6 7.25 535.5 28.18 19
P<0.0001
KW=64.25 S– 60 0 1890 99.47 19
P<0.0001 S+φ 11 12.75 933 49.1 19
P>0.05
S–φ 8 11.25 827 43.53 19
S+zero 10 10.75 831.5 43.76 19
P<0.01
S–zero 58 46.5 1538 80.95 19
Median response latencies (s) differ significantly between stimuli (left-hand P values, based on KW, Kruskal–Wallis ANOVA by ranks). SIQ, semi-interquartile range (s).
S+, S–, test stimuli of constant frequency (with frequency difference re EOD); S+φ, S–φ, frequency-clamped, phase-locked stimuli; S+zero,
S–zero, stimuli with identical frequency re EOD, not frequency-clamped.
The fish were of Colombian origin, obtained through a direct-importing dealer. Zoologische Staatssammlung, Munich/Germany, accession nos: ZSM 28575 and ZSM 28576 (R. Blasius and B. Kramer, unpublished results).
the sensation level was only 26 dB (based on thresholds determined by Kaunzinger and Kramer, 1996).
Compared with our earlier experiments with unclamped test stimuli (Kramer and Otto, 1991; Kramer and Teubl, 1993), the present experiments were more restrictive. For example, fish had to learn to swim through a narrow channel and for a longer distance to obtain a food reward. Stimulation across the centre of the swimming channel by widely spaced electrodes, as was necessary here, yields a less natural field geometry and training situation than when a small dipole (a signal source that can be localised) close to the feeder is used.
In spite of these constraints, all six fish learned to discriminate the two test signals (of Fig. 2A,E), as shown by the consistent difference in response latencies (an example is shown in Fig. 4B). As soon as a fish discriminated (P<0.01, Mann–Whitney U-test), the frequency-clamped, phase-locked test stimuli were introduced. Whereas response latencies to unclamped stimuli continued to be either short (S+) or long (S−), those for both frequency-clamped, phase-locked stimuli, S+φand S−φ, assumed all possible values between extremes, often oscillating back and forth; that is, the fish were unable to discriminate (Fig. 4B).
The hypothesis that the response latencies were independent of the test stimuli was rejected separately for each fish (P<0.0001, Kruskal–Wallis one-way analysis of variance, ANOVA by ranks; Table 1). As expected, response latencies for an unclamped S+ proved significantly shorter than for an unclamped S− (P<0.01 in each fish; Dunn’s multiple comparison test). In contrast, for the two phase-locked test stimuli that were run in parallel (S+φand S−φ), no significant differences emerged in any of the six fish (P>0.05). Even with continued training, a significant difference is unlikely because, for phase-locked stimuli, the differences between the sums of ranks (as determined for the Kruskal–Wallis statistic) were close to zero in all cases (Table 1).
Even though none of the fish discriminated between the phase-locked test stimuli (S+φand S−φ), individual differences were apparent. For example, fish 4 tended not to approach the feeder when it was apparently uncertain about the exact nature of the stimulus, and long latencies for both phase-locked stimuli occurred frequently. In contrast, fish 1 tended to adopt the opposite strategy by visiting the feeder in response to any stimulus. Fish 1 also appeared to be more ‘resolute’ than fish 4 and sometimes disregarded punishment with air bubbles (even when boosted by a second device; Fig. 4A). The results for each of the six fish tested support the conclusion that fish are unable to discriminate between the stimulus waveforms (of identical amplitude spectrum) when presented at maintained frequency identity with the EOD (∆f=0 Hz), in spite of an
excellent discrimination between the same stimuli when presented at 50 or 30 Hz difference from the resting EOD frequency. These frequency differences were sufficiently large that a JAR was not evoked.
However, a fish that is stimulated at its own EOD frequency with the electronic feedback loop disabled should be able to discriminate between the two waveforms, but only after
performing a JAR (thereby restoring beats). This hypothesis was tested in fish 6 by introducing two more test stimuli (that is, six stimuli that were all run in parallel, following a randomised blocks design) which consisted of playing back the two signal waveforms (again of Fig. 2A,E) at a constant frequency that was identical to this fish’s EOD frequency at stimulus onset (S+zero and S−zero). These stimuli were not
frequency-clamped and, hence, were of constant frequency throughout the experiment.
As expected, fish 6 discriminated between these new, unclamped test stimuli (P<0.01, Table 1) probably because, with the frequency clamp disabled, the fish quickly changed its EOD frequency by an amount sufficient to restore its capacity for beat analysis. This assumption is supported by the fish’s confusion of the same stimulus waveforms when phase-locked to its EOD (S+φand S−φ, as also observed in all other fish).
The JAR is instrumental to waveform discrimination
From the previous experiment, it follows that a fish that is stimulated at its EOD frequency must perform a JAR to discriminate between different stimulus waveforms. This hypothesis was tested in an additional five untrained
Eigenmannia (11.5–15.5 cm total length; Table 2, Fig. 5A,B).
In preparation for the critical tests, fish were trained to discriminate between the same two waveforms as in the previous experiment (Fig. 2A,E). However, the frequency difference from the fish’s EOD was smaller and varied between 10 and 30 Hz, depending on the fish and at which frequency difference learning progress seemed best. Discrimination between the two test stimuli, S+ and S−, was confirmed in each fish using the Mann–Whitney U-test (P<0.01). In combination with previous reports (Kramer and Otto, 1991; Kramer and Teubl, 1993; Table 1), the number of fish that have successfully performed the discrimination task is now 18 out of 18 tested by four experimenters.
The critical test of the above hypothesis began (1) when S+ and S− were replaced by S+zero and S−zero, respectively, and
(2) when S+φand S−φwere added to the regime of test stimuli (as defined for Table 1). The present test stimulus regime was identical to that used for fish 6 of Table 1, except that, for the five fish of Table 2, S+ and S−were omitted (four test stimuli rather than six). Stimulus intensity was 165µVpeak-to-peakcm−1,
corresponding to a sensation level of 49 dB for a stimulus close, but not identical, to the EOD frequency; at a phase difference of 35 °, the sensation level for frequency-clamped stimuli (S+φand S−φ) was 29 dB. Training stimulus duration was up to 45 s, inter-trial interval was again at least 1 min and test stimulus duration again up to 60 s. Response latency was the time from stimulus onset until the tip of the fish’s tail had left the shelter completely.
The results for the five new fish (Table 2) confirmed the result (of fish 6, Table 1) that, even when the stimuli were identical in frequency with their own EOD, all fish discriminated between the two test stimuli, S+zero and S−zero
between the stimulus and the EOD, as used for fish 1–5 in Table 1, is unnecessary and does not provide a cue for discrimination. In contrast, fish were unable to discriminate between the two phase-locked stimuli, S+φ and S−φ, when frequency identity with the EOD was maintained (P>0.05 in each fish, Table 2).
After nine full repeats of test trials, fish 5 habituated to the punishment with air bubbles that was associated with the S−zero
training stimulus and no longer appeared to discriminate between stimuli, as measured by response latencies. This habituation problem had been observed in other fish before but never as persistently as in fish 5, which finally ignored the punishment, visiting the feeder in response to any stimulus. Because using a more severe form of punishment was not considered acceptable in these fragile fish, the data sampled after the ninth repeat were discarded, and it was impossible to increase the sample size beyond nine in fish 5 using the present technique. With such a small sample size, the nonparametric Kruskal–Wallis test is known to possess very little power (see, for example, Siegel and Castellan, 1988; Motulsky, 1995), increasing the probability of a ‘type II’ error (failing to reject
an incorrect null hypothesis, H0), and discrimination was
established at a significance level of only P<0.05 in this fish (Table 2). An F-test for fish 5 confirmed the result (that rejection of H0is justified; F=7.408; Bonferroni’s P<0.01 for
the comparison S+zero/S−zero, and P>0.05 for the comparison
S+φ/S−φ; normality test of data passed with P>0.10; differences between standard deviations not significant as shown by a Bartlett’s test, P=0.1138).
On stimulation with S+zero, all fish responded by changing
their EOD frequency (as measured by the frequency change
∆R = actual EOD frequency minus resting EOD frequency,
determined immediately before stimulus onset). Except on three out of 71 occasions, these stimuli of ∆f=0 Hz evoked a
frequency increase, confirming the results of earlier studies (Kramer, 1987; Kaunzinger and Kramer, 1995). The time course of the frequency change (∆R, absolute values) evoked
by S+zerowas averaged in each fish, and individual differences
were revealed. Fish 1 showed the strongest responses: 5 s after stimulus onset, its averaged ∆R was 7.86 Hz, whereas values
[image:9.609.43.574.353.643.2]of 1.16 Hz, 1.85 Hz, 1.18 Hz and 0.75 Hz were observed in fishes 2–5, respectively (Fig. 5A).
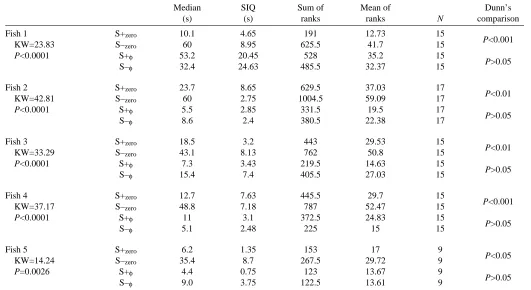
Table 2. Conditioned discrimination between two stimulus waveforms in Eigenmannia
Median SIQ Sum of Mean of Dunn’s
(s) (s) ranks ranks N comparison
Fish 1 S+zero 10.1 4.65 191 12.73 15
P<0.001
KW=23.83 S–zero 60 8.95 625.5 41.7 15
P<0.0001 S+φ 53.2 20.45 528 35.2 15
P>0.05
S–φ 32.4 24.63 485.5 32.37 15
Fish 2 S+zero 23.7 8.65 629.5 37.03 17
P<0.01
KW=42.81 S–zero 60 2.75 1004.5 59.09 17
P<0.0001 S+φ 5.5 2.85 331.5 19.5 17
P>0.05
S–φ 8.6 2.4 380.5 22.38 17
Fish 3 S+zero 18.5 3.2 443 29.53 15
P<0.01
KW=33.29 S–zero 43.1 8.13 762 50.8 15
P<0.0001 S+φ 7.3 3.43 219.5 14.63 15
P>0.05
S–φ 15.4 7.4 405.5 27.03 15
Fish 4 S+zero 12.7 7.63 445.5 29.7 15
P<0.001
KW=37.17 S–zero 48.8 7.18 787 52.47 15
P<0.0001 S+φ 11 3.1 372.5 24.83 15
P>0.05
S–φ 5.1 2.48 225 15 15
Fish 5 S+zero 6.2 1.35 153 17 9
P<0.05
KW=14.24 S–zero 35.4 8.7 267.5 29.72 9
P=0.0026 S+φ 4.4 0.75 123 13.67 9
P>0.05
S–φ 9.0 3.75 122.5 13.61 9
Median response latencies (s) differ significantly between stimuli in each fish tested (left-hand P values, based on KW, Kruskal–Wallis ANOVA by ranks).
SIQ, semi-interquartile range (s).
S+zero, S–zero, stimuli with identical frequency re EOD, not frequency-clamped; S+φ, S–φ, frequency-clamped, phase-locked stimuli.
The fish were of Guyanan origin, obtained through a direct-importing dealer. Zoologische Staatssammlung, Munich/Germany, accession nos: ZSM 28567 - 28574 (M. Orth and B. Kramer, unpublished results).
Factors contributing to the high variability of the JAR are habituation, sex and age (Kramer, 1987). In the present context, a possible further factor was of interest: is the JAR required for successful waveform discrimination, as determined by a conditioned behaviour? Therefore, the curves were aligned such that the times of decision-making (as
opposed to stimulus onset) coincided and were averaged as before. The time of decision-making (to go for a food reward) was the moment when the fish left its shelter, i.e. when it showed the ‘go’ response.
Associated with the ‘go’ response, an additional frequency change superseding the one shown in Fig. 5A (where
Eigenmannia 1
-0.5 2.0 4.5 7.0 9.5
0 1.1 2.2 3.3 4.4 5.5 6.6 7.7 0.2 1.3 2.4 3.5 4.6
Eigenmannia 2
-1.0 0 1.0 2.0 3.0 4.0
0 1.1 2.2 3.3 4.4 5.5 6.6 7.7 8.8
Eigenmannia 3
-0.5 0.5 1.5 2.5 3.5 4.5 5.5
0 1.1 2.2 3.3 4.4 0.7 1.8 2.9 4.0 5.1 6.2 7.3 8.4 9.5
Eigenmannia 4
-0.5 0.5 1.5 2.5 3.5
0 1.1 2.2 3.3 0 1.1 2.2 3.3 4.4 5.5 6.6 7.7
Eigenmannia 5
-1.5 0 1.5 3.0
1.5 2.6 3.7 4.8 5.9 7.0 0 1.1 2.2 3.3 4.4 5.5 6.6
Eigenmannia 2
0 1 2 3 4 5 6
Eigenmannia 4
0 1 2 3 4 5 6
6.8 7.9 9.0 10.1 11.2 12.3 13.4 14.515.6 16.7 17.8 Eigenmannia 1
0 2 4 6 8 10
1.1 2.2 3.3 4.4 5.5 6.6 7.7 8.8 9.9 11.0
Eigenmannia 3
0 1 2 3 4 5 6
6.6 8.8 11.0 13.2 15.4 17.6 19.8
Eigenmannia 5
0 0.5 1.0 1.5 2.0 2.5
1.5 3.3 5.1 6.8 8.6 10.3 12.1
Time (s) Time (s)
A
B
EOD frequency change (Hz)
Frequency change (Hz)
13.0 14.1 15.2 16.3 17.4 18.5 19.6 20.7 21.8 22.9 0
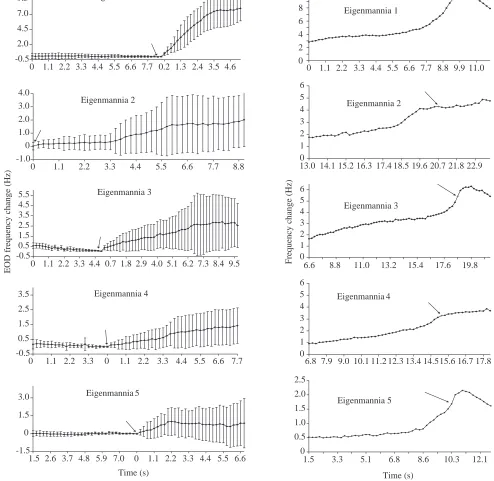
Fig. 5. (A) Averaged jamming avoidance responses of five trained Eigenmannia (see Table 2), as evoked by S+zerostimuli (of constant frequency
and initial ∆f=0 Hz; maximum frequency error +0.08 Hz with respect to the fish’s EOD). Ordinate, frequency change of electric organ discharge
(EOD) with respect to EOD frequency at stimulus onset (the arrows show where the time is set back to zero). Each point represents the mean of 20 EOD cycles sampled within a time window of 220 ms, using a 10 MHz clock. For each fish, between 9 and 17 individual curves (Table 2) were aligned such that the times of stimulus onset coincided, and averaged (values are means ±S.D.). (B) Averaged frequency change for the same five trained Eigenmannia, as evoked by S+zerostimuli. As in A, but individual frequency curves (N=9–17; Table 2) were aligned such that
[image:10.609.49.543.91.572.2]averaging is centred on stimulus onset) was revealed (Fig. 5B). In all fish, a steep frequency increase was observed immediately preceding the decision to ‘go’; in three fish, ‘go’ coincided with the steepest part of the frequency change. In the other two fish (fish 2 and 4) frequency continued to rise in a gentler manner once the decision to ‘go’ had been taken. The ‘go’-associated, marked frequency rise occurred within 3 s, and the highest ∆R values immediately followed ‘go’. In three fish,
once they had reached the feeder, EOD frequency relaxed to frequencies below or equal to their frequency before ‘going’.
Values of ∆R around the time of ‘go’ were very large given
that inter-trial intervals were usually only 1 min and that stimulus intensity was high. Short inter-trial intervals such as these, combined with the strong stimulus intensity applied here, led to marked, long-lasting habituation in ‘classical’ JAR experiments (Kramer, 1987). Habituation was not prominent in the present experiments: mean maximum ∆R values were a
record 9.37 Hz in fish 1, and still remarkable in fishes 2–5 (3.87 Hz, 5.94 Hz, 2.95 Hz and 1.94 Hz, respectively). The greatest individual (non-averaged) ∆R values were 14.13 Hz in
fish 1 and 11.07 Hz in fish 3.
Fish 5, which displayed the lowest ∆R values, was the one
that finally habituated completely to punishment with air bubbles (see above), and the correlation does not seem accidental. The time course of the frequency change of fish 5 (very moderate ∆R at first, but a strong response at decision
making) clearly demonstrates that the JAR served a sensory function in detecting stimulus waveform even in this fish. This suggests that fish 5 did discriminate between the two waveforms even after trial 9, when it stopped showing differential ‘go’ responses.
One of the functions of the frequency change behaviour of
Eigenmannia – be it called JAR or ‘active beat response’ (as
suggested by Kramer, 1996) – is clearly to enhance the detection of the EOD waveforms of other fish when discharge frequencies are too similar for beat analysis to be possible.
D. Weymann constructed and modified the equipment for phase-locked stimulation with ‘arbitrary’ waveforms. For their critically reading of an earlier version of the manuscript, I wish to thank S. Hanika and I. Kaunzinger. I wish to thank the editors and referees for constructive criticism. Supported by the Deutsche Forschungsgemeinschaft (grants SFB4/H1 and Kr 446/10-1 to 3).
References
Bass, A. H. (1986). Electric organs revisited: evolution of a vertebrate communication and orientation organ. In Electroreception (ed. T. H. Bullock and W. Heiligenberg), pp. 13–70. New York: John Wiley.
Bastian, J. (1990). Electroreception. In Comparative Perception, vol. II, Complex Signals (ed. W. C. Stebbins and M. H. Berkeley), pp. 35–89. New York: John Wiley.
Bastian, J. (1994). Electrosensory organisms. Phys. Today February 1994, 30–37.
Bennett, M. V. L. (1971). Electric organs. In Fish Physiology, vol.
V (ed. W. S. Hoar and D. J. Randall), pp. 347–491. London, New York: Academic Press.
Bullock, T. H., Hamstra, R. H. and Scheich, H. (1972a). The jamming avoidance response of high frequency electric fish. I. General features. J. Comp. Physiol. A 77, 1–22.
Bullock, T. H., Hamstra, R. H. and Scheich, H. (1972b). The jamming avoidance response of high frequency electric fish. II. Quantitative aspects. J. Comp. Physiol. A 77, 23–48.
Carr, C. E. (1990). Neuroethology of electric fish. Principles of coding and processing sensory information. BioScience 40, 259–267.
Carr, C. E., Heiligenberg, W. and Rose, G. J. (1986a). A time-comparison circuit in the electric fish midbrain. I. Behavior and physiology. J. Neurosci. 6, 107–119.
Carr, C. E., Maler, L. and Taylor, B. (1986b). A time-comparison circuit in the electric fish midbrain. II. Functional morphology. J.
Neurosci. 6, 1372–1383.
Cochran, W. G. and Cox, G. M. (1957). Experimental Designs, 2nd edition. New York: John Wiley.
Fleishman, L. J. (1992). Communication in the weakly electric fish Sternopygus macrurus. I. The neural basis of conspecific EOD
detection. J. Comp. Physiol. A 170, 335–348.
Fleishman, L. J., Zakon, H. H. and Lemon, W. C. (1992). Communication in the weakly electric fish Sternopygus macrurus. II. Behavioral test of conspecific EOD detection ability. J. Comp.
Physiol. A 170, 349–356.
Graff, C. and Kramer, B. (1992). Trained weakly-electric fishes Pollimyrus isidori and Gnathonemus petersii (Mormyridae,
Teleostei) discriminate between waveforms of electric pulse discharges. Ethology 90, 279–292.
Griffin, D. R. (1958). Listening in the Dark. Princeton: Yale University Press.
Hagedorn, M. (1986). The ecology, courtship and mating of gymnotiform electric fish. In Electroreception (ed. T. H. Bullock and W. Heiligenberg), pp. 497–525. New York: John Wiley. Heiligenberg, W. (1991). Neural Nets in Electric Fish. Cambridge,
MA: MIT Press.
Hopkins, C. D. (1974). Electric communication: functions in the social behavior of Eigenmannia virescens. Behavior 50, 270–305. Hopkins, C. D. and Bass, A. H. (1981). Temporal coding of species
recognition signals in an electric fish. Science 212, 85–87. Hopkins, C. D. and Heiligenberg, W. (1978). Evolutionary designs
for electric signals and electroreceptors in gymnotoid fishes of Surinam. Behav. Ecol. Sociobiol. 3, 113–134.
Hopkins, C. D. and Westby, G. W. M. (1986). Time domain processing of electric organ discharge waveforms by pulse-type electric fish. Brain Behav. Evol. 29, 77–104.
Kaunzinger, I. and Kramer, B. (1995). Electrosensory stimulus-intensity thresholds in the weakly electric knifefish Eigenmannia: reduced sensitivity at harmonics of its own organ discharge. J. Exp.
Biol. 198, 2365–2372.
Kaunzinger, I. and Kramer, B. (1996). Electrosensory phase sensitivity in the weakly electric fish Eigenmannia in the detection of signals similar to its own. J. Comp. Physiol. A 179, 323–330.
Kramer, B. (1985). Jamming avoidance in the electric fish Eigenmannia: harmonic analysis of sexually dimorphic waves. J. Exp. Biol. 119, 41–69.
Kramer, B. (1990). Electrocommunication in Teleost Fishes: Behavior and Experiments. Berlin: Springer-Verlag.
Kramer, B. (1994). Communication behavior and sensory mechanisms in weakly electric fishes. In Advances in the Study of
Behavior (ed. P. J. B. Slater, J. S. Rosenblatt, C. T. Snowdon and
M. Milinski), pp. 233–270. San Diego, CA: Academic Press. Kramer, B. (1996). Electroreception and Communication in Fishes.
Stuttgart: Gustav Fischer Verlag.
Kramer, B. (1999). Mechanisms of signal analysis in Eigenmannia (Gymnotiformes): the jamming avoidance response and communication. In Biology of Tropical Fishes (ed. A. L. Val and V. M. F. de Almeida-Val). Manaus: INPA (in press).
Kramer, B. and Kaunzinger, I. (1991). Electrosensory frequency and intensity discrimination in the wave-type electric fish
Eigenmannia. J. Exp. Biol. 161, 43–59.
Kramer, B., Kirschbaum, F. and Markl, H. (1981). Species specificity of electric organ discharges in a sympatric group of gymnotoid fish from Manaus (Amazonas). In Sensory Physiology
of Aquatic Lower Vertebrates (ed. T. Szabo and G. Czéh). Adv. Physiol. Sci. 31, 195–219. Budapest: Pergamon Press/Akadémiai
Kiadó.
Kramer, B. and Otto, B. (1988). Female discharges are more electrifying: spontaneous preference in the electric fish,
Eigenmannia. Behav. Ecol. Sociobiol. 23, 55–60.
Kramer, B. and Otto, B. (1991). Waveform discrimination in the electric fish Eigenmannia: sensitivity for the phase differences between the spectral components of a stimulus wave. J. Exp. Biol. 159, 1–22.
Kramer, B. and Teubl, H. (1993). Spectral phase sensitivity in the communication of a wave-type electric fish. Naturwissenschaften 80, 575–578.
Kramer, B. and Weymann, D. (1987). A microprocessor system for the digital synthesis of pulsed or continuous discharges of electric fish (or animal vocalizations). Behav. Brain Res. 23, 167–174. Kramer, B. and Zupanc, G. K. H. (1986). Conditioned
discrimination of electric waves differing only in form and harmonic content in the electric fish, Eigenmannia.
Naturwissenschaften 73, 679–680.
Lundberg, J. G., Fernandes, C. C., Albert, J. S. and Garcia, M. (1996). Magosternarchus, a new genus with two new species of electric fishes (Gymnotiformes: Apteronotidae) from the Amazon River Basin, South America. Copeia 1996, 657–670.
Mago-Leccia, F. (1994). Electric Fishes of the Continental Waters of America. Classification and Catalogue of the Electric Fishes of the Order Gymnotiformes (Teleostei: Ostariophysi), with Descriptions of New Genera and Species. Caracas: FUDECI (Fundacion para el
Desarrollo de las Ciencias Fisicas, Matematicas y Naturales). McGregor, P. K. and Westby, G. W. M. (1992). Discrimination of
individually characteristic electric organ discharges by a weakly electric fish. Anim. Behav. 43, 977–986.
Moller, P. (1995). Electric Fishes: History and Behavior. London: Chapman & Hall.
Motulsky, H. (1995). Intuitive Biostatistics. Oxford: Oxford University Press.
Neuweiler, G. (1993). Biologie der Fledermäuse. Stuttgart: Thieme-Verlag.
Paintner, S. (1998). Elektrosensorische Grundlagen der Impulskurvenformanalyse für die Individualerkennung bei
Pollimyrus adspersus (Mormyridae, Teleostei). PhD dissertation,
University of Regensburg.
Paintner, S. and Kramer, B. (1998). Electro-sensory basis of individual recognition by waveform analysis in Pollimyrus
adspersus (Mormyridae). Grahamstown, South Africa: PARADI
Conference, p. 322.
Planquette, P., Keith, P. and Le Bail, P.-Y. (1996). Atlas des Poissons d’Eau Douce de Guyane, vol. 1, Collection du Patrimoine Naturel, vol. 22. Paris: IEGB-M.N.H., INRA, CSP, Min. Env. Popper, A. N. and Fay, R. R. (1995). (eds) Hearing by Bats.
Springer Handbook of Auditory Research 5. Berlin: Springer
Verlag
Scheich, H. (1977a). Neural basis of communication in the high frequency electric fish, Eigenmannia virescens (jamming avoidance response). I. Open loop experiments and the time domain concept of signal analysis. J. Comp. Physiol. A 113, 181–206. Scheich, H. (1977b). Neural basis of communication in the high
frequency electric fish, Eigenmannia virescens (jamming avoidance response). II. Jammed electroreceptor neurons in the lateral line nerve. J. Comp. Physiol. A 113, 207–227.
Scheich, H. (1977c). Neural basis of communication in the high frequency electric fish, Eigenmannia virescens (jamming avoidance response). III. Central integration in the sensory pathway and control of the pacemaker. J. Comp. Physiol. A 113, 229–255.
Scheich, H. and Bullock, T. H. (1974). The detection of electric fields from electric organs. In Handbook of Sensory Physiology (ed. A. Fessard), pp. 201–256. Berlin, Heidelberg, New York: Springer-Verlag.
Schnitzler, H.-U. (1972). Control of Doppler shift compensation in the greater horseshoe bat, Rhinolophus ferrumequinum. J. Comp.
Physiol. A 82, 79–92.
Siegel, S. and Castellan, N. J., Jr (1988). Nonparametric Statistics for the Behavioral Sciences. New York: McGraw-Hill Book
Company.
Suga, N. (1990). Biosonar and neural computation in bats. Scient. Am. 262, 34–41.
Suga, N., Neuweiler, G. and Möller, J. (1976). Peripheral auditory tuning for fine frequency analysis by the CF-FM bat, Rhinolophus
ferrumequinum. IV. Properties of peripheral auditory neurons. J. Comp. Physiol. A 106, 111–125.
Szabo, T. (1967). Activity of peripheral and central neurons involved in electroreception. In Lateral Line Detectors (ed. P. Cahn), pp. 295–311. Bloomington, IN: Indiana University Press.
Watanabe, A. and Takeda, K. (1963). The change of discharge frequency by a.c. stimulus in a weak electric fish. J. Exp. Biol. 40, 57–66.
Zakon, H. H. (1986). The electroreceptive periphery. In
Electroreception (ed. T. H. Bullock and W. Heiligenberg), pp.
103–156. New York: John Wiley.