Bruce H. Braffman 1.2
Robert I. Grossman 1
Herbert I. Goldberg 1 Matthew B. Stern3 Howard I. Hurtig3 David B. Hackney1 Larissa T. Bilaniuk 1
Robert A. Zimmerman 1
This article appears in the November/Decem-ber 1988 issue of AJNR and the January 1989 issue of AJR.
Received December 7,1987; accepted after re-vision June 8, 1988.
Presented at the annual meeting of the American Society of Neuroradiology, New York City, May 1987.
This work was supported in part by a gift from Bernard Caplan.
1 Department of Radiology, Hospital of the Uni-versity of Pennsylvania, 3400 Spruce St., Philadel-phia, PA 19104. Address reprint requests to R. I. Grossman.
2 Present address: Department of Radiology, Memorial Hospital, 3501 Johnson St., Hollywood, FL 33021.
3 Department of Neurology, Hospital of the Uni-versity of Pennsylvania, Philadelphia, PA 19104, and The Graduate Hospital, 18th and Lombard Sts., Philadelphia, PA 19146.
AJNR 9:1093-1099, November/December 1988 0195-6108/88/0906-1093
© American Society of Neuroradiology
1093
MR Imaging of Parkinson Disease
with Spin-Echo and Gradient-Echo
Sequences
High-field MR with both spin-echo and gradient-echo sequences was performed in 21 patients with (idiopathic, drug-responsive) Parkinson disease. The use of gradient echoes allowed more sensitive detection than did spin echoes of susceptibility changes in the putamina and substantia nigra. No statistically significant difference in putaminal hypointensity on long TR/long TE spin-echo sequences or on T2*-weighted images using gradient-echo sequences was observed between Parkinson patients and controls. There was also no statistically significant difference in the frequency of restoration of the signal intensity of the substantia nigra between the two groups of patients. The width of the pars compacta of the substantia nigra in patients with Parkinson disease was 2.12
+
0.82 mm (mean ± SO). This value in age- and gender-matched controls was 2.67 ± 0.5. Comparing these two groups with an unpaired t test resulted in a p value less than or equal to .005.Our MR study with spin-echo and gradient-echo images in Parkinson and control patients was able to substantiate and elaborate on previously described MR features of Parkinson disease.
Several investigators have described the MR imaging features of Parkinson disease (i.e., the primary or idiopathic form) and parkinsonian syndromes (i.e.,
secondary parkinsonism or Parkinson plus) [1-4]. Their pioneering work pointed to the utility of MR as a diagnostic tool in the evaluation of these patients. Drayer et al. [1] and Pastakia et al. [2] described an abnormal decrease in signal intensity of the putamina on long TRjlong TE spin-echo sequences in multiple-system atrophy, a parkinsonian syndrome, probably due to iron (or other paramagnetic)
deposition. Duguid et al. [3] found a narrowing of the signal from the pars compacta
of the substantia nigra in Parkinson patients relative to controls. Rutledge et al. [4] reported a loss of the normal hypointensity on long TRjlong TE spin-echo images in the dorsal lateral aspect of the substantia nigra in patients with Parkinson disease and parkinsonian syndromes. They referred to this as restoration of the signal
intensity of the substantia nigra. They also observed an abnormal decrease in the signal intensity of the putamen on long TRjlong TE spin-echo sequences in two
patients with unclassified parkinsonism, but not in patients with Parkinson disease. Our study used a gradient echo to emphasize the susceptibility effects
(hypoin-tensity on long TR images) noted by other investigators and prospectively included only those who met the clinical criteria for Parkinson disease. The objective was to
identify which of the MR features described above are seen in a group of patients
with a relatively homogeneous clinical syndrome.
Subjects and Methods
1094 BRAFFMAN ET AL. AJNR:9, November/December 1988
Parkinson patients ages 41-76 years old, including 11 men and 10 women. Controls were selected by retrospectively reviewing patients scanned for reasons unrelated to movement disorders. Medical charts of control subjects were reviewed. All had received a neurologic examination. They had various neurologic deficits, but none of these controls had bradykinesia, resting tremor, rigidity, festinating gait, or other symptoms of Parkinson disease. Controls were excluded if there was evidence on MR of a mass in the midbrain distorting the anatomy of the substantia nigra. Controls with a history of radiation injury, Alzheimer disease, and multiple sclerosis (i.e., disorders that may result in abnormal concentrations of brain iron (6)} were ex -cluded. This yielded 24 MR studies of controls.
All patients and controls were examined on a 1.5-T unit* with both spin-echo and gradient-echo sequences. The spin-echo sequences used a short TR, 600/20 (TRITE), and a long TR, 2500/20,80 (TR/ first-echo TE, second-echo TE). Acquisition time was 2.5 min and 10 min 48 sec for the short and long TR sequences, respectively.
Gradient-echo images were obtained in patients and controls by using one of two sequences. The gradient-recalled acquisition in the steady state (GRASS) technique, 200/50, used an RF pulse angle of 10°. The scanning time was approximately 45 sec per slice. The partial-saturation interleave technique, 750/50, also used an RF pulse angle of 10°. These parameters resulted in contrast based mainly on T2* differences [7, 8). Scanning time was approximately 3 min 48 sec for eight to 12 sections. For both spin-echo and gradient-echo sequences, section thickness was 5 mm with a 2.5-mm interval between sections. The scanning plane was axial, 0-20° degrees positive to the inferior orbitomeatalline.
We analyzed the intensity of the putamina in patients and controls with both the gradient-echo and spin-echo techniques on relatively
T2*- and T2-weighted images (i.e., long TR/long TE sequences),
respectively. Three neuroradiologists evaluated the MR images of patients and controls in a blinded fashion. Visual analysis was stand-ardized to four discrete ratings. Grades 0-3 were variable pattems of hypointensities of the putamina relative to cortical gray matter. Grade 0 was for no hypointensity (Fig. 1); grade 1 was for hypoin-tenSity limited to the lateral margin of the putamen (Fig. 2); grade 2 was for hYPointensity extending through part of the body of the putamen (Fig. 3); and grade 3 was for diffuse hypointensity of the entire putamen (Fig. 4).
The Signal intensity of the substantia nigra was recorded as normal, restored, or questionably restored (i.e., loss of the normal hypoin-tensity of the dorsal lateral aspect of the substantia nigra), as de-scribed by Rutledge et al. (4), on both spin-echo and gradient-echo sequences (Fig. 5).
Duguid et al. (3) described the anatomy of the pars compacta of the substantia nigra on MR. They found no significant change in the width of the pars compacta when the scanning plane was oriented between 0° and 20° positive to the inferior orbitomeatal line. On a
long TR spin-echo sequence, the pars compacta is the relatively
hyperintense band between the hypointense pars reticulata of the substantia nigra and the hYPointense red nucleus (Fig. 6).
The width of the pars compacta signal in patients and controls was measured on the basis of a variation of the method described by Duguid et al. (3). Intensity values of a straight line perpendicular to the pars compacta through the center of the red nucleus were measured on an image of the midbrain. We drew two additional parallel straight lines 1 mm to either side. At the half-height maximum intensity value between the hypointense red nucleus and relatively hyperintense pars compacta we placed one cursor. At the corre-sponding half-height maximum intensity value between the pars compacta and relatively hypointense pars reticulata we placed a
• General Electric, Milwaukee, WI.
second cursor. The distance between the two was taken as the width of the pars compacta. We averaged three values for each pars compacta. The precision of this method was determined by-repeating
the measurements on three separate occasions in three different
subjects. In each subject, a mean width and a standard deviation were determined. The standard deviation divided by the mean width was taken as a measure of the precision (9). The average precision in these three patients was 3.4%.
Additional observations on MR, such as the presence of punctate
hyperintense foci on long TR images in the globus pallid us and
substantia nigra and presence of cortical atrophy (none, mild, mod -erate, and marked), were recorded.
Results
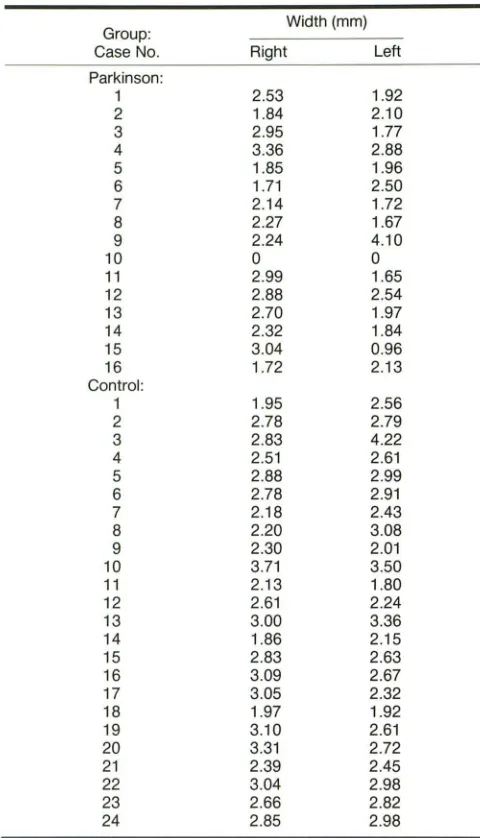
The widths of the pars compacta in both groups are listed
in Table 1. Five Parkinson patients were either unable to
maintain the head position in order to scan through the midbrain at 0-20° positive to the inferior orbitomeatal line or
moved during scanning, and therefore were excluded. (In one
of these five patients, the midbrain nuclei were not identified
on MR, possibly because of the 2.5-mm gap between 5-mm
slices.) The mean width in the Parkinson group was 2.12 mm
(SD = 0.82). This value in the age- and gender-matched
controls was 2.67 mm (SD = 0.5). There was a significant
overlap between the two groups, as reflected in the relatively large standard deviations and as seen in Table 1. Nonethe-less, comparing these two groups with an unpaired t test [9]
resulted in a p value less than or equal to .005. In some (but
not all) cases, the smaller width of the pars compacta in Parkinson patients was visibly detectable (Fig. 7 A). MR in one
Parkinson patient was notable for a width of 0 of the pars
compacta; that is, there was complete loss of the
hyperin-tense band between the red nucleus and the pars reticulata
(Fig.7B).
The grades of the intensities of the putamina on the
spin-echo and gradient-echo images are listed in Table 2. In one
Parkinson patient, putamina were graded 3 bilaterally on the
spin-echo sequence (Fig. 4). This same patient and an
addi-tional Parkinson patient (whose putamina were graded 1 on
the spin-echo sequence) had putamina that were graded 3
bilaterally on gradient-echo sequences. No control subject had putamina that were graded 3 on either gradient-echo or
spin-echo sequences. The number of Parkinson patients and
controls included in this study is not large enough to determine
whether the number of patients with putamina graded 3 is
statistically significant. The grades of the two groups of
subjects could be compared by using a chi-square test if
there were five or more putamina of each grade [9]. To
achieve this, we combined grades 2 and 3. A comparison of
the grades of the putamina in the Parkinson group with those
in the control group by using chi-square revealed no
statisti-cally significant difference between the two groups (x2 = .693,
P > .05 on spin-echo sequences and x2
= .024, P .05 on
gradient-echo sequences).
Restoration of the signal intensity of the substantia nigra
was seen in 10 (24%) of 42 Parkinson patients and in seven
(15%) of 48 control patients on spin-echo sequences (Table
AJNR:9. November/December 1988
Fig. 1.-MR image (2500/80) of
49-year-old man with Parkinson disease. Globi pallidi (arrows) are hypo intense relative to cortical gray mailer. Putam-ina (arrowheads) are isointense. Pu-tamina were graded O.
Fig. 2.-MR image (2500/80) of 76-year-old man with Parkinson disease. Hypointensity is limited to lateral as-pect of putamina. (arrowheads), left
side greater than right. Both were graded 1.
Fig. 3.-MR image (2500/80) of 73-year-old woman with Parkinson dis -ease. Bilateral putaminal hypointensity involves most, but not all, of putamina. They were graded 2. Also note bilateral punctate hyperintense foci (arrow·
heads) in globi pallidi.
Fig. 4.-MR image (2500/80) of 68-year-old man with Parkinson disease. Hypointensity involves entire putamina
diffusely. They were graded 3.
Fig. 5.-MR image (2500/80) of 64-year-old man with Parkinson disease. There is loss of normal hypointensity (arrows) of dorsal lateral aspect of sub-stantia nigra; that is, there is restoration of signal intensity [4].
Fig. 6.-MR image (2500/80) of
60-year-old woman scanned for unrelated disorder (control subject). Scanning plane is 0-20° positive to inferior orbi-tomeatal line. Pars compacta of sub-stantia nigra (short solid arrow) is the relatively hyperintense band between hYPointense pars reticulata (long solid
arrow) of substantia nigra and hypoin -tense red nucleus (open arrow).
MR OF PARKINSON DISEASE 1095
3
4
[image:3.613.52.558.80.743.2]1096 BRAFFMAN ET AL. AJNR:9, November/December 1988
TABLE 1: Measured Widths of the Pars Compacta of Substantia Nigra in Parkinson and Control Subjects
Group: Width (mm)
Case No. Right Left
Parkinson:
1 2.53 1.92
2 1.84 2.10
3 2.95 1.77
4 3.36 2.88
5 1.85 1.96
6 1.71 2.50
7 2.14 1.72
8 2.27 1.67
9 2.24 4.10
10 0 0
11 2.99 1.65
12 2.88 2.54
13 2.70 1.97
14 2.32 1.84
15 3.04 0.96
16 1.72 2.13
Control:
1 1.95 2.56
2 2.78 2.79
3 2.83 4.22
4 2.51 2.61
5 2.88 2.99
6 2.78 2.91
7 2.18 2.43
8 2.20 3.08
9 2.30 2.01
10 3.71 3.50
11 2.13 1.80
12 2.61 2.24
13 3.00 3.36
14 1.86 2.15
15 2.83 2.63
16 3.09 2.67
17 3.05 2.32
18 1.97 1.92
19 3.10 2.61
20 3.31 2.72
21 2.39 2.45
22 3.04 2.98
23 2.66 2.82
24 2.85 2.98
Note.-Five of the 21 Parkinson patients are not included here because they were unable to maintain proper head position for scanning through the
midbrain at 0-20° positive to the inferior orbitomeatal line, or moved during
scanning.
patients, comparing the two groups with chi-square revealed
the difference was not statistically significant (x2
= 2.86, P
>
.05). On gradient-echo sequences, the substantia nigra was
restored in four (10%) of 40 Parkinson patients and in two
(4%) of 46 controls (Table 3). The substantia nigra was in the
restored category in too few patients (less than five) on
gradient-echo sequences to determine statistical significance.
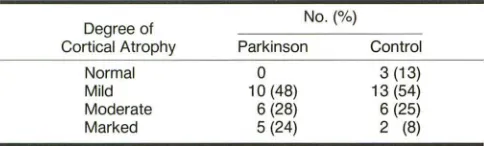
Atrophy was more common in the Parkinson group than in
the control group (Fig. 8) (Table 4). Comparing the two groups
with chi-square revealed the difference was not statistically
significant (x2
= 3.285, P
>
.05). However, in selectingcon-trols, we did not exclude subjects with disorders that may
result in atrophy. It is possible that this difference in atrophy
would be statistically significant if it were compared with otherwise normal elderly subjects.
Three patients had bilateral hyperintense foci on the long TR spin-echo sequences in the globi pallidi (Fig. 3). One of these patients was hypertensive; the other two were neither hypertensive nor had other cardiovascular risk factors. No control subject revealed these features.
Four patients had hyperintense foci on the long TR spin -echo sequences in the substantia nigra or in adjacent struc-tures (Fig. 9). None of these patients was hypertensive or had other cardiovascular risk factors. Three control subjects re-vealed similar findings. One was hypertensive while the others were neither hypertensive nor had other cardiovascular risk factors.
Discussion
Although known since ancient times, Parkinson disease, or paralysis agitans, was first described concisely by James Parkinson in 1817 [10]. The disease is relatively prevalent. Approximately 1 % of the population over the age of 50 years in the United States is affected, for a total of approximately a half million people [5]. Its onset is between 40 and 70 years of age.
The neuropathologic hallmark of the disease is loss of neuromelanin-containing neurons in the substantia nigra (most marked in the central part of the pars compacta), the locus ceruleus, and the dorsal vagal nucleus [17-17]. Asso-ciated changes of gliosis occur at these sites. The remaining cells contain Lewy bodies, an eosinophilic cytoplasmic inclu-sion.
Our study corroborated the results described by Duguid et al. [3] regarding a decreased width in the pars compacta of the substantia nigra in Parkinson patients. As those authors commented, this MR appearance probably reflects the atro-phy of this structure described in the neuropathologic litera-ture, but possibly may be due to increased iron in this region. Of interest are the four parkinsonian patients who, in addi-tion to a decreased breadth of the pars compacta, revealed punctate hyperintense foci of the substantia nigra on long TR spin-echo sequences (Fig. 9). This may represent the gliosis
that accompanies the cell loss of the pars compacta. Similar
punctate hyperintense foci of the substantia nigra in three control subjects, however, illustrate the lack of specificity of
this latter observation.
Gradient-echo images are more sensitive than spin-echo images to local magnetic field inhomogeneity [18]. This greater sensitivity accounts for the higher grading of the
putamen and lower incidence of restoration of the substantia
nigra in both Parkinson patients and controls on
gradient-echo compared with spin-echo images (Tables 2 and 3). We
were unable to detect a statistically significant difference in
the grading of the putamen in the Parkinson group compared with the control group on either spin-echo or gradient-echo sequences. However, we did observe grade 3 in both puta-mina of one Parkinson patient with the spin-echo technique
(Fig. 4) and in an additional patient with the gradient-echo
[image:4.612.53.293.106.525.2]AJNR:9, November/December 1988 MR OF PARKINSON DISEASE 1097
Fig. 7.-A, MR image (2500/80) of 76-year-old woman with Parkinson dis-ease (same patient as in Fig. 2). Ob-serve narrowed hyperintense band (pars compacta of left substantia nigra) between hypointense pars reticulata of left substantia nigra and left red nu-cleus. Right pars compacta is not af-fected as markedly.
B, MR image (2500/80) of 73-year-old woman with Parkinson disease (same patient as in Fig. 3). Note com-plete loss of normal hyperintense band between pars reticulata of substantia nigra and red nuclei bilaterally.
TABLE 2: Putaminallntensities in Parkinson and Control Patients on Spin-Echo and Gradient-Echo Sequences
Sequence: No.(%)
Intensity Grade Parkinson Control Spin-echo 2500/80:
0 5 (12) 6 (13)
1 30 (71) 36 (75)
2 5 (12) 6 (13)
3 2 (5) 0
Gradient-echo:
0 6 (15) 3 (7)
1 17 (43) 24 (52)
2 13 (33) 19 (41)
3 4 (10) 0
Note.- Grade 0 = no hypointensity; 1 = hypointensity limited to the lateral margin of the putamen; 2 = hypointensity extending through part of the body of the putamen; 3 = diffuse hypointensity of the entire putamen.
TABLE 3: Restoration of the Signal Intensities [4] of the
Substantia Nigra in Parkinson and Control Patients on Spin-Echo and Gradient-Echo Sequences
Sequence: No.(%)
Signal Intensity Parkinson Control Spin-echo 2500/80:
Restored 10 (24) 7 (15)
Normal 32 (76) 41 (85)
Gradient-echo:
Restored 4 (10) 2 (4)
Normal 36 (90) 44 (96)
patient and control populations were not large enough to determine whether these one or two patients whose putamina were graded 3 constitute a statistically significant group.
Drayer et al. [1] reviewed the literature regarding brain iron and Parkinson disease. Earle [16] found that measurements of brain tissue iron concentration by X-ray fluorescent
spec-trographic analysis in 11 formalin-fixed brains of subjects with Parkinson disease were increased by a factor of 2 or more
8
as compared with normals. Earle noted a generalized shift of this element rather than a focal deposition of this substance.
Other authors have reported a localized deposition of iron.
Rojas et al. [19] found an increase in glial and neuronal intracytoplasmic iron pigments in the ventrolateral thalamic, lentiform, and caudate nuclei, but not in the cerebral cortex in Parkinson patients (four idiopathic, two "arteriosclerotic," one postencephalitic). Five of these subjects who either had autopsy or had a needle biopsy of the liver also had a systemic siderosis. Unlike the description of Rojas et al. of no iron in the cerebral cortex, Kingo [20] described a positive iron reaction in the frontal cortex and substantia nigra in Parkinson patients. Lhermitte et al. [21] observed increased iron in the globus pallid us in one case of postencephalitic parkinsonism. Barbeau and Boileau [22] demonstrated an increase in urinary iron excretion in Parkinson patients following a single mus-cular injection of iron chelates, suggesting an increase in body storage of mobile iron in Parkinson disease. In a recent study, Rutledge and Schallert [23] evaluated the effect of adminis-tering a catecholaminergic neurotoxin to rats. On MR, these subjects revealed an abnormal hypo intensity in the striato-nigral tract. The authors suggested this may be due to ferritin deposition.
The conclusive role of iron or another paramagnetic sub-stance (striatal, nigral, and/or other) in Parkinson patients awaits further investigation. On the basis of our study, how-ever, most patients with Parkinson disease do not demon
-strate a pattern of putaminal hypointensity on long TR/long TE spin-echo images or on T2*-weighted images (gradient-echo sequences) that differs from that of controls. Alterna-tively, patients with the parkinsonian syndromes of multiple
-system atrophy, Shy-Drager syndrome, and progressive su-pranuclear palsy may reveal more marked putaminal hypoin-tensity on these sequences than do either Parkinson patients or normals [1, 2]. Therefore, MR may serve as an adjunct to the clinical examination in differentiating Parkinson disease from certain parkinsonian syndromes.
[image:5.614.173.555.85.283.2] [image:5.614.53.297.327.453.2] [image:5.614.53.296.534.626.2]1098 BRAFF MAN ET AL. AJNR:9. November/December 1988
8
9
TABLE 4: Cortical Atrophy in Parkinson and Control Patients
Degree of No.(%)
Cortical Atrophy Parkinson Control
Normal 0 3 (13)
Mild 10 (48) 13 (54)
Moderate 6 (28) 6 (25)
Marked 5 (24) 2 (8)
than in controls, it was not a statistically significant difference. Rutledge et al. [4] suggested the restoration of signal intensity may be due to depletion of iron by increased cellular metabolic activity or local cell death resulting in expansion of the
extra-cellular space, which overwhelms the T2* effect and increases
the signal.
The significance of pallidal lesions in Parkinson disease is controversial. Pakkenberg [24] described a paleness of the cytoplasm of pallidal cells in Parkinson patients. Denny-Brown
[25] observed pallor in myelin-stained preparations of the
globus pallidus in these subjects. Lipkin [26] reported atrophy of the globus pallidus in these patients compared with
age-matched controls. However, other investigators found no
difference in the pallidi of Parkinson patients compared with controls [13, 14, 27-29). Oppenheimer [17] commented that the above-described pathologic changes of the basal ganglia
are seen in elderly people not suffering from parkinsonism. In
our study, bilateral pallidal hyperintense foci on long TR
spin-echo images were noted in three of the 21 Parkinson patients
(Fig. 3) and in none of the 24 controls. This suggests there
may be an increased incidence of such lesions in Parkinson patients. Rutledge et al. [4] observed similar findings in four
of their seven patients with Shy-Drager syndrome. They
suggested that the appearance of the globus pallidus may
allow distinction between olivopontocerebellar degeneration
and Shy-Drager syndrome on MR. Our observation of this
change in three patients with Parkinson disease implies that
it may not allow such differentiation.
Fig. B.-MR image (2500/20) of 76-year-old man with Parkinson disease. Observe marked cortical and central parenchymal loss with enlarged
sub-arachnoid spaces, particularly of
par-ietooccipitallobes, and enlarged lateral ventricles.
Fig. 9.-MR image (2500/20) of
67-year-old woman with Parkinson dis-ease. Observe bilateral punctate hy-perintense foci (arrows) in substantia
nigra. One lesion is at junction of left
pars reticulata and pars compacta; the other is in right pars compacta.
We found moderate or marked atrophy in 52% of our patients and in 33% of our controls. Although the difference was not statistically significant, in selecting controls we did not exclude those with other processes that may result in
atrophy. Alvord [15] stated that atrophy probably is significant
and beyond what one would expect for age. Rutledge et al. [4] found generalized atrophy in 86% of patients with parkin-sonism and in 56% of age-matched controls.
The progress in our understanding the features of
Parkin-son disease on MR may parallel the experience of F. H. Lewy,
as described and quoted by Alvord [15]. After a lifetime of study of Parkinson disease, Lewy said, "When I had investi-gated my first two dozen cases, ... I was convinced that I knew where the cause of tremor and rigidity was located.
When I had examined pathologically the seventh dozen, ... I
was completely confused because you seemed to be able to prove just as well one theory as the contrary one."
Our data confirm certain MR features of Parkinson disease: 1. There is a statistically significant decrease in the width of the pars compacta [3). This probably reflects selective loss of neuromelanin-containing cells of the pars compacta of the
substantia nigra, but may also be due to iron deposition. This
may be the characteristic feature of the disease on MR. In some cases, accompanying hyperintense foci may be seen that may represent the concomitant gliosis.
2. Most Parkinson patients do not show a pattern of putaminal hypointensity on long TRjlong TE spin-echo images
or on T2*-weighted images (gradient-echo sequences) that
differs from that of controls.
3. Although restoration of the signal intensity of the sub-stantia nigra [4] occurred more often in Parkinson patients
than in controls, it was not statistically sig'nificant in our study.
4. Moderate and marked cortical atrophy occurred more
often in Parkinson patients than in controls; however, the difference was not statistically significant.
5. Pallidal lesions, which may be the same lesions
[image:6.612.57.469.90.290.2] [image:6.612.55.297.322.395.2]AJNR:9, November/December 1988 MR OF PARKINSON DISEASE 1099
ACKNOWLEDGMENT
We thank Harold Kundel for assistance with the statistical analysis
of our data.
REFERENCES
1. Drayer BP, Olanow W, Burger P, et al. Parkinson plus syndrome: diagnosis using high field MR imaging of brain iron. Radiology 1986;159:493-498
2. Pastakia B, Polinsky R, Di Chiro G, et al. Multiple system atrophy
(Shy-Drager syndrome): MR imaging. Radiology 1986;159:499-505
3. Duguid JR, De La Paz R, DeGroot J. Magnetic resonance imaging of the midbrain in Parkinson's disease. Ann Neuro/1986;20:744-747
4. Rutledge IN, Hilal SK, Silver AJ, Defendi R, Fahn S. Study of movement disorders and brain iron by MR. AJNR 1987;8:397-411
5. Adams RD, Victor M. Diseases characterized by abnormalities of posture and movement. In: Principles of neurology, 2nd ed. New York: McGraw-Hill,1981:807-813
6. Drayer BP. Degenerative brain disorders and brain iron. In: Brant-Zawadzki M, Norman D, eds. Magnetic resonance imaging of the central nervous
system. New York: Raven, 1987:123-130
7. Wehrli F, Prost JH, Roberts F. The distinguishing properties of gradient-recalled acquisition in the steady state (GRASS). Magn Reson Imaging 1987;5[SuppI1]:105
8. Buxton RB, Edelman RR, Rosen BR, et al. Contrast in rapid MR imaging: T1- and T2-weighted imaging. J Comput Assist Tomogr 1987;11(1):7-16 9. Fleiss JL. Statistical methods for rates and proportions, 2nd ed. New York:
Wiley, 1981
10. Parkinson J. An essay on the shaking palsy. London: Whitingham & Rowland, 1817. (Reprinted in Critchley M, ed. James Parkinson. London: Macmillan, 1955)
11. Tretiakoff C. Contribution a I'etude de I'anatomie pathologique du locus niger [Thesis]. Paris: University of Paris, 1919
12. Foix MC. Les lesions anatomiques de la maladie de Parkinson. Rev Neurol (PariS) 1921;28:593-600
13. Hassler R. Zur Pathologie der Paralysis agitans und des postenzephali-tischen Parkinsonismus. J Psychol Neuro/1938;48:387-476
14. Klaue R. Parkinsonsche Krankheit (paralysis agitans) und
postencephali-tischer Parkinsonsimus. Eur Arch Psychiatry Neural Sci 1940;111:
251-321
15. Alvord EC. The pathology of parkinsonism. In: Minckler J, ed. Pathology of the nervous system, vol. 1. New York: McGraw-Hili, 1968: 1152-1161 16. Earle KM. Studies on Parkinson's disease including x-ray fluorescent
spectroscopy of formalin fixed brain tissue. J Neurapathol Exp Neural 1968;27:1-14
17. Oppenheimer DR. Diseases of the basal ganglia, cerebellum, and motor neurons. In: Adams JH, Corsellis JAN, Duchen LW, eds. Greenfield's
neuropathology, 4th ed. New York: Wiley-Medical, 1984:699-747
18. Edelman RR, Johnson K, Buxton R, et al. MR of hemorrhage: a new approach. AJNR 1986;7:751-756
19. Rojas G, Asenjo A, Chiorino R, Aranda L, Rocamora R, Donso P. Cellular and subcellular structure of the ventrolateral nucleus of the thalamus in Parkinson disease. Deposits of iron. Appl Neuraphysio/1965;26:362-376
20. Kingo S. Sobre la reaccion de fierro en el cerebro en los parkinsonismus postencefalicos. Fukuoka Ikwadsigaku Zasshi 1934;27:142
21. Lhermitte J, Kraus WM, McAlpine D. Etude des produits de desintegration et des depots du globus pallid us dans un cas de syndrome parkinsonien.
Rev Neurol (Paris) 1924;1 :356-361
22. Barbeau A, Boileau JL. Mobilizable iron in Parkinson's disease (abstract).
Neurology 1969;19:314
23. Rutledge IN, Schallert T. Evaluation of iron distribution by MR T2· effect in unilateral dopamine depleted rats. Presented at the annual meeting of the Society of Magnetic Resonance in Medicine, New York City, August 1987
24. Pakkenberg H. Globus pallid us in parkinsonism. Acta Neurol Scand {Suppl] 1963;39: 139-144
25. Denny-Brown D. The basal ganglia and their relation to disorders of
movement. London: Oxford University, 1962
26. Lipkin LE. Cytoplasmic inclusions in ganglion cells associated with parkin-sonian states; a neurocellular change studied in 53 cases and 206 controls. Am J Patho/1959;35: 1117-1133
27. Hassler R. Zur pathologischen Anatomie des senilen und des
parkinson-istischen Tremor. J Psychol Neuro/1939;49: 193
28. Hallevorden J. Zur Pathogenese des postencephalitischen Parkinson is-mus. Klin Wochenschr 1933;12:692-695
29. Hallevorden J. Anatomische Untersuchungen zur Pathogenese des post