Running head: INTACT HEMODYNAMIC RESPONSE IN AGING
Comparability of Functional MRI Response in Young and Old during Inhibition
Kristy A. Nielson*†§, Scott A. Langenecker*, Thomas J. Ross†, Hugh Garavan†,
Stephen M. Rao‡, & Elliot A. Stein†
*Department of Psychology and the Integrative Neuroscience Research Center,
Marquette University, Milwaukee, Wisconsin, USA; Departments of †Psychiatry
and Behavioral Medicine, ‡Neurology, and the §Foley Center for Aging and
Development, Medical College of Wisconsin, Milwaukee, Wisconsin, USA
Correspondence and requests for reprints should be addressed to: Kristy A.
Nielson, Ph.D., Department of Psychology, Marquette University, P.O. Box 1881,
Milwaukee, WI 53201-1881 (kristy.nielson@marquette.edu), 414-288-5333 fax.
This work was performed at and supported in part by the Foley Center for Aging
Abstract
An important issue in examining special populations with fMRI is the integrity of the hemodynamic response. Although the application of fMRI to aging issues is growing rapidly, very little systematic study of the
hemodynamic response has been done in older individuals and no studies have examined it using cognitive rather than perceptual or motor tasks. As such, fMRI was employed with 28 healthy young and older adults on an inhibitory control task. The results showed that although older and young adults differed in task performance and activation patterns, they had comparable hemodynamic responses. The results suggest that activation patterns during inhibition, which predominantly showed increased activation in elders, were not due to vascular confounds or specific changes in
hemodynamic coupling.
Introduction
Cognitive neuroscience research, which focuses on revealing brain-behavior
relationships, is most recently being applied toward understanding age-related
declines in cognitive abilities such as memory and attention. The extant
neuroimaging literature on cognitive aging thus far is small but growing rapidly.
Indeed, although there are some inconsistencies, a common finding is that older
adults activate more regions of the brain during tasks than do young adults, a
finding that is often called “recruitment” 1-5.
One drawback, however, to the use of fMRI to study aging-related cognitive
issues is that because the underlying physiological principle on which fMRI is
based is hemodynamic coupling to neuronal activity 6, generalized cerebrovascular
changes associated with aging could alter one or more parameters of the
hemodynamic response. Indeed, studies evaluating visual cortex response to
passive stimulation reported decreased fMRI signal amplitude in older adults 7,8,
which was suggested could be due to an age-related alteration in functional activity
or hemodynamic coupling 8. Motor cortex response to a 10 s hand squeezing task
also showed altered rise but not fall time in elders, suggesting slowed signal due to
vascular changes 9. These findings are particularly important in light of other
reports that older adults have somewhat noisier signals (i.e., greater variability)
than young adults, which could confound interpretation whenever elders exhibit
reduced activation relative to young 7,10. Importantly, purely sensory or motor
tasks, for which older adults have less acuity and ability 11 could reduce detectable
signal magnitude, which could be exacerbated by increased variability in the
“performance” in the groups, the meaningfulness of the result is unclear and the
issue of hemodynamic integrity remains unresolved. A sensory-motor response
task recently showed marked amplitude reductions in elders in visual cortex, but
comparable signals to young in other regions and when overall relative activation
changes were measured 15. However, no studies have examined whether there
are age-related differences in hemodynamic response properties during cognitive
tasks or under comparable performance conditions.
We therefore used event-related fMRI to evaluate hemodynamic response
parameters in 28 healthy participants, 14 older and 14 young adults during an
inhibition (go/no-go) task. The data are a subset of those used in a previous study
5
. Only accurately performed trials were included for analysis, essentially equating
the participant groups for task performance. Each response parameter was
computed for all active brain voxels of successful trials for each participant and
then averaged across the clusters of interest. Healthy older and young adults were
expected to exhibit comparable hemodynamic response parameters.
Materials and Methods
Participants. Fourteen young adults (8 M, 6 F) aged 19 to 44 (mean = 29.7;
SD = 8.3) and fourteen older adults (6 M, 8 F) age 60 to 77 (mean = 71.1; SD =
4.3) participated in the study. All older adults had Mini-Mental State Exam 16
scores above 26 (mean = 28.6, SD = 1.5) and Geriatric Depression Scale 17 scores
below 10 (mean = 2.5, SD = 2.3). All participants were right-handed, highly
educated (young = 15.7 years, SD = 1.6; old = 18.2 years, SD = 2.0), and free of
time of testing. The Internal Review Board approved all procedures and written
informed consent was obtained prior to testing.
Task. The go/no-go inhibition task is described in detail elsewhere 5,18. It
presented a serial stream of letters, one each 500 ms with a 0 ms interstimulus
interval, with intermittent semi-random targets requiring response (average every
3.5 sec; 150 total) and lures (response to be inhibited) quasi-randomly and rarely
(>15 second inter-lure interval; 25 total).
Neuroimaging. Whole-brain fMRI imaging was conducted on a 1.5T GE
Signa scanner with a 30.5 cm i.d. 3-axis local gradient coil and an endcapped
quadrature birdcage radio-frequency head-coil 19, 7mm contiguous sagittal slices, a
blipped gradient echo-planar pulse sequence (TE = 40 msec; TR = 2000 msec;
FOV = 24 cm; 64 x 64 matrix; 3.75 mm x 3.75 mm in-plane resolution), and spoiled
GRASS anatomic images for anatomical localization 20. Analysis was performed
with AFNI v. 2.2 21. Functional images were modelled with a γ-variate function
using non-linear regression (NLR) optimization5,18. The model, y = ktre -t/b, allowed
the scaling parameter, k, to vary freely, constrained onset time (t or t0) to within 4
sec of lure events, and constrained the exponential parameters, r (largely
representing rise time) and b (largely representing fall time), to a range similar to
previously published estimate 22: 8 ≤ r ≤ 9, 0.15 ≤ b ≤ 0.45. Parameters and
derived quantities, such as response magnitude, computed as % area under the
curve (AUC), were smoothed (4.2 mm full-width-at-half-maximum isotropic
Gaussian filter) and stereotaxically normalized prior to group analyses. Separate,
voxel-wise, one-sample t-tests were then performed for old and young groups
contiguous, significant voxels. A Monte-Carlo randomization procedure
established a false-positive statistical threshold for clusters or regions of interest
(ROIs), accounting for multiple comparisons (t = 4.22; p < .001) 5. These clusters
were then combined and compared between groups by t-test (p < .01 criterion) 5.
Hemodynamic parameter analysis. The four parameters (t0, k, r, b) were
each averaged across all voxels of each significant cluster for each subject,
followed by t-tests between groups for each averaged cluster parameter value (p <
.01 criterion). The large number of comparisons increased the false positive
likelihood, but this risk was deemed acceptable because of the hypothesis of no
differences. A second analysis with less Type I error risk, averaging the
parameters across the ten largest clusters, was also used.
Results
Behavioral data. Overall, participants in both groups performed well on the
task (O = 98.1% (SD = 1.2), Y = 99.1% (SD = 1.7), t(26) = 1.8, p > .05). However,
older adults were slower to respond to targets (O = 505.4 ms (SD = 58.6), Y =
459.6 ms (SD = 46.0), t(26) = -2.3, p < .03) and had fewer “successful inhibitions”
(O = 79.1% (SD = 14.8), Y = 92.6% (SD = 4.1), t(26) = 3.3, p < .01) than young
adults. This finding is consistent with the larger data set from which the current
data were taken 5.
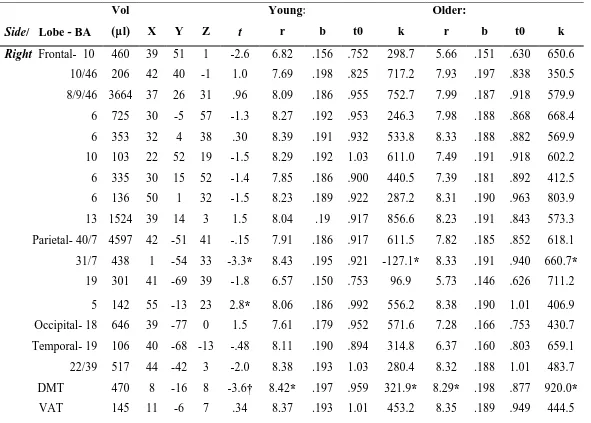
fMRI data. The activated clusters and their group differences are presented
in Table 1. There were no significant group differences in right prefrontal clusters,
but several left hemisphere clusters, particularly in the prefrontal cortex, were
with the larger dataset already published 5. Young adults demonstrated greater
activation than older adults only in two clusters: right postcentral gyrus and left
fusiform gyrus.
The hemodynamic response parameter averages for each cluster by group
are listed in Table 1. Significant between-groups differences in hemodynamic
response parameters were infrequent and limited to the domain of magnitude with
the exception of three clusters. The differences with respect to magnitude were
consistent with the %AUC analysis results. Figure 1 depicts modeled response
curves in the three largest clusters: right parietal, right middle frontal, and left
inferior frontal areas. Clusters in left and right thalamus and one in left premotor
area were different between groups in rise time, where older adults had faster (i.e.,
smaller) rise times than young adults.
INSERT TABLE 1 ABOUT HERE
INSERT FIGURE 1 ABOUT HERE
To examine the variability in the hemodynamic responses for lure trials
between subjects rather than simply between groups, we calculated average
waveforms for each subject with 95% confidence intervals calculated from the
group SD for each parameter under both extremes (i.e., all high/early or low/late
values). The result of this analysis using the ten largest clusters (using all clusters
produced nearly identical results) is shown in Figure 2, which shows that older and
younger participants had comparable averages and comparable variability of
responses. However, the high confidence interval shows the possibility of slightly
INSERT FIGURE 2 ABOUT HERE
Discussion
The purpose of this study was to examine the integrity of the hemodynamic
response in older adults as compared to young adults on an inhibition task.
Analysis of the hemodynamic response parameters revealed no significant
between-groups differences in onset, rise or fall parameters for any of the activated
regions, except in two thalamic clusters and one premotor cluster for rise, which
had a smaller (i.e., earlier) rise for older subjects. In addition, the cluster-averaged
waveform (Figure 2) suggested that older and younger averages and variability
were comparable, with the exception of slightly earlier and more robust k
parameter at the high end for older participants. This latter finding could be due to
somewhat more extreme responses at the high end by older subjects. In contrast
it could simply be due to the larger number and size of the clusters with greater
magnitude of response produced by older participants. Overall the averages and
variability were quite comparable and well within expected ranges for normal
hemodynamic responses. These findings support the hypothesis and are generally
consistent with the findings of Buckner et al. 15 and D’Esposito et al. 10, suggesting
that the group differences in activation were not due to age-induced hemodynamic
factors. The present findings, in fact, call into question whether such changes
occur in healthy aging. Indeed, the current results suggest that the hemodynamic
differences previously reported 7-9 might have been exacerbated by group
differences in sensory-motor acuity. Furthermore, the results clearly indicate that
the parameters of the general hemodynamic model used to analyze these data
optimization procedure used arrives at the best-fitting function for each voxel time
series, while also allowing significant variability within the data and maintaining a
hemodynamic waveform, which appears optimal for comparing groups expected to
differ on behavioral or functional dimensions, such as old and young. Finally,
because young adults exhibited some degree of activation in many of the same left
prefrontal regions that were significantly more activated by older adults (Figure 1),
the results suggest that left prefrontal regions may be available to participate in
inhibition, when or if needed, with those on the right 23.
Conclusion
In sum, elders, as compared with young adults, had comparable
hemodynamic response properties, increased magnitude of activation, and a more
bilateral activation pattern for an inhibition task. The results suggested that
age-related difficulty with inhibition is not associated with changes in response functions
or hemodynamic coupling. Furthermore, evaluations of healthy older and young
subjects in interaction with various cognitive task conditions would not be generally
Acknowledgements
References
1. Cabeza R. Hemispheric asymmetry reduction in older adults: the HAROLD model. Psychol. Aging 17 (2002).
2. Cabeza R, Anderson ND, Houle S, Mangels JA and Nyberg L. Age-related differences in neural activity during item and temporal-order memory
retrieval: a positron emission tomography study. J. Cog. Neurosci. 12, 197-206 (2000).
3. Grady CL, Maisog JM, Horwitz B, Ungerleider LG, Mentis MJ, Salerno JA, Pietrini P, Wagner E and Haxby JV. Age-related changes in cortical blood flow activation during visual processing of faces and location. J. Neurosci.
14, 1450-1462 (1994).
4. Madden DJ and Hoffman JM. In: Krishman KRR and Doraiswamy PM, eds.
Brain imaging in clinical psychiatry. New York, NY: M. Dekker, 1997.
5. Nielson KA, Langenecker SA and Garavan H. Differences in the functional neuroanatomy of inhibitory control across the adult lifespan. Psychol. Aging
17, 56-71 (2002).
6. Ogawa S, Lee T, Kay A and Tank D. Magnetic resonance imaging with contrasts dependent on blood oxygenation. Proc. Natl. Acad. Sci. USA 87, 9868-9872 (1992).
7. Huettel S, Singerman J and McCarthy G. The effects of aging upon the hemodynamic response measured by functional MRI. Neuroimage 13, 161-175 (2001).
8. Ross MH, Yurgelun-Todd DA, Renshaw PF, Maas LC, Mendelson JH, Mello NK, Cohen BM and Levin JM. Age-related reduction in functional MRI
response to photic stimulation. Neurology 48, 173-176 (1997).
9. Taoka T, Iwasaki S, Uchida H, Fukusumi A, Nakagawa H, Kichikawa K, Takayama K, Yoshioka T, Takewa M and Ohishi H. Age correlation of the time lag in signal change on EPI-fMRI. J. Comput. Assist. Tomogr. 22, 514-517 (1998).
10. D'Esposito M, Zarahn E, Aguirre GK and Rypma B. The effect of normal aging on the coupling of neural activity to the BOLD hemodynamic response. Neuroimage 10, 6-14 (1999).
Aging from 70 to 100. New York, NY, USA: Cambridge University Press, 1999:360-383.
12. Buckner R, Snyder AZ, Sanders A, Raichle M and Morris J. Functional brain imaging of young, nondemented and demented older adults. Journal of Cognitive Neuroscience 12, 24-34 (2000).
13. Hesselman V, Zaro Weber O, Wedekind C, Krings T, Schulte O, Kugel H, Krug B, Klug N and Lackner K. Age-related signal decrease in functional magnetic resonance imaging during motor stimulation in humans.
Neuroscience Letters 308, 141-144 (2001).
14. Heuttel S, Singerman J and McCarthy G. The effects of aging upon the hemodynamic response measured by functional MRI. NeuroImage 13, 161-175 (2001).
15. Buckner R, Logan J, Donaldson D and Wheeler M. Functional brain imaging of young, nondemented, and demented older adults. J. Cog. Neurosci. 12, 24-34 (2000).
16. Folstein MF, Folstein SE and McHugh PR. "Mini-mental state". A practical method for grading the cognitive state of patients for the clinician. J. Psychiatr. Res. 12, 189-198 (1975).
17. Sheikh JI and Yesavage JA. Geriatric Depression Scale (GDS): Recent evidence and development of a shorter version. Clin. Gerontologist 15, 165-173 (1986).
18. Garavan H, Ross TJ and Stein EA. Right hemispheric dominance of inhibitory control: an event-related fMRI study. Proc. Natl. Acad. Sci. USA
96, 8301-8306 (1999).
19. Wong E, Buskamp E and Hyde J. A volume optimized quadrature elliptical endcap birdcage brain coil. 11th Annual Scientific Meeting, Society for Magnetic Resonance Medicine. Berlin, Germany, 1992.
20. Talairach J and Tournoux P. Co-planar stereotaxic atlas of the human brain
Thieme: New York, 1988.
21. Cox R. AFNI: software for analysis and visualization of functional magnetic resonance neuroimages. Comput. Biomed. Res. 29, 162-173 (1996).
22. Cohen M. Parametric analysis of fMRI signal using linear systems methods.
Table 1. Clusters of statistically significant (p < .001) contiguous activation associated with response inhibition in either the
young or older group shown with group differences and average hemodynamic response parameters.
Side/ Lobe - BA
Vol
(µµl) X Y Z t
Young:
r b t0 k
Older:
r b t0 k
Right Frontal- 10 460 39 51 1 -2.6 6.82 .156 .752 298.7 5.66 .151 .630 650.6
10/46 206 42 40 -1 1.0 7.69 .198 .825 717.2 7.93 .197 .838 350.5
8/9/46 3664 37 26 31 .96 8.09 .186 .955 752.7 7.99 .187 .918 579.9
6 725 30 -5 57 -1.3 8.27 .192 .953 246.3 7.98 .188 .868 668.4
6 353 32 4 38 .30 8.39 .191 .932 533.8 8.33 .188 .882 569.9
10 103 22 52 19 -1.5 8.29 .192 1.03 611.0 7.49 .191 .918 602.2
6 335 30 15 52 -1.4 7.85 .186 .900 440.5 7.39 .181 .892 412.5
6 136 50 1 32 -1.5 8.23 .189 .922 287.2 8.31 .190 .963 803.9
13 1524 39 14 3 1.5 8.04 .19 .917 856.6 8.23 .191 .843 573.3
Parietal- 40/7 4597 42 -51 41 -.15 7.91 .186 .917 611.5 7.82 .185 .852 618.1
31/7 438 1 -54 33 -3.3* 8.43 .195 .921 -127.1* 8.33 .191 .940 660.7*
19 301 41 -69 39 -1.8 6.57 .150 .753 96.9 5.73 .146 .626 711.2
5 142 55 -13 23 2.8* 8.06 .186 .992 556.2 8.38 .190 1.01 406.9
Occipital- 18 646 39 -77 0 1.5 7.61 .179 .952 571.6 7.28 .166 .753 430.7
Temporal- 19 106 40 -68 -13 -.48 8.11 .190 .894 314.8 6.37 .160 .803 659.1
22/39 517 44 -42 3 -2.0 8.38 .193 1.03 280.4 8.32 .188 1.01 483.7
DMT 470 8 -16 8 -3.6† 8.42* .197 .959 321.9* 8.29* .198 .877 920.0*
Left/
Frontal-44/6/4/6/9
5073 -43 9 31 -6.1† 8.18 .191 .923 233.6 7.92 .186 .837 635.0
6 206 -4 -6 49 -1.9 8.40 .178 1.01 42.7 8.36 .186 .889 449.7
6 359 -33 -1 55 -1.4 8.23 .191 1.05 403.9 7.45 .187 .881 543.4
6/4 1135 -16 -2 58 -2.1 8.38 .195 1.01 189.1 8.29 .192 .93 484.1
6 136 -28 -15 59 -2.1 8.37 .196 .978 48.6 8.29 .192 1.03 305.0
6 325 -7 16 62 -5.3† 8.04* .191 .960 -314.2* 5.95* .164 .738 470.4*
6 112 -5 28 55 -2.5 8.29 .196 1.01 257.8 6.33 .171 .717 474.5
4 157 -17 -26 58 -3.1* 8.38 .193 .986 -251.3† 8.32 .189 .910 519.1†
13 241 -32 12 8 -2.4 8.37 .194 .984 224.3 8.32 .188 .875 749.0
Limbic- 32 1458 -1 17 42 -.05 8.37 .195 .973 672.0 8.34 .195 .857 585.8
Parietal- 19 261 -25 -67 35 1.2 8.39 .197 .990 207.4 8.32 .196 .988 548.3
40 3189 -42 -53 37 -2.3 8.24 .190 .917 307.3 8.01 .188 .918 627.8
Occipital- 18 108 -40 -82 -10 2.4 8.16 .194 1.01 365.0 6.21 .138 .704 447.1
Temporal- 19 320 -43 -62 -13 2.9* 8.37 .199 1.04 573.5 7.01 .151 .715 369.8
21 303 -54 -28 -7 -2.3 8.06 .187 .903 258.3 7.98 .151 .860 899.9
VAT/DMT 453 -12 -10 11 -2.9* 8.40* .201 .977 65.0* 8.29* .171 .866 772.2*
*p < .01; † p< .001. BA = Brodmann area; DMT = dorsomedial thalamus; VAT = ventral anterior thalamus; r = rise time; b =
fall time; t0 = onset time; k = magnitude. Coordinates are in mm from the anterior commissure 20 with positive is right (X),
Figure Legends
Figure 1. Models of hemodynamic response during successful inhibitions (lures; “No-go”)
for both young and older adults in the three largest activation clusters: right inferior parietal
lobule (a), right middle frontal gyrus (b) and left inferior/middle frontal gyrus (c). The plotted
symbols are for visual distinction only and do not represent actual datapoints. The groups
did not significantly differ on any parameter in these clusters except in magnitude for c (old
> young, p≤ .01). Overall the response parameters were predominantly comparable (see
Table 1).
Figure 2. Models of hemodynamic response during successful inhibitions averaged across
the ten largest clusters, separately for older and younger participants, including confidence
intervals and high and low parameters. The plotted symbols are for visual distinction only
0 2 4 6 8 10 12
Signal Intensity (arbitrary units)
0 200 400 600 800 1000 1200 1400 Young Old
0 2 4 6 8 10 12
Signal Intensity (arbitrary units) 0
200 400 600 800 1000 1200 1400 1600 1800 2000 Young Old
Time post-stimulus (seconds)
0 2 4 6 8 10 12
Signal Intensity (arbitrary units)
-1000 -500 0 500 1000 1500 2000 2500 3000 3500 4000 4500 5000 5500 6000
0 0.5 1 1.5 2 2.5 3 3.5 4 4.5 5 5.5 6 6.5 7 7.5 8 8.5 9 9.5 10
Time post-stimulus (sec)
Signal Intensity (arbitrary units)