Phase Transitions and Stability
Thesis by Lisa Cowan
In Partial Fulfillment of the Requirements for the Degree of
Doctor of Philosophy
California Institute of Technology Pasadena, California
2007
Acknowledgements
I have a large debt of gratitude owed to many people and I would like to let this section serve as an account of this indebtedness. I hope to return these favors and to emulate the nurturing spirit that surrounded me while at Caltech.
I would like to thank my advisor, Dr. Sossina Haile, for all of her guidance and support that allowed me to complete work I could be proud of with the freedom to find my own path. I will miss looking over puzzling data with her as she always had suggestions that would lead us to a cohesive explanation.
I have been very fortunate to have many great collaborators. I would like to sincerely thank Dr. Thomas Proffen for his help at Los Alamos, for answering countless emails
regarding data analysis and for being a friend. Dr. Sonjong Hwang’s friendship and expertise saved me during my last-minute panicked NMR requests which would have ended up in disaster otherwise. Dr. William A Goddard III, Dr. Adri van Duin, Dr. Yun Hee Jang, and Dr. Boris Merinov guided me through QC simulation details and without their help I would never have been able to even dream of doing such work. Dr. Oc Hee Han and Dr. Kee Sung Han of KBSI welcomed me into their lab for a summer and helped me extend my
understanding of NMR (funded by NSF EAPSI). I am indebted to Dr. Clare Grey, Dr. Luming Peng and Lesley Holmes at Stony Brook as well as Dr. Steve Greenbaum and Dr. Jay Jayakody at Hunter College for their help on NMR measurements. Dr. Alex Navrotsky and Riham Morcos were invaluable towards acquiring enthalpy data on Rb3H(SO4)2 samples
and I am honored by their collaboration.
of equipment for the preparation of my deuterated samples and I greatly appreciate the unlimited access I had to the machine and her students’ patience and respect for my work (Dr. Tao Cheng, Rich Wildman, Dr. Tom He, and Arthur Fitzmaurice). I am very
appreciative of access to Dr. Jane Raymond’s melting point apparatus throughout my Ph.D. I greatly appreciate Richard Gerhart (aka: The Glass Man) and Mike Vondrus (aka: Machinist Extraordinaire) for filling my rushed, frantic orders and providing parts to build my own experimental setup. I am also very grateful for all of the help and friendship from the administrative staff: Fran Matzen, Linda Scott, Irene Loera and Pam Albertson in the materials science department, as well as Tess Legaspi and Gloria Brewster in the registrar’s office, Cheryl Hawthorne and Angela Wood in the career development center, and Divina Bautista, Alice Sogomonian, Jeannie Holloway, and Phyllis Belisle in the health center. I would also like to thank Dr. George Rossman, Dr. William Goddard, Dr. Brent Fultz and Dr. Rob Phillips for reading my thesis.
Dr. Hany Farid was my mentor in the NASA/Sharp+ summer program at the
University of Pennsylvania during the summers of ’95 and ’96. Because his mentorship has shaped my life and helped me appreciate research, I must acknowledge him in my Ph.D. thesis. I am very grateful to have worked with him and the impact of his guidance cannot be overestimated. Thank you, Hany.
Abstract
Solid acid proton conductors are viable alternatives to current fuel cell electrolytes. Incorporating solid acid electrolytes, next generation fuel cells would not require
humidification of the electrolyte, as in proton exchange membrane fuel cells, and could operate at higher temperatures which would improve catalysis rates. Engineering the
properties of these materials for fuel cell electrolyte applications requires an understanding of the structural and chemical parameters that support superprotonic phase transitions over melting or decomposition.
In this thesis, the structures of three superprotonic solid acids are presented, and for the first time, a distinction is possible between local versus average structure. An adapted model for configurational entropy based on Pauling’s entropy rules for ice is incorporated to describe the entropy of superprotonic solid acids. Insights from local structural information alleviate discrepancies between this model and experimentally determined entropy values. With clarifications from this work, the calculated configurational entropy of the
superprotonic structures of CsD2PO4,RbDSeO4, and CsDSO4, agree well with experimentally
determined entropy values.
A study of chemical intermediates, CsxRb1-xH2PO4, provides valuable insight into the
nature of the cation size effect on superprotonic phase transitions within an isostructural system. For compounds in the series that do exhibit a superprotonic phase, CsH2PO4 –
Cs0.3Rb0.7H2PO4, the magnitude of proton conductivity remains neutral to rubidium
analysis, Raman, IR, 133Cs, 87Rb and 1H-NMR spectroscopy all attest to the gradual variation in structural properties across the composition range.
The complicated high-temperature properties of Rb3H(SO4)2 have been
misinterpreted in earlier literature as a superprotonic phase transition. This work presents a careful analysis of a conglomeration of data from different techniques which definitively conclude that at ambient pressure, Rb3H(SO4)2 degrades via phase separation, Rb3H(SO4)2→
Table of Contents
Acknowledgements iii
Abstract vi
1 Introduction 1-1
1.1 Overview of Solid Acids and Superprotonic Phase Transitions 1-1
1.2 Background 1-3
1.3 Summary of Conclusions 1-6
1.4 References 1-8
2 Experimental Techniques 2-1
2.1 Synthesis 2-1
2.2 X-Ray Powder Diffraction 2-2
2.3 Neutron Powder Diffraction 2-2
2.4 NMR Spectroscopy 2-2
2.5 Impedance Spectroscopy 2-3
2.6 Thermal Analysis 2-3
2.6.1 Simultaneous Differential Scanning Calorimetry and
Thermogravimetric Analysis 2-3
2.6.2 Drop Solution Calorimetry 2-4 2.6.3 Thermomechanical Analysis 2-4
2.7 Raman Spectroscopy 2-4
2.8 Infrared Spectroscopy 2-5
2.9 Melting Point Apparatus 2-5
2.10 References 2-5
3 CsHSO4 3-1
3.1 Introduction 3-1
3.2 Synthesis and Characterization Methods 3-5 3.3 Low- and High-Temperature Structure & Refinement Results 3-7
3.3.1 Refinement at 333 – 313 K 3-7
3.3.2 Refinement at 428 K 3-10
3.4 Pair Distribution Function Analysis 3-17
3.5 Entropy Evaluations 3-19
3.6 Conclusions 3-21
3.7 References 3-22
4 RbHSeO4 4-1
4.1 Introduction 4-1
4.3 Low- and High-Temperature Structure and Refinement Results 4-4 4.3.1 Refinement at 333 – 316 K 4-4
4.3.2 Refinement at 440 K 4-6
4.4 Pair Distribution Function Analysis 4-11
4.5 Entropy Evaluations 4-12
4.6 Conductivity 4-17
4.7 Conclusions 4-18
4.8 References 4-19
5 CsH2PO4 5-1
5.1 Introduction 5-1
5.2 Synthesis and Characterization Methods 5-1 5.3 Low- and High-Temperature Structure & Refinement Results 5-3
5.3.1 Refinements at 301 – 305 K & 325 – 335 K 5-3
5.3.2 Refinement at 523 K 5-6
5.4 Pair Distribution Function Analysis 5-7
5.5 Entropy Evaluations 5-9
5.6 Pretransition Effects: Three-Site Chemical Exchange
via 2H-NMR 5-14
5.7 Conclusions 5-22
5.8 References 5-23
6 Cation Size Effect in the CsxRb1-xH2PO4 Solid Solution Series 6-1
6.1 Introduction 6-1
6.2 Synthesis Procedure and Characterization Methods 6-2
6.3 Phase Analysis 6-2
6.4 Thermal Analysis 6-8
6.5 Conductivity 6-11
6.6 Conclusions 6-13
6.7 References 6-13
7 High-Temperature Properties of Rb3H(SO4)2 and Implications for
M3H(XO4)2Phase Transitions 7-1
7.1 Introduction 7-1
7.2 Synthesis Procedure and Characterization Methods 7-2 7.3 High-Temperature X-Ray Diffraction 7-4
7.3.1 Powder Sample 7-4
7.3.2 Pellet and Single Crystal Samples 7-5
7.4 Thermal Analysis 7-8
7.4.1 Powder Sample 7-8
7.4.2 Pellet Sample 7-9
7.5 Phase Transition Temperatures: Extrapolation Down to Zero
7.6 Drop Solution Calorimetry and Enthalpy of Formation 7-12
7.7 Conductivity Studies 7-17
7.8 Thermo-Mechanical Measurements 7-18
7.9 M3H(XO4)2Phase Transitions 7-19
7.10 Conclusions 7-20
7.11 References 7-20
8 Conclusions 8-1
Appendix
A.1 Solid Acid Synthesis A-1
A.1.1 CsH2PO4 A-1
A.1.2 CsHPO3H A-1
A.1.3 CsHSO4 A-1
A.1.4 CsxRb1-xH2PO4 A-2
A.1.5 KHSeO4 A-2
A.1.6 RbHSeO4 A-2
A.1.7 RbHSO4 A-3
A.1.8 Rb3H(SO4)2 A-3
A.1.9 Rb3H(SeO4)2 A-3
A.1.10 RbH2AsO4 A-4
A.1.11 TlHSO4 A-4
A.1.12 Deuteration of Solid Acid Samples A-4 A.2 Melting Point Determinations via Capillary Melting Point
Apparatus A-5
A.3 Three-Site Chemical Exchange Mathematica Program A-5 A.4 Refinement for Rb3H(SO4)2 and Rb2SO4 into the Rb2SO4
Structure A-8
A.5 KHSeO4 and RbHSeO4 Quantum Chemical and ReaxFFKSeRb
Development A-12
A.5.1 Introduction A-12
A.5.2 Methods A-13
A.5.3 Results and Discussion
A.5.3.1 Bond Dissociations A-13
A.5.3.2 Selenic acid bond dissociations A-15 A.5.3.3 Angle Bend Energies A-16
A.5.3.4 Proton Migration A-18
A.5.3.5 Crystal Data – Metals, Metal Oxides A-18
A.5.4 Conclusions A-20
List of Figures
1-1 The most ambitious application of solid acids is as an electrolyte in a fuel cell that would replace combustion engines in cars. Solid acid electrolytes have advantages over current fuel cell technology (PEM) in that they can operate at higher
temperatures and are gas impermeable. 1-3
1-2 Cartoon diagram of tetrahedral orientations and hydrogen bonding in CsHSO4 – Jirak example with two tetrahedral orientations and four hydrogen bonding directions
1-4
3-1. CsDSO4 monoclinic refined structure at 333 – 313K. Hydrogen bonds form zigzag
chains along the c-axis of the unit cell. 3-2
3-2. Jirak (top left), Belushkin (top center), and Merinov (top right) sulfate tetrahedral orientations. The Jirak diagram is a fragment of a unit cell with the Cs atoms and deuterium atoms that are not hydrogen bonded deleted for clarity. The diagram shows the two tetrahedral orientations possible in the Jirak structure. Merinov and Belushkin structures each have four tetrahedral orientations, oxygen atoms
participating in a tetrahedron are marked by “o.” The Merinov structure has oxygen positions in the 16h site with 0.5 occupancy and the other oxygen site, 32i, has 0.25 occupancy (illustrated in the diagram). (bottom) Sulfate tetrahedral arrangements
3-3. Verification of deuteration level on CsDSO4 prior to neutron diffraction experiments.
The small 1H signal at 11 ppm indicates presence of hydrogen in the structure and incomplete deuteration. Prior to neutron diffraction analysis, this sample was
redeuterated.Verification of deuteration level on CsDSO4. 3-6
3-4. Neutron diffraction refinement results for CsDSO4, T = 333 – 313K (60 – 40°C),
bank 1 3-8
3-5. (left) Pair distribution function plot of CsDSO4, T = 333 – 313K (60 – 40°C)
illustrates long- range order. Structural features identified include the bond distances associated with the sulfate tetrahedra as well as features at a distance of 18 Å. (right) Atom pair distances inferred from the PDF plot are compared to analogous distances calculated from the crystal structure. Average versus local atom distances agree to the picometer in length for small atom pair distances. 3-9
3-6. Neutron diffraction refinements of CsDSO4, T = 428K (155°C), bank 1 into
Belushkin (left), Jirak (center), and Merinov (right) structures. Experimental results are indicated in black, refined pattern in red, background in green, and difference curve in blue. Comparing the three structures via the difference curve is
3-7. CsDSO4 structures: Jirak (top left), Belushkin (top right), Merinov (bottom left, large
tetrahedra, bottom right, smaller tetrahedra). Tetrahedra in the Merinov structure represent 12 oxygen sites which comprise 4 tetrahedral orientations. The sites included in the smaller tetrahedra on the right have occupancy of ½ while the sites indicated in the larger tetrahedra on the left have ¼ occupancy. The actual tetrahedral configurations sample two of the ½ occupancy sites for two sets of ¼ occupancy
oxygen sites. 3-15
3-8. PDF plot of CsDSO4 in the superprotonic phase, T = 428K (155°C). Peak positions
from the PDF are compared to crystallographic atom distances in each of the three proposed structures. As the PDF captures the local, and Bragg diffraction conveys the average structural information, D-O bond distances are lengthened in the average picture as the deuterium is in motion. 3-18
3-9. CsHSO4 differential scanning calorimetry curve collected at a scan rate of ¼ K/min
under flowing N2. 3-19
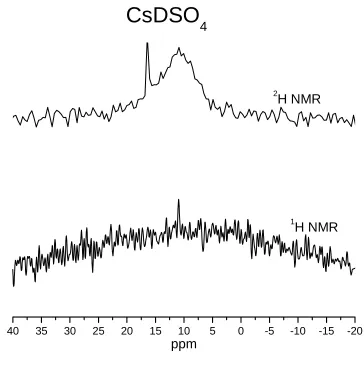
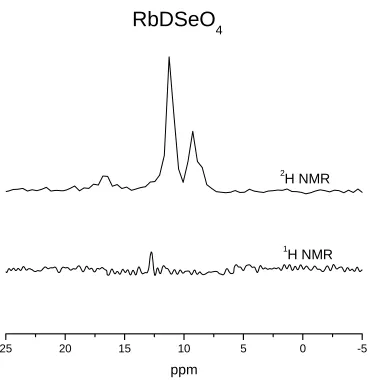
4-1. Deuteration level verification on RbDSeO4 prior to neutron diffraction experiments.
Peak at 13 ppm in the IH spectrum indicates structural hydrogen in the sample and so the sample was redissolved in D2O and recrystallized before neutron diffraction
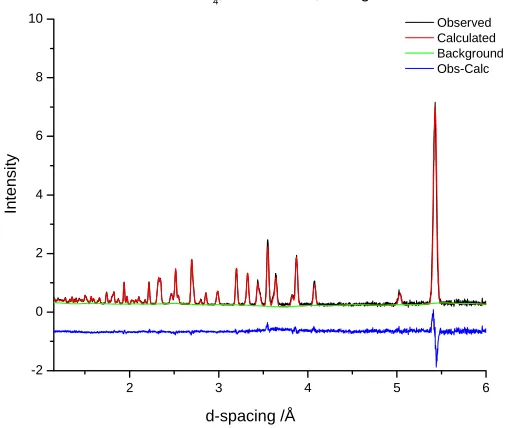
4-2. (left) Neutron diffraction data refinement, RbDSeO4, T = 333 – 316K (60 – 43°C),
bank 1. (right) Crystal structure viewed along the 001 direction. Selenate groups are linked via fully ordered asymmetric, single minimum hydrogen bonds. 4-6
4-3. Neutron diffraction data refinements of RbDSeO4, T = 440K (167°C), bank 1 and 2
in the Merinov structure. 4-10
4-4. Belushkin (left), Merinov (center), and Jirak (right) structures of RbDSeO4
4-11
4-5. Pair Distribution Function for RbDSeO4 at (left) T = 333 – 316K and (right) T =
440K. The high-temperature structure loses long-range correlations. 4-11
4-6. CsHSO4 differential scanning calorimetry data used as a standard for interpreting
peak area values in fitting the complicated set of transitions in RbDSeO4 4-14
4-7. RbDSeO4 differential scanning calorimetery data fitted to four peaks. The first two
peaks are considered to be due to the transition from the B2 to I41/amd structure.
4-15
4-8. RbDSeO4 closed volume versus ambient pressure (RbHSeO4) differential scanning
RbHSeO4 was unable to separate these transitions and assigned all of the transition
entropy to a single transition as in the ambient pressure, 1K/min DSC scan of
RbHSeO4(right). 4-15
4-9. (left) RbHSeO4 X-Ray Diffraction Data. The B1 phase is present from T = 25°C to
155°C where the I41/amd phase emerges. At T = 176°C, RbHSeO4 transitions again
to possibly a lower symmetry or possibly phase separation. Calculated patterns of RbHSeO4 B1 and B2 space group are included to illustrate the B1 → B2 transition
does not appear on heating. The transition sequence, B1 → I41/amd is indicated.
(right) RbDSeO4 X-Ray Diffraction Data on Pressed Pellet Kapton Sealed Sample.
Calculated patterns of RbDSeO4 B1 and B2 space group (shifted to account for
sample height error on pellet sample) are included to illustrate the I41/amd → B2 →
B1 transition sequence is detectable on cooling (cooling cycle in blue). First heating cycle (red) shows no evidence of B2 phase. Evidence of the B2 phase is also present
in ACIS data. 4-16
4-10. Neutron and X-ray data for RbDSeO4 (neutron) and RbHSeO4 (X-ray). Neutron
diffraction pattern includes 011 and 013 peaks not present with X-ray diffraction due to the similarity in scattering power of Rb and Se. X-ray diffraction pattern at 176°C shows an additional peaks at 3.23 and 3.27 Å d-spacing indicting the I41/amd phase
exists between two phase transitions from B1 (or B2)→ I41/amd and I41/amd
4-11. Isotope effect and transition entropies compared in RbDSeO4 versus RbHSeO4.
4-17
4-12. Conductivity plot of RbDSeO4 with D2O humidification in flowing nitrogen
4-18
5-1. Deuteration level check on CsD2PO4 neutron sample shows no detectible 1H NMR
signal. 5-3
5-2. CsH2PO4 room temperature structure in P21/m space group along the [100] direction
5-4
5-3. Rietveld refinement of powder neutron diffraction data from bank 1 recorded at (a) 301 – 305K and (b) 523K for CsD2PO4. Observed (black), calculated (red),
background (green), and difference (blue) 5-6
5-4. CsD2PO4 superprotonic structure. 5-7
5-5. CsD2PO4 PDF at 30°C in the P21/m structure 5-8
5-7. Pair distribution function of CDP. O-O distances for possible hydrogen bonds are indicated in red. Labeled distances correlate to the refined crystal structure with minor deviations expected from the phosphate tetrahedrons occupying one of the six possible configurations and the deuterium atoms being associated with one oxygen.
5-10
5-8. Six tetrahedral orientations of CsD2PO4 within the constructs of the Bragg diffraction
average structure. 5-11
5-9. Adjacent unit cell face hydrogen bonding not captured in average structure but not prohibited in local structure. 5-12
5-10. CsD2PO4closed-volume DSC 5-14
5-11. ACIS graph of CsH2PO4 exhibiting a superprotonic phase transition*. 5-15
5-12. CsD2PO42H NMR spectra at 25°C, 150°C, and 185°C. The three 2H sites present at
room temperature coalesce at 150°C. The powder pattern collapses as the 2H atoms
become more mobile. 5-18
5-13. CsH2PO41H NMR MAS spectrum at room temperature. Unlike 2H NMR spectra, 1
5-14. CsD2PO42H NMR MAS spectra at 25°C, 150°C and 185°C fit using a three-site
chemical exchange model developed from Abragam’s discussion. Jump frequencies determined from this analysis suggest deuterium exchange is an order of magnitude higher at 150°C than at 25°C. The model breaks down at 185°C, where the sharp peak is impossible to replicate assuming three-site exchange. Changes in the crystal structure or dynamics prior to the superprotonic phase change have altered the three deuterium sites to become more similar. 5-19
5-15. CsD2PO431P NMR MAS spectra at 25°C, 150°C, and 185°C. The CSA remains
unchanged in this temperature regime. 5-22
5-16. CsD2PO431P NMR static spectra at 185°C and 27°C after cooling. The chemical shift
anisotropy remains unchanged in this temperature regime 5-22
6-1. (top left) X-Ray diffraction patterns of the CsxRb1-xH2PO4 system. (top right) Unit
cell volume per formula unit of the CsxRb1-xH2PO4 system. (bottom) Cell parameters
of compounds in the CsxRb1-xH2PO4 system. All compositions adopt the CsH2PO4
structure except for Cs0.1Rb0.9H2PO4 and RbH2PO4. 6-3
6-2. (top left) 1H NMR MAS spectra of CsxRb1-xH2PO4 system using TMS as a standard.
resonance ~14.4 ppm is due to the hydrogen involved in the ordered hydrogen bonds that zigzag along the b-axis. Hydrogen resonance between 11-12 ppm is more sensitive to cation size and represents the disordered hydrogen bond position running parallel to the c-axis. (bottom left) CsH2PO4 room temperature structure viewed
along the [100] direction. (bottom right) O – O bond length versus composition in the CsxRb1-xH2PO4 system. 6-4
6-3. (top left) 87Rb NMR MAS spectra of CsxRb1-xH2PO4 system using aqueous RbNO3 as
a standard. Peaks shift monotonically downfield (higher ppm) with increasing Rb content. RbH2PO4 spectrum suffers from quadrupolar interactions of a single Rb
resonance. (top right) 133Cs NMR MAS spectra of CsxRb1-xH2PO4 system using 0.5M
CsCl aqueous solution as a standard. Anisotropic broadening is visible with increasing amounts of Rb in the structure suggesting reduced Cs mobility with Rb incorporation. (bottom left) MAS NMR studies reveal a linear dependence of 133Cs δ
FWHM on Rb content in the Cs-containing composition range. FWHM is a measure of
the anisotropic broadening resulting from reduced Cs mobility. (bottom right) 87Rb and 133Cs NMR MAS chemical shifts vs. mole fraction of Rb fitted with linear trends.
6-7
6-4. (left) Attenuated Total Reflectance FT Infrared data for the CsxRb1-xH2PO4 system
(right) Raman shift data for the CsxRb1-xH2PO4 system. The PO4 symmetric stretch at
900 cm-1 is constant throughout composition range. 6-8
6-5. (top) Differential Scanning Calorimetry (DSC) for the CsxRb1-xH2PO4 system
obtained from samples placed in closed volume containers to minimize thermal dehydration. Endothermic peaks at lower temperatures and lower Rb content correspond to the superprotonic transition. Peaks at higher temperatures indicate melting. With increasing Rb content, the temperature gap between melting and the superprotonic transition decreases. The superprotonic phase transition and melting transition are combined at this heating rate for the RDP end member. (bottom left) Superprotonic transition and melt temperature as a function of Rb content. DSC and ACIS findings concur for x > 0.5, CsxRb1-xH2PO4, the superprotonic transition
temperature remains constant. For x < 0.5, superprotonic transition temperature increases monotonically. (bottom right) Entropies and enthalpies of superprotonic and melting transitions. The entropy of the superprotonic phase transition is constant in the system except for Cs0.2Rb0.8H2PO4 and Cs0.1Rb0.9H2PO4. All other compositions
undergo a similar superprotonic phase transition. 6-10
6-6. Conductivity as a function of temperature plotted in Arrhenius form for selected compositions in the CsxRb1-xH2PO4 system. Each heating cycle is marked with an
asterisk indicating the onset of the superprotonic transition. The superprotonic transition temperature increases with Rb content for chemical intermediates, CsxRb
7-1. X-ray powder diffraction patterns of Rb3H(SO4)2 on loose powder sample. The
sample was heated to 225°C at a rate of 5K/min and scanned immediately. Scan time at 225°C is six minutes. For temperatures above 205°C, powder diffraction patterns from samples of Rb3H(SO4)2 resemble that of Rb2SO4. 7-5
7-2. X-ray powder diffraction patterns of Rb3H(SO4)2 on pressed pellet sample. Phase
separation indicated at 205°C shows both Rb3H(SO4)2 and Rb2SO4 peaks. Sample
was allowed to equilibrate at 205°C for approximately 4 hours. 7-6
7-3. X-ray powder diffraction pattern of a single crystal of Rb3H(SO4)2 and a pressed
powder sample of Rb2SO4 show identical structure at 230°C indicating phase
separation in the single crystal retains Rb2SO4 orientation. Phase separation of
Rb3H(SO4)2 single crystals does not destroy the morphology of the crystal. Crystal
faces appear frosted after phase separation but overall the crystal resembles its original shape and transparency. 7-7
7-4. X-ray powder diffraction patterns of pressed powder samples of Rb2SO4 plus
RbHSO4 in various stoichiometric ratios. A clean pattern emerges for the 3 RbHSO4
+ Rb2SO4 pellet, and to a lesser extent in the 2 RbHSO4 + Rb2SO4 pellet, which
misleadingly suggests a high symmetry phase. This pattern is identical to the patterns (Figure 7-3) from single crystal Rb3H(SO4)2 and a pellet of Rb2SO4, indicating
7-5. Differential scanning calorimetry (DSC) data of Rb3H(SO4)2 7-8
7-6. Differential scanning calorimetry (DSC) cycles on loose powder samples of
Rb3H(SO4)2 7-9
7-7. Differential scanning calorimetry (DSC) cycles on pressed pellet samples of
Rb3H(SO4)2 7-10
7-8. Extrapolation down to zero heating rate for (left) Rb3H(SO4)2 and (right) RbHSO4
compounds 7-11
7-9. Possible phase diagram for Rb2SO4-H2SO4 7-12
7-10. ACIS conductivity plot of (left) Rb3H(SO4)2 pellet sample and (right) RbHSO4 plus
Rb2SO4pellet sample 7-18
7-11. Thermomechanical data for Rb3H(SO4)2 and RbHSO4 pressed pellet samples
7-19
A-1. Quantum Chemical and ReaxFF Rb-OH and K-OH Bond Dissociations
A-14
A-2. Quantum Chemical and ReaxFF H2SeO4, Se-OH and Se=O Bond Dissociations.
A-3. Quantum Chemical and ReaxFF H2SeO4, O=Se-OH, O=Se=O, and HO-Se-OH Bond
Angle Distortions. A-17
A-4. Quantum Chemical and ReaxFF Proton Migration Barrier. A-18
A-5. Quantum Chemical and ReaxFF Equation of state for Potassium. A-19
A-6. Quantum Chemical and ReaxFF Equation of state for Rubidium. A-19
A-7. Quantum Chemical and ReaxFF Equation of state for Rubidium Oxide. A-20
A-8. Quantum Chemical Equations of state for I4/mmm KO2, I/mmm Rb2O2, P42/mbc
List of Tables
3-1. Original structures proposed for CsHSO4 3-5 3-2. Crystal Data and Structure Refinement Parameters for CsDSO4 at
333-313K and 428K 3-7
3-3. Atomic Coordinates and Thermal Displacement Parameters of CsDSO4 at 333 –
313K. 3-8
3-4. Jirak, Belushkin and Merinov models contrasted in terms of tetrahedral orientations, oxygen and deuterium site occupancy and tetrahedral geometery. 3-16
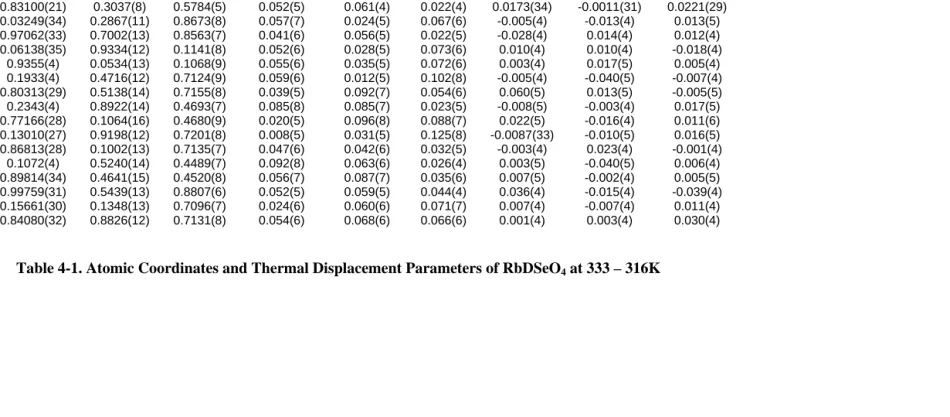
4-1. Atomic Coordinates and Thermal Displacement Parameters of RbDSeO4 at 333 –
316K 4-5
4-2. Crystal Data and Structure Refinement Parameters for RbDSeO4 at 333 – 316K and
440K 4-7
4-3. Atomic Coordinates and Thermal Displacement Parameters of RbDSeO4 at 440K in
the Jirak, Belushkin, and Merinov structures 4-10
5-1 Crystal Data and Structure Refinement Parameters for CsD2PO4 at 301 – 305K, 325 –
5-2. Atomic Coordinates and Thermal Displacement Parameters of CsD2PO4 at 301 –
305K, 325 – 335K, and 523K 5-5
5-3 CsD2PO42H NMR Peak Fitting Results for Spectra Collected at 25°C, 150°C, and
185°C. The three 2H sites were assigned based on three deuterium sites. While the room temperature spectra appears to have more than three sites, this model was chosen based on site assignment in the literature and a simplification to make this
model tractable 5-18
5-4 CsD2PO42H NMR three-site exchange model jump frequency results at 25°C, 150°C,
and 185°C. 5-20
6-1 Temperatures and enthalpies of superprotonic transitions in the CsxRb1-xH2PO4
system. 6-11
7-1. M3H(XO4)2 Phase Transitions and Temperatures 7-3
7-2. Thermochemical cycles used to calculate enthalpies of formation. 7-15 7-3. Enthalpies of drop solution (ΔHds) of Rb3H(SO4) 2, RbHSO4, rubidium sulfate, and
oxides 7-16
7-4. Enthalpies of formation of Rb3H(SO4) 2, RbHSO4, rubidium sulfate, and oxides
A-1. Refinement of Rb2SO4 Structure against Rb3H(SO4)2 X-Ray Diffraction Data at
205˚C A-8
A-2. Refinement of Rb2SO4 Structure against Rb2SO4 X-Ray Diffraction Data at 220˚C
Chapter 1
Introduction
The overarching theme of this work is to elucidate the structure of superprotonic
solid acids. Structural information delimits the number of configurations available to
oxyanion tetrahedra as well as the number of ways hydrogen bonds can form. The
overall number of configurations in superprotonic solid acids determines the
configurational entropy, and the sampling of these different configurations facilitates the
unusually high proton conductivity in these materials. Verifying current models for
determining configurational entropy is important to understanding superprotonic solid
acid phase transitions. Solid acid phase stability and noteworthy changes in physical
parameters prior to the phase transition are also considered.
This chapter will provide a brief explanation of solid acids and superprotonic
transitions as well as a method to evaluate configurational entropy, and a summary of
noteworthy conclusions from this work.
1.1 Overview of Solid Acids and Superprotonic Phase Transitions
Solid acids are chemical intermediates between normal salts and normal acids.
½ Cs2SO4 (salt) + ½ H2SO4 (acid) ö CsHSO4 (solid acid).
Solid acid properties are also intermediate between those of an acid and a salt in that they
are brittle and insulating but are known to have high ionic conductivity (~ 10-2 W-1 cm-1).
At room temperature, most solid acids are monoclinic in symmetry. At elevated
temperatures (~ 100 – 300°C), some solid acids undergo a first-order phase
hydrogen atom sites are disordered which allows tetrahedral oxyanion groups to reorient
(~1011 Hz). Tetrahedral motion facilitates inter-tetrahedral proton hopping (~109 Hz) [1]
which leads to high proton conductivity in the disordered high-temperature phase.
Across the phase transition from the low-symmetry monoclinic phase to the higher
symmetry, disordered phase, proton conductivity increases by several orders of
magnitude in superprotonic solid acids.
Fundamental physical and chemical characteristics of solid acids have attracted
attention due to interesting changes in the hydrogen bonding network in different phases
of these materials. Earlier solid acid studies focused on the ferroelectric to paraelectric
phase transition at temperatures below room temperature (e.g., KH2PO4, Cs3H(SeO4)2). In
1981, the first superprotonic phase transition was discovered in CsHSO4 [2, 3].
Over the past few years, much attention has been focused on the application of
these novel materials as electrolytes in next generation fuel cells with the ultimate goal of
replacing the combustion engines in automobiles (Figure 1-1). Solid acids have
advantages over the conventional proton exchange membrane (PEM) fuel cells. PEM
fuel cells require humidification which limits the operating temperature to under 100°C.
As solid acids can operate at higher temperatures, catalysis rates would be improved,
relative to PEM fuel cells, with the possibility of eliminating the necessity of precious
metals altogether. Solid acids are water soluble which is a disadvantage for use in fuel
Figure 1-1. The most ambitious application of solid acids is as an electrolyte in a fuel cell that would replace combustion engines in cars. Solid acid electrolytes have advantages over current fuel cell technology (PEM) in that they can operate at higher temperatures and are gas impermeable.
1.2 Background
Configurational Entropy
Configurational entropy of solid acid structures is derived from the number of
ways that hydrogen bonds and tetrahedral phosphate, sulfate or selenate groups can
orient. A model has been presented which draws on Pauling’s Ice Rules and adapts those
rules to count the number of configurations in the superprotonic phase [4, 5]. This
approach is necessary whenever the orientations of the oxyanion tetrahedral groups are
independent of the hydrogen bonds that the group forms.
Chapters 3, 4 and 5 address the configurational entropy of the superprotonic phase
of solid acids CsDSO4, RbDSeO4, and CsD2PO4, respectively. These three superprotonic
structures provide examples in which the selenate tetrahedral orientations are fixed by the
location of the hydrogen bonds (RbDSeO4), the sulfate orientations are independent of
hydrogen atom positions and hydrogen bonding follows a simple model (CsDSO4), and
straight-forward (CsD2PO4). The modified ice rules are necessary to evaluate the number of
configurations in the high-temperature phase of CsDSO4 and CsD2PO4 while RbDSeO4
does not necessitate this level of sophisticated counting.
To present the modified Ice Rules as they apply to counting the configurations of
solid acids in the disordered superprotonic phase, consider CsDSO4. CsDSO4, the
simplest case with independent hydrogen bonding and tetrahedral configurations, has
been described in three different structures. In Chapter 3, neutron diffraction data
identifies one structure, the Jirak model [6], as the best description of the sulfate
tetrahedra disorder. For this example, we will consider the number of configurations
implied by the Jirak model.
The modified ice rules, as they apply to CsHSO4 are as follows [4]:
(1) one proton is associated with each tetrahedron;
(2) one proton occupies each hydrogen bond that is formed;
(3) hydrogen bonds are directed towards oxygen atoms of neighboring tetrahedra; (4) interaction between non-neighboring HSO4 tetrahedra does not influence the
[image:30.612.240.372.471.661.2]distribution of hydrogen bond configurations.
The Jirak structure describes each sulfate group with four neighboring sulfate
groups providing four directions along which hydrogen bonds can be formed. Each
sulfate group can reside in one of two orientations, independent of any distribution of
hydrogen bonds. Projected onto two dimensions, the structure schematically appears as
in Figure 1-2. The number of configurations available to CsHSO4 is the product of the
number of hydrogen bond configurations multiplied by the number of sulfate group
orientations.
When a hydrogen atom participates in a hydrogen bond in this structure, it has 4
options to choose from with a ¾ probability that the bonding direction (option) is
available. The contribution to configurational entropy from hydrogen bonding,
3 4 3 1 4 = ⎟ ⎠ ⎞ ⎜ ⎝ ⎛ ⎟⎟ ⎠ ⎞ ⎜⎜ ⎝ ⎛ =
ΩH hydrogen bonding configurations.
There are 2 tetrahedral configurations in the Jirak structure which results in an the overall
number of configurations,
( )
(
of oxygenpositions)
open is site proton y probabilit ions configurat proton
of of protons
# # # × ⎟ ⎟ ⎟ ⎠ ⎞ ⎜ ⎜ ⎜ ⎝ ⎛ × ⎟ ⎟ ⎟ ⎠ ⎞ ⎜ ⎜ ⎜ ⎝ ⎛ = Ω 6 2 3× = = Ω
Ω =
Ω H tetradehral .
The configurational entropy of this phase,
K mol J K mol J R
Sconfig = lnΩ=8.314 ln(6)=14.9 ,
is the implied transition entropy because the low-temperature phase is completely ordered
(Sconfig = Rln1=0). If the low-temperature phase were disordered, the configurational
yield the transition entropy. Other disordered solid acids can be evaluated in a similar
fashion adapting ice rule (1) to accommodate the number of protons associated with each
tetrahedron.
1.3 Summary of Conclusions
Inconsistencies in the literature surround the high-temperature properties of
CsH2PO4. The decomposition behavior of the material without proper humidification or
efforts to minimize dehydration effects, such as sealing reactor containers, has led
researchers to refute the existence of the superprotonic phase transition. This work
presents neutron diffraction data that has enabled the assignment of deuterium positions
in the structure while providing insight into the local structure of the material through
pair distribution function analysis.
This work is the first to present neutron pair distribution function (PDF) analysis
of any solid acid material in the superprotonic phase. PDF data was collected on
CsDSO4, RbDSeO4, and CsD2PO4. The PDF shows a striking loss of long-range
correlations in the superprotonic phase, suggesting that despite high crystallinity and
mechanical integrity, local superprotonic structure is disordered comparable to a glass.
This loss of long-range atom pair correlations is most noticeable in the case of CsH2PO4.
An approach for determining the configurational entropy of this compound necessitates
considering configurations that would not be expected from the average structure
description (Bragg diffraction), while configurational entropy discussions on other
description. Coincidentally, long-range correlations, although reduced in RbDSeO4 and
CsDSO4 are not as severely diminished as in the high-temperature phase of CsH2PO4.
Debate over the high-temperature structure of CsDSO4 has been resolved utilizing
high-resolution neutron powder diffraction data [6-8]. Discussed in Chapter 3, the Jirak
structure assigns a single crystallographic oxygen and deuterium position to describe the
disorder of the sulfate tetrahedra. The Jirak structure was compared to split deuterium
and oxygen models. A Hamilton’s test on the significance of refined parameters
indicates the additional oxygen and deuterium sites do not improve the refinement.
Experimentally measured transition entropy values also agree well with the value of the
configurational entropy present in the Jirak structure.
RbHSeO4 high-temperature structure has been identified in the I41/amd space
group [6-8], discussed in Chapter 4. Despite differences in the low-temperature structure
of RbHSeO4 (B1 symmetry) and CsHSO4 (P21/c symmetry), the high-temperature phases
of these two materials are very similar. Refinement of the CsHSO4 structures (single vs.
split site models) against RbHSeO4 neutron diffraction data as well as a Hamilton’s test
indicate the superprotonic phase of RbHSeO4 is best described in Merinov’s split
deuterium and split oxygen site model [7]. Experimentally measured transition entropy
values agree well with the value of the configurational entropy present in the Merinov
structure.
Cation size effects have been observed in solid acid compounds, e.g., CsH2PO4
exhibits a superprotonic phase transition while RbH2PO4 does not. An increase in cation
size is also known to lower the superprotonic phase transition temperature. A generally
sulfate, selenate, phosphate tetrahedral to reorient. Differences in structural
transformations and symmetries between different compounds complicate the study of
the cation size effect. Chapter 6 presents a study on chemical intermediates CsxRb
1-xH2PO4 shown to crystallize in the CsH2PO4 structure, P21/m, for compositions CsH2PO4
through Cs0.2Rb0.8H2PO4. This large composition range maintains the same
crystallographic symmetry and allows comparisons of properties to be attributed solely to
a difference in average cation size. X-ray diffraction, thermal analysis, Raman, IR, 133Cs,
87Rb and 1H-NMR spectroscopy all attest to the gradual variation in structural properties
across the composition range. The limiting effective cation radius for a superprotonic
transition for this series has been determined to be Rsp≥ 1.649 Å.
Solid acid degradation unfortunately can be misconstrued as a superprotonic
transition and vice versa. To complicate matters, observing the superprotonic phase prior
to decomposition in some cases requires very precise temperature control and patience,
e.g., RbHSeO4, superprotonic phase is clearly discernable by powder X-ray diffraction in
the narrow temperature range from 170°C – 176°C. The complicated high-temperature
properties of Rb3H(SO4)2 which are misleading have been misinterpreted in the literature
as a superprotonic phase transition [9, 10]. Chapter 7 presents a careful analysis of a
conglomeration of data from different techniques which definitively conclude that at
ambient pressure, Rb3H(SO4)2 phase separates, Rb3H(SO4)2→ RbHSO4 + Rb2SO4.
1.4 References
1. Munch, W., et al. A Molecular-Dynamics Study of the High-Proton Conducting Phase of CsHSO4. Solid State Ionics, 1995, 77: 10 – 14.
3. Komukae, M., et al. Dielectric and Thermal Studies on New Phase-Transitions of CsHSO4. Journal of the Physical Society of Japan, 1981, 50(10): 3187 – 3188.
4. Chisholm, C.R.I. and S.M. Haile. Entropy Evaluation of the Superprotonic Phase of CsHSO4: Pauling's Ice Rules Adjusted for Systems Containing Disordered
Hydrogen-Bonded Tetrahedra. Chemistry of Materials, 2007, 19(2): 270 – 279.
5. Haile, S.M., et al. Solid Acid Proton Conductors: From Laboratory Curiosities to Fuel Cell Electrolytes. Faraday Discussions, 2007, 134: 17 – 39.
6. Jirak, Z., et al. A Neutron-Diffraction Study of the Superionic Phase in CsHSO4.
Physica Status Solidi a-Applied Research, 1987, 100(2): K117 – K122.
7. Merinov, B.V. Localization of Hydrogen Atoms in Protonic Conductors with a Dynamical Disordered Network of Hydrogen Bonds: Effect of Anomalous Manifestation of Hydrogen Atoms on Electron-Density Maps. Kristallografiya, 1997, 42: 906 – 917.
8. Zetterstrom, P. et al. Structure and Proton Conduction in CsDSO4. Solid State
Ionics, 1999, 116(3 – 4): 321 – 329.
9. Lim, A.R., et al. Ferroelastic Domain Switching Behaviors of Superionic
Conductor M3H(SO4)2 (M=K, Rb, and NH4) Single Crystals. Journal of Applied
Physics, 2006, 99(5).
Chapter 2
Experimental Techniques
2.1 Synthesis
Crystalline powder solid acid samples were synthesized by solvent-induced
precipitation, evaporating, or freeze drying an aqueous solution containing metal
carbonates (approx. 99% purity) or metal sulfates, where appropriate, and the acid of
choice:
(
)
cb a CO O H
nXO H O M H XO
H CO
M2 3 + 4 + 2 ⎯↑⎯2⎯,⎯2→ 4
where M = [Cs, Rb, K, Na, Tl, NH4, NH2CH2CH2NH2] and X = [S, Se, P, As]. Methanol
and acetone solvents were used independently to precipitate solid acid samples. Once in
solid form, solid acid samples were vacuum filtered over ceramic filters and rinsed with
methanol or acetone. In many cases, excess acid was necessary to ensure phase purity.
Most synthesis took place under ambient conditions. Whenever single crystal samples
were necessary, the aqueous solution of the stoichiometric composition was allowed to
evaporate off water slowly, either at ambient conditions or in a refrigerator.
Neutron diffraction studies in this work required deuterated analogs of solid acid
samples. Sample deuteration for this work was achieved ( > 99% deuteration) by
dissolving phase pure solid acid samples in D2O and then freeze drying the solution. This
process was repeated until there was no detectable 1H NMR peak in the sample. A list of
recipes for the solid acids of interest and a deuteration method is outlined in the
2.2 X-Ray Powder Diffraction
Powder samples were phase identified via X-ray diffraction (XRD) analysis at
room temperature on a Philips diffractometer (X’Pert Pro) using Cu Kα radiation.
Intensities were usually obtained in the 2θrange between 10° and 90° with a step size of
0.02° and a measuring time of 10.8 seconds at each step (scan speed 0.05 °/s, utilizing a
small area detector). High-temperature scans were achieved using an Anton Paar HTK
1200 oven over a temperature range from room temperature to 300°C. Philips X’Pert
Plus software was utilized to perform Reitveld refinements of the unknown phases [1, 2].
Silicon and nickel standards were utilized where appropriate.
2.3 Neutron Powder Diffraction
High-resolution neutron powder diffraction measurements were collected at the
Los Alamos Neutron Scattering Center (LANSCE) on the NPDF instrument [3].
Approximately 7 grams of each deuterated solid acid sample were carefully packed in a
glove box into cylindrical vanadium cans and sealed with lead wire. Powder diffraction
data were collected for 6 hours, at room-temperature and at higher temperatures
exhibiting a superprotonic phase. Rietveld refinements were completed with the GSAS
Rietveld code [4, 5].
2.4 NMR Spectroscopy
NMR measurements were performed on a Bruker DSX 500 MHz spectrometer
and a Bruker DSX 400 instrument (Bruker Analytische Messtechnik GmbH, Germany) at
9.4 T. Magic angle spinning (ωMAX=15 kHz), as well as static probes, were utilized.
2.5 Impedance Spectroscopy
The conductivity of pressed pellet samples (usual conditions: P = 4 tons, diameter
= 10 mm, 5 minutes pressing time) were measured under dry and wet nitrogen in the
temperature range of room-temperature to 270°C. Silver electrodes were painted onto the
surfaces of pressed sample pellets with silver paint (Ted Pella). A.C. impedance data
were collected over the frequency range of 20 Hz – 1 MHz using an HP 4284 precision
LCR meter at an applied voltage of 50 mV. Zview (Scribner Associates Inc.), a
least-squares refinement program, was utilized to fit the acquired impedance data to several
different equivalent circuits including (RQ), (R1Q1)(R2Q2), (R1)(R2Q2), etc., whereR
is resistance and Q is constant phase element with impedance ZQ = (Y(jω)n)-1; where j =
√-1, ω = frequency, Y and n are constants, and n ranges between 0 and 1 [7].
2.6 Thermal Analysis
2.6.1 Simultaneous Differential Scanning Calorimetry and Thermogravimetric
Analysis
Thermal analysis utilized in characterizing the phase transitions and chemical
stability of solid acids was primarily carried out on a Netzsch STA 499 C thermal
analyzer equipped with a Pfeiffer Vacuum Thermal Star attachment. This setup was used
to simultaneously collect differential scanning calorimetry (DSC), thermogravimetric
(TG), as well as mass spectroscopy data. This data allowed for the enthalpy of phase
transitions and weight change for the samples to be determined directly, as well as for
2.6.2 Drop Solution Calorimetry
To determine the enthalpies of formation, high-temperature drop solution
calorimetry in molten sodium molybdate solvent (3Na2O·4MO3) was performed in a
custom built Tian-Calvet microcalorimeter operating at 702 oC [8]. Pressed powder
pellets, 15 mg, were dropped from room temperature into molten sodium molybdate
solvent. An oxidizing atmosphere was maintained by flushing the solvent chamber with
oxygen gas at 100 ml/min. A voltage change in the thermopile was recorded and
integrated over time. A calibration factor based on the heat content of 15 mg Al2O3
pellets was employed to convert the integrated voltage versus time to enthalpy. The
solution calorimetry of sulfates in 2Na2O.4MoO3 solvent at 702 oC has been carried out
previously [8]. All of the samples in this study dissolved in approximately 40 minutes.
2.6.3 Thermomechanical Analysis
A Perkin Elmer TMA 7 Thermomechanical Analyzer was utilized for all
thermomechanical tests recording changes in probe position under an applied force at
various temperatures. Changes in probe position were used to signify and in some cases
distinguish between a solid to solid phase transition and a solid to liquid phase transition.
2.7 Raman Spectroscopy
A Renishaw Ramascope spectrometer was used to collect unpolarized Raman
spectra at ambient temperature from randomly oriented specimens. Data was collected at
liquid-N2-cooled CCD detector in the range of 100 to 2000 cm-1 providing an intrinsic
resolution of 1.5 cm-1 with calibrations accurate to ±1 cm-1. The Raman spectra were
excited by the 514.5 nm line of an Ar+ laser focused down to a 5 μm spot on the sample.
2.8 Infrared Spectroscopy
All IR measurements were executed on a Nicolet Magna 860 FTIR spectrometer.
Polarized transmission spectra wererecorded from 4000 to 400 cm–1 by averaging 400 or
morescans with 2 cm–1 resolution, using a GLOBAR infraredlight source, a KBr
beamsplitter, a wire-grid on CaF2 polarizer,and an MCT-A detector.
2.9 Melting Point Apparatus
A Thomas Hoover Uni-Melt Capillary Melting Point Apparatus was used in
conjunction with Thomas Scientific melting point standards—anthracene (m.p. 216°C)
and hydroquinone (m.p. 172°C)—to visibly identify melting points of solid acid samples.
Some solid acid samples suffer from incongruent melting which made access to a melting
point apparatus indispensable.
2.10 References:
1. X'Pert Plus. Philips Analytical B.V.: Almelo, 1999.
2. X'Pert HighScore. Philips Analytical B.V.: Almelo, 2002.
3. Proffen, T. 2007 [cited 2007 5/01/07]; Available from:
http://lansce.lanl.gov/lujan/instruments/NPDF/index.html.
4. Larson, A.C., and R.B. Von Dreele. "General Structure Analysis System
5. Toby, B.H., EXPGUI, a graphical user interface for GSAS. Journal of Applied Crystallography, 2001, 34: 210 – 213.
6. MestReC: NMR Data Processing Made Easy. Mestrelab Research: A Coruna, 2006.
7. Johnson, D. ZView. Scribner Associates, Inc., 2000.
Chapter 3
CsHSO
4This chapter will present the three best structural models reported in the literature for
the superprotonic phase of CsHSO4 (Jirak, Belushkin, and Merinov) [1-3]. Each model’s
refinement against new high-resolution neutron powder diffraction data will be compared in
order to establish which structure best describes the superprotonic phase of CsDSO4.
Insights of local structural information from neutron pair distribution function data in the
superprotonic phase will also be considered. Entropy calculations based on the three models
will be contrasted with experimental data.
3.1 Introduction
Solid acid compounds of MHXO4 stoichiometery, where M = Cs, Rb, NH4 and X = S,
Se, exhibit a superprotonic phase transition in which the proton conductivity jumps by 3 – 4
orders of magnitude. In this first-order phase transition, the compound exists in the
energetically favored structure (monoclinic) and switches to an entropically favored structure
(tetragonal) at elevated temperatures (Tsp = 414 K for CsHSO4). A notable feature of the
entropically favored structure is the partial occupancies of the oxygen and deuterium atom
positions which allow the compound to sample each configuration. This sampling of
configurations, or sulfate/selenate tetrahedral librations (frequency ~ 1 × 10¹² Hz), enables
protonic conductivity comparable to that of a liquid via the Grotthus mechanism. In the
Grotthus mechanism, proton migration proceeds by dipole (HnSO4n-2) reorientation, structural
relaxation and proton hopping. Despite sharp crystalline Bragg diffraction patterns, this
work presents pair distribution function analysis of solid acids revealing a slight loss of
superprotonic solid acids, such as high proton conductivity. As Bragg diffraction describes
the average structure of a compound, PDF analysis describes structure on a local scale.
Figure 3-1. CsDSO4 monoclinic refined structure at 333 – 313K. Hydrogen bonds form zigzag chains
along the c-axis of the unit cell.
In the monoclinic room temperature phase of CsHSO4, sulfate groups are linked by
fully ordered hydrogen bonds forming one-dimensional zigzag chains. For configurational
entropy calculations, this low-temperature phase can be considered to have zero
configurational entropy. The positions of oxygen atoms are fixed and the hydrogen bonds
are asymmetric with a single minimum (Figure 3-1).
An accurate description of the structure of the superprotonic phase is necessary to
enumerate the number of configurations that the sulfate or selenate tetrahedra are allowed to
changes. The goal of this chapter is to determine which structure best describes the
superprotonic phase of CsHSO4,based on high-resolution neutron powder diffraction data,
and then to compare implied configurational entropies for these models with experimental
data. The most important difference between the Jirak, Belushkin, and Merinov models of
CsHSO4 are the details of the sulfate group orientations which have direct implications on the
configurational entropy.
The high-temperature structures proposed by Jirak, Belushkin, and Merinov each
place cesium and sulfur in the 4a or 4b crystallographic sites of the I41/amd space group with
lattice parameters a ~ 5.7Å, c ~ 14.2 Å [1-3] (Table 3-1). The structures diverge in their
assignment of the oxygen and deuterium positions. The Jirak structure utilizes a 50%
occupied 32i site for the oxygen atomic coordinate and a 25% occupied 16f site for the
deuterium position. This arrangement yields two tetrahedral confirmations, traced in light
blue in Figure 3-2 (left).
The Merinov structure assigns one oxygen atom position to a 32i site (0.25
occupancy) and another oxygen position to a 16h site with 0.5 occupancy. The
corresponding deuterium sites lie on 16f (0.21 occupancy) and 8e (0.09 occupancy)
crystallographic positions. The Belushkin structure also splits the oxygen sites into two 32i
sites with 25% occupancy each and the deuterium positions into a 16f (0.246) and 8e (0.094)
site. Previous work in determining the configurational entropy of each model considered the
8e position in both the Belushkin and Merinov structures a negligible contribution and
ignored it to simplify counting hydrogen bonding configurations. The refinement presented
Merinov structures is reduced to under 0.03, which results in approximately 1/5 of a total
deuterium atom in a unit cell, Z = 4. The original occupancies in the Belushkin and Merinov
[image:45.612.80.545.170.547.2]structures exceed normally expected constraints of four hydrogen atoms per unit cell.
Figure 3-2. Jirak (top left), Belushkin (top center), and Merinov (top right) sulfate tetrahedral
orientations. The Jirak diagram is a fragment of a unit cell with the Cs atoms and deuterium atoms that are not hydrogen bonded deleted for clarity. The diagram shows the two tetrahedral orientations possible in the Jirak structure. Merinov and Belushkin structures each have four tetrahedral
3.2 Synthesis and Characterization Methods
CsHSO4 powder samples were precipitated out of a solution containing stoichiometric
amounts of Cs2SO4 and H2SO4 with acetone. The resulting powder was vacuum filtered and
dried in an oven at 90°C. X-ray diffraction patterns were collected to verify phase purity
after original synthesis and deuteration (Phillips X’Pert Pro, Cu Kα radiation, 0.02° steps, 11
s/step).
As hydrogen crystallographic positions are not reliably probed by X-rays, neutron
diffraction data was sought to determine the location of the hydrogen atoms in the unit cell.
CsHSO4 is known to be isomorphic to its deuterated analog, CsDSO4. Sample deuteration
was achieved ( > 99% deuteration) by the following method: Jirak Structure
Atom Site x y z Site
Occ.
Cs 4b 0.5 0.25 0.125 1
S 4a 0 0.75 0.125 1
O 32i 0.201(3) 0.678(8) 0.067(1) 4
D 16f 0.19(1) 0.5 0 1
Belushkin Structure
Atom Site x y z Site
Occ.
Cs 4b 0.5 0.25 0.125 1
S 4a 0 0.75 0.125 1
O 32i 0.0559(9) 0.5860(6) 0.2038(2) 2
O 32i 0.0273(15) 0.4928(6) 0.1607(3) 2 D 16f 0.25 0.5860(6) 0.25 0.98(28)
D 8e 0 0.25 0.1607(3) 0.188(14)
Merinov Structure
Atom Site x y z Site
Occ.
Cs 4a 0 0.75 0.125 1
S 4b 0.5 0.25 0.125 1
O 32i 0.6655(70) 0.3097(70) 0.0475(25) 2.00(8)
O 16h 0.7403(59) 0.25 0.0870(26) 2.04(12)
D 16f 0.666 0.5 0 0.84
[image:46.612.184.445.110.357.2]D 8e 0 0.25 0.087 0.18
1. Dissolve phase pure solid acid sample, CsHSO4, in D2O.
2. Freeze dry resulting solution in a flask isolated from ambient air with a glass
valve between flask and freeze dryer.
3. Inject D2O with a syringe through a rubber diaphragm to cover inlet orifice and
isolate sample from ambient air. Make sure all solid acid is dissolved and then
freeze dry.
4. Repeat step 3 at least five times to ensure high deuteration level. Check
deuteration level with 1H and 2H NMR, as in Figure 3-3. For neutron diffraction
data and especially for pair distribution function data, deuteration levels should be
> 99%. (Note: 1H NMR is an especially sensitive indicator of the presence of
crystallographic hydrogen.)
40 35 30 25 20 15 10 5 0 -5 -10 -15 -20
ppm
CsDSO 4
2
H NMR
1
[image:47.612.241.423.387.573.2]H NMR
Figure 3-3. Verification of deuteration level on CsDSO4 prior to neutron diffraction experiments. The
small 1H signal at 11 ppm indicates presence of hydrogen in the structure and incomplete deuteration.
3.3 Low- and High-Temperature Structure & Refinement Results
High-resolution neutron powder diffraction measurements were collected at the Los
Alamos Neutron Scattering Center (LANSCE) on the NPDF instrument. Approximately 7
grams of CsDSO4 powder solid acid sample were carefully packed in a glove box (Ar
atmosphere) into a 3/8” diameter cylindrical vanadium can and sealed with lead wire.
Powder diffraction data were collected for 6 hours for the low-temperature phase (T = 333 –
313K), and 6 hours in the superprotonic phase (T = 428K). Rietveld refinements were
completed with the GSAS Rietveld code [4, 5].
3.3.1 Refinement at 333 – 313K
Neutron diffraction data collected in the temperature range, T = 333 – 313 K, were
used to refined the Chisholm (2000) structure, P21/c for completeness [6] (Tables 3-2 & 3-3,
Figure 3-4). Overall, 147 variables were refined and the background was fit graphically
using a shifted Chebyschev with 36 terms for each histogram. Refined parameters include
cell parameters, Uani, atom coordinates for all atoms, absorption/extinction, scaling, profile
parameters, March-Dollase preferential orientation ratios and fractions for the {100}
directions. In estimating standard uncertainties, Uani and atomic coordinates were refined
concurrently. The final refinement converged to χ2 = 4.407 for 67 variables.
333-313K 428K
Space group: P21/c I41/amd
a (Å) 7.79579(11) 5.74146(26)
b (Å) 8.14963(11) 5.74146(26)
c (Å) 7.73332(11) 14.3007(14)
Z 4 4
V (Å) 458.864(7) 471.41(5)
Rp x 100 2.18
3.15 Jirak 2.98 Belushkin
2.90 Merinov
Rwp x 100 3.01
5.14 Jirak 5.00 Belushkin
4.97 Merinov
χ2 4.407
5.68 Jirak 5.377 Belushkin
5.292 Merinov
Table 3-2. Crystal Data and Structure Refinement Parameters for CsDSO4 at 333 – 313K and 428K
2 3 4 5 6
-2 0 2 4 6 8
10 Observed
Calculated Background Obs-Calc
CsDSO4, T = 60-40°C, Histogram1
Intensi
ty
d-spacing /Å
Figure 3-4. Neutron diffraction refinement results for CsDSO4, T = 333 – 313K (60 – 40°C), bank 1
Atom x y z U11 U22 U33 U12 U13 U23
[image:49.612.142.395.424.638.2]Cs 0.21541(29) 0.12817(30) 0.20548(29) 0.0209(13) 0.0282(11) 0.0285(13) 0.0012(11) 0.0088(10) 0.0031(11) S 0.7514(5) 0.1225(4) 0.2800(5) 0.0194(20) 0.0083(17) 0.0236(21) -0.0297(17) -0.0080(16) -0.0041(18) O1 0.5886(4) 0.2200(4) 0.1286(4) 0.0319(16) 0.0691(22) 0.0414(15) 0.0123(15) 0.0064(13) 0.0215(15) O2 0.66637(33) 0.06827(31) 0.40876(32) 0.0491(16) 0.0431(15) 0.0289(14) 0.0009(10) 0.0261(12) 0.0097(11) O3 0.89586(30) 0.25486(29) 0.85815(30) 0.0362(13) 0.0308(14) 0.0499(17) 0.0209(12) 0.0124(13) 0.0113(12) O4 0.8079(4) 0.99527(28) 0.1888(4) 0.0762(21) 0.0287(14) 0.0525(17) 0.0042(13) 0.0413(15) -0.0101(12) D1 0.6330(4) 0.28695(30) 0.0512(4) 0.0639(18) 0.0472(16) 0.0452(18) -0.0036(13) 0.0291(14) 0.0054(13)
The monoclinic phase refinement results agree well with published data. Thermal
parameters from the room-temperature refinement will be compared to that of the tetragonal
high-temperature phase refinement for reference. Refinement results for the monoclinic
phase are included in Tables 3-2 and 3-3, and Figure 3-3.
Neutron pair distribution function (PDF) data for CsDSO4in the monoclinic phase
indicate excellent agreement between the average structure and local structure as well as
long-range atom pair correlations (Figure 3-5 (left)). D – O bond distances determined by
atom pair correlations from peak positions in the PDF match that of the average structure
determined by Rietveld refinements (Figure 3-5 (right)). As the deuterium atom is not
expected to be very mobile in this phase, it makes sense that the D – O bond distance is
preserved between average and local structural descriptions.
2 4 6 8 10 12 14 16 18 20
-1 0 1 2 O-O , C s -O , S -O, Cs -C s , S-S, D -O , S-D 7. 78Å C s -O , O -D , 3. 22Å
O-O, D-O, Cs
-S , 3 .9 1 Å S-D , 2. 65Å O -O , 2. 41Å S-O , 1. 44Å r/Å G( r)/ Å -2
CsDSO4 T = 50°C
O -D , 0. 96Å Bond PDF Bond Length, Å Bragg Diffraction Structural Refinement
Bond Length, Å
D – O 0.96 0.96
S – O 1.44 1.41,1.44, 1.47, 1.59
O – D 1.65 1.697
O – O 2.41 2.38, 2.44
S – D 2.65 2.68
Cs – O 3.22 3.12, 3.69, 3.88
O – D 3.22 3.36
Figure 3-5. (left) Pair distribution function plot of CsDSO4, T = 333 – 313K (60 – 40°C) illustrates long-
3.3.2 Refinement at 428 K, (155°C)
Neutron diffraction data collected at T = 428 K were used to refine the Jirak,
Merinov, and Belushkin CsHSO4 structures in the I41/amd space group. The least-squares
refinement began by preparing a generic refinement without oxygen or deuterium positions.
The generic least-squares refinement included lattice parameters, Uani, atom coordinates for
cesium and sulfur atoms, absorption/extinction, scaling, and profile parameters. The
background was graphically fitted to a 36-term shifted Chebyschev polynomial for each
histogram. In the initial stages, each of the atomic coordinates, thermal, and lattice
parameters were refined independently and successively updated in subsequent cycles. The
final generic refinements each converged to χ2 = 14.32 for 6 variables.
Once the generic refinement was prepared, each structure was subjected to a
refinement using the profile parameters and fitted background from the generic refinement.
The least-squares refinement on each structure included only the anisotropic thermal
parameters for all atoms and atomic coordinates. In the case of the Belushkin and Merinov
structures, the fractional occupancy of the split deuterium positions was also refined with the
constraint that the structure contain the stoichiometric number of deuteriums (Z=4, CsDSO4,
4 total deuteriums per unit cell). The Merinov structure final refinement converged to χ2 =
5.292 for 10 variables (91 variables refined overall). The Belushkin structure final
refinement converged to χ2 = 5.377 for 23 variables (94 variables overall), while the final
Jirak refinement converged to χ2 = 5.68 for 18 variables (80 overall) (Table 3-2, Figure 3-6).
Thermal parameters and atom coordinates were refined separately in the final refinement to
allow for standard uncertainties to be determined for each set of parameters while preserving
The difference in χ2 between the three structures is not significant enough to decide
which structure is the best description of CsHSO4. The Belushkin and Merinov structures
incorporate a split oxygen and deuterium site model which adds more parameters for
refinement so the χ2 value is not necessarily a valid comparison of the three structures. As χ2
is not significantly better, including the split atom positions, the Jirak structure may describe
the high-temperature structure more accurately than the Belushkin and Merinov structures.
The three refinements yield differences curves which are not identical but are not
different enough to support one structure over the other as a superior fit for the high
temperature phase of CsDSO4 (Figure 3-6). Employing a Hamilton test on the significance
of the R factor for the three refinements can help determine if the oxygen and deuterium
positions are constrained to a single site, according to these refinements[7].
The Hamilton’s test indicates whether the addition of parameters to a least-squares
refinement results in a significant improvement or significant worsening of the agreement
between observed and calculated structure factors. In this test, a ratio of generalized R
factors is compared to tabulated values to determine the significance level at which a model
2 3 4 5 6
-2 0 2 4 6 8 10 In te n s it y d-spacing /Å BELUSHKIN
2 3 4 5 6
-2 0 2 4 6 8 10 JIRACK Inte n s it y d-spacing /Å Observed Calculated Background Obs-Calc
2 3 4 5 6
-2 0 2 4 6 8 10 d-spacing /Å Int ensi ty MERINOV
Figure 3-6. Neutron diffraction refinements of CsDSO4, T = 428K (155°C), bank 1 into Belushkin (left),
Jirak (center), and Merinov (right) structures. Experimental results are indicated in black, refined pattern in red, background in green, and difference curve in blue. Comparing the three structures via the
can be rejected or accepted. As the ratio of R factors is relatively insensitive to how the R
factors are computed, we employ a ratio of the weighted R factors,
wp wp R R 0 1 =
ℜ , where
(
)
⎥ ⎥ ⎥ ⎦ ⎤ ⎢ ⎢ ⎢ ⎣ ⎡ − =∑
∑
i o i i i c i o i i wp F w F F w R 2 2 , wpR1 is the weighted R factor for a structure resulting from a
refinement with restraints on some of the parameters and
wp
R0 is that of an unrestricted
least-squares refinement.
As the Merinov and Belushkin structures split the oxygen and deuterium sites, either
of these models can be used as the unconstrained model. The Jirak model constrains the
oxygen and deuterium sites to a single site each.
(Jirak) O and D atoms have a single crystallographic site each: O—32i, D—16f.
(Merinov) The O atoms are split into two sites: 32i and 16h, and the D site is split between a 16f site and a 8e site.
(Belushkin) The O atoms are split into two 32i sites and the D atoms are split into 16f and 8e sites.
The number of parameters refined in these three cases were mJirak = 80, mMerinov = 91,
and mBelushkin = 94. There were 257 reflections. The weighted R factors achieved were RJirak
= 0.0514, RMerinov = 0.0497, and RBelushkin = 0.05.
Let us test the hypothesis:
H0: O and D each reside on a single crystallographic site.
To test this hypothesis, the weighted R factor for the restrained model (Jirak) corresponds to
the hypothesis and the unrestrained model (Belushkin or Merinov). The appropriate R-factor
034 . 1 0497 . 0 0514 . 0 = = = ℜ Merinov Jirack R R . 028 . 1 05 . 0 0514 . 0 = = = ℜ Belushkin Jirack R R
The dimension of the hypothesis is in the first case, mMerinov -mJirack =11 and in the second
case, 14mBelushkin -mJirack = , and the number of degrees of freedom for the refinement is
163 m
-n ≈ . Values of ℜinterpolated from the Hamilton tables—
084 . 1 005 . 0 , 163 , 11 = ℜ 053 . 1 1 . 0 , 163 , 11 = ℜ 042 . 1 25 . 0 , 163 , 11 = ℜ 031 . 1 5 . 0 , 163 , 11 = ℜ
—suggest that the error in rejecting the hypothesis of oxygen and deuterium atoms each
occupying a single crystallographic site is on the order of 50%.
The Hamilton test applied to evaluate the significance of added O and D sites
suggests that a single O and D site hypothesis cannot be rejected at the 50% significance
level. The results of this neutron diffraction experiment do not reject the Jirak model.
The refinements of the 8e deuterium position in the Belushkin and Merinov structures
resulted in a decrease of the original occupancy ~ 0.09 → 0.028 or 0.027 occupancy (Tables
3-1 & 3-5). This confirms that this site’s contribution is negligible to the configurational
entropy according to this set of neutron diffraction data.
The thermal parameters of the three refined structures vary widely for the oxygen and
0.176 Å2