Abstract — This work presents the analysis of results obtained through a simulation presented previously in ICEUBI 2017. The simulation was built for obtaining results that will be analysed on the present work. With these results it is intended to show the feasibility of the study and development of a switched reluctance machine capable of replacing the flywheel on the internal combustion engines. This system will improve the efficiency in terms of consumption and dynamic parameters.
Index Terms — Internal combustion engine, flywheel, switched reluctance motor
I. INTRODUCTION
The combustion engine is, nowadays, the most widely used source of mechanical energy for vehicle locomotion. Although combustion engines are in decline due to the evolution of electric vehicles, there is still a long way to go in order for this technology to go obsolete. The research and development of more efficient internal combustion engines is still a challenge that has strong support from the transport industry [1]. Several technologies have emerged in recent years to reduce emissions from internal combustion engines and to increase their efficiency. Advancements such as the introduction of cylinder deactivation systems, valve opening time variation systems, exhaust gas recirculation systems, turbocharger systems, among many others are the proof that these engines still have a long way to go [1].
Manuscript received March 7, 2018; revised April 12, 2018.
This work has been supported by the project Centro-01-0145-FEDER-000017 - EMaDeS - Energy, Materials and Sustainable Development, co-financed by the Portugal 2020 Program (PT 2020), within the Regional Operational Program of the Center (CENTRO 2020) and the European Union through the European Regional Development Fund (ERDF). The authors wish to thank the opportunity and financial support that permitted to carry on this project. And C-MAST/ Centre for Mechanical and Aerospace Science and Technologies. project UID / EMS / 00151/2013 C-MAST, POCI-01-0145-FEDER-007718
Daniel S. Cardoso is with the Department of Electromechanical Engineering, University of Beira Interior, Calçada Fonte do Lameiro, 6201-001, Covilhã, Portugal and and C-MAST - Centre for Mechanical and Aerospace Science and Technologies; phone: +351 275 242 055; e-mail:
Paulo O. Fael is with the Department of Electromechanical Engineering, University of Beira Interior, Calçada Fonte do Lameiro, 6201-001, Covilhã, Portugal and C-MAST - Centre for Mechanical and Aerospace Science and Technologies; phone: +351 275 242 055; e-mail:
This paper presents the results obtained through a simulation that analysed the viability of a system that replaces the flywheel of the internal combustion engines. This flywheel can be found on combustion engines and its purpose is to accumulate energy while the engine produces work, to release it later when no work is being produced and energy is required to continue the engine.
This study simulates a system composed by a Switched Reluctance Machine (SRM) connected to the crankshaft of the combustion engine. The SRM acts as a generator during the time that work is produced by the combustion engine, converting mechanical energy into electrical energy that is stored on a supercapacitor. This energy is then used, by the SRM, acting as a motor when work is not produced by the combustion engine.
The aim of this system is to adapt and adjust the load when acting as a generator to the required power demand when acting as a motor, in the traditional inertia flywheel system this adaptation is not possible. This is due to the fact that with higher rotations the flywheel could be reduced significantly, which in conventional systems is not possible. A further goal is to reduce vibrations by stabilizing the combustion engine. In the latter case, the motor / generator system would act as a damper: at positive work spikes this will consume much of that work and, on the contrary, will provide work on the negative torque peaks.
However, there are other advantages in implementing this system, such as: using energy harnessed from other parts of the vehicle to assist the combustion engine's operation by giving it the ability to increase speed more quickly or by compensating for times when load applied to the combustion engine is higher.
This simulation was performed using the programming tool SIMULINK®, and the complete explanation about the construction of the simulation can be found on [2].
II.SIMULATION
On Fig. 1, it is possible to see all blocks and connections that make the configuration of the system introduced posteriorly.
Fig. 1. Layout of all simulation
The principal two blocks are Single Cylinder Four Stroke Engine and Switched Reluctance Motor Generator. The first block represents the internal combustion engine and the output from this block is the torque produced in function of the characteristics attributed to the engine in the inputs. The second block represents the electric machine and one of the inputs of this block is the signal that indicates the position of the internal combustion engine.
According to the strokes of the engine, the electric machine will act as a motor and a generator. If the electric machine works as a generator, the torque output will be negative and compensate the higher torque produced by the combustion engine. On the other hand, when the electric machine produces positive torque this will increase the low or negative torque from the engine. All the other blocks, such as Converter, Voltage Regulator, Position Sensor and
Command Generator Motor have function as control of the whole the system.
III. OPERATING PARAMETERS
The simulation takes into account many parameters that can be changed so as to simulate different engine sizes and different configurations for the electric machine. Some of these can be obtained from other references or arbitrated to test and discard some doubts that can occurred.
A. Internal Combustion Engine
To obtain the present results, the geometric parameters from the Honda® GX 160 were used. This is an engine known from many experiments due to its simplicity and versatility.
Table I
Geometric parameters from the engine Geometric Parameters Honda® GX 160
Bore 0.068 m
Stroke 0.045 m
Compression ratio 9:1
B. Switched Reluctance Machine
The parameters for the switched reluctance machine are chosen differently from the combustion engine parameters.
This is due to the fact that the electric machine needs to be adapted to the engine in order to correct the torque produced by this. The parameters have suffered a long process of optimization with the aim of improving the results in terms of torque correction and to adapt the interference of the electric machine along the increase of the rotation [3-4].
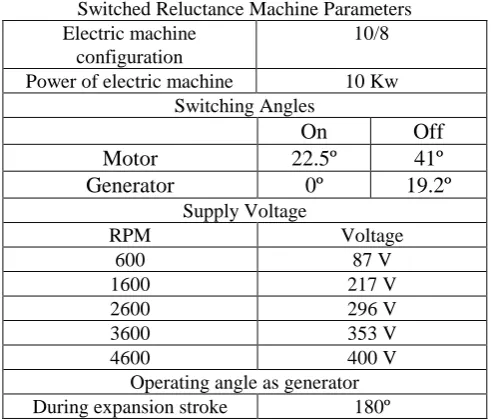
Table II
Switched Reluctance Machine Parameters Electric machine
configuration
10/8 Power of electric machine 10 Kw
Switching Angles
On
Off
Motor
22.5º
41º
Generator
0º
19.2º
Supply Voltage
RPM Voltage
600 87 V
1600 217 V
2600 296 V
3600 353 V
4600 400 V
Operating angle as generator During expansion stroke 180º
IV. OBTAINED RESULTS
The simulations as an optimization process were performed in 5 steps of rotation. The first step is 600 RPM. This was chosen because it is the lowest speed at which the
Honda® GX 160 engine works properly. After that, the simulations were performed with an increase of 1000 RPM until we reach the 4600 RPM.
[image:2.595.304.550.424.634.2]machine with the combustion engine, the electric machine torque and the combustion engine torque will be presented as followed.
The simulation time has been always adjusted as a function of the speed of rotation of the system, so that each simulation is carried out at 720 ° rotation required to complete a complete combustion engine cycle.
Table III Results to 600 RPM
Resultant standard deviation 57 N.m Standard deviation electric machine 45 N.m Standard deviation combustion engine 76 N.m Resulting average torque 26 N.m Average electric machine torque 0 N.m Average combustion engine torque 26 N.m
Simulation time 0.2s
Fig. 2. Results obtained for 600 RPM, in this order: Position of the crankshaft (PC in degrees), Electric machine (TSRM) and combustion engine (TICE) torque (N.m), Resultant torque (TR) (N.m).
Table IV Results to 1600 RPM
Resultant standard deviation 55 N.m Standard deviation electric machine 44 N.m Standard deviation combustion engine 75 N.m Resulting average torque 26 N.m Average electric machine torque 0 N.m Average combustion engine torque 26 N.m
Simulation time 0.075s
Fig. 3. Results obtained for 1600 RPM, in this order: Position of the crankshaft (degrees), Electric machine and combustion engine torque (N.m), Resultant torque (N.m).
Table V Results to 2600 RPM
Resultant standard deviation 60 N.m Standard deviation electric machine 31 N.m Standard deviation combustion engine 75 N.m Resulting average torque 26 N.m Average electric machine torque 0 N.m Average combustion engine torque 26 N.m
Simulation time 0.046s
Fig. 4. Results obtained for 2600 RPM, in this order: Position of the crankshaft (degrees), Electric machine and combustion engine torque (N.m), Resultant torque (N.m).
Table VI Results to 3600 RPM
Resultant standard deviation 62 N.m Standard deviation electric machine 24 N.m Standard deviation combustion engine 74 N.m Resulting average torque 26 N.m Average electric machine torque 0 N.m Average combustion engine torque 26 N.m
[image:3.595.312.541.47.222.2] [image:3.595.48.292.280.575.2] [image:3.595.307.548.283.571.2]Fig. 5. Results obtained for 3600 RPM, in this order: Position of the crankshaft (degrees), Electric machine and combustion engine torque (N.m), Resultant torque (N.m).
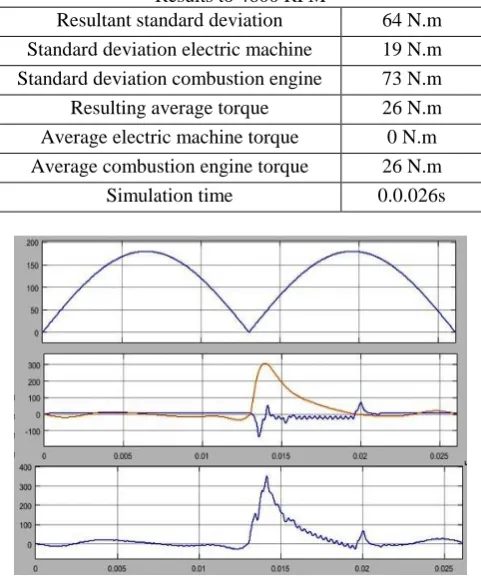
Table VII Results to 4600 RPM
Resultant standard deviation 64 N.m Standard deviation electric machine 19 N.m Standard deviation combustion engine 73 N.m Resulting average torque 26 N.m Average electric machine torque 0 N.m Average combustion engine torque 26 N.m
Simulation time 0.0.026s
Fig. 6. Results obtained for 4600 RPM, in this order: Position of the crankshaft (degrees), Electric machine and combustion engine torque (N.m), Resultant torque (N.m).
V.DISCUSSION OF RESULTS
[image:4.595.54.283.48.222.2]The standard deviation of the resulting torque relative to the combustion engine torque reveals improvements in all the ranges of rotation and are more significant at lower rotations. In some cases, as can be seen in Fig. 7, there are improvements in the order of 20 Nm. This progress of the machine in relation to the combustion engine was carried out keeping in mind that with the increase of the rotation the combustion engine will lose the need for help to fill the strokes in which it does not produce torque.
Fig. 7. Evolution of the standard deviation along the rotations
Another important point is that it has been possible to keep the average torque from the electric machine slightly below 0 Nm, since this implies a zero energy balance between the energy produced as a generator and consumed as a motor, which was also desirable since the objective was to cancel the inertia flywheel and not generate more than necessary power as this would imply a reduction of the available torque at the output of the combustion engine and the torque with a larger standard deviation value. The average torque of the combustion engine has been also maintained without changes. This fulfils the initial goal, since the goal was to correct this and not make changes in their mean value. Therefore, the results are as initially intended.
VI. CONCLUSIONS
From the research it was still noticeable that a system like the one proposed would cover some flaws in developing technologies and triggering a series of advances necessary for modern technologies to emerge [5]. This type of system is part of the development lines that the largest manufacturers of combustion engines tend to follow by making the means of transport increasingly efficient and environmentally friendly.
The option to build the simulation proved to be an asset for the future development of the project, since it saved a considerable amount of resources that could be wasted if the feasibility of the idea of this system was not verified.
All the simulation performed as expected, the fact that it was performed using magnetization curves obtained by means of finite elements, came to bring more support to the whole simulation since one of the main doubts would be the behaviour of the electric machine in its switching from motor to generator. On the other hand, the fact that the combustion engine is modelled using theoretical cycles suggests that there may be improvements in terms of results, there is still an endless number of variations and combinations of factors that could be performed to seek better results.
[image:4.595.305.547.54.193.2] [image:4.595.48.289.281.572.2]realistic and analytical magnetization characteristics,”
IEEE, pp. 1556–1561, 2005.